It’s an odd feeling when multiple forecasts play out all at once. It’s exciting, probably not unlike drawing several royal flushes in a row. Except, in the case of the markets, it has less to do with the luck of the draw and everything to do with detecting how the house has rigged encouraged a particular outcome.
DXY is about to tag the next lower target we set back on May 1, 2017.


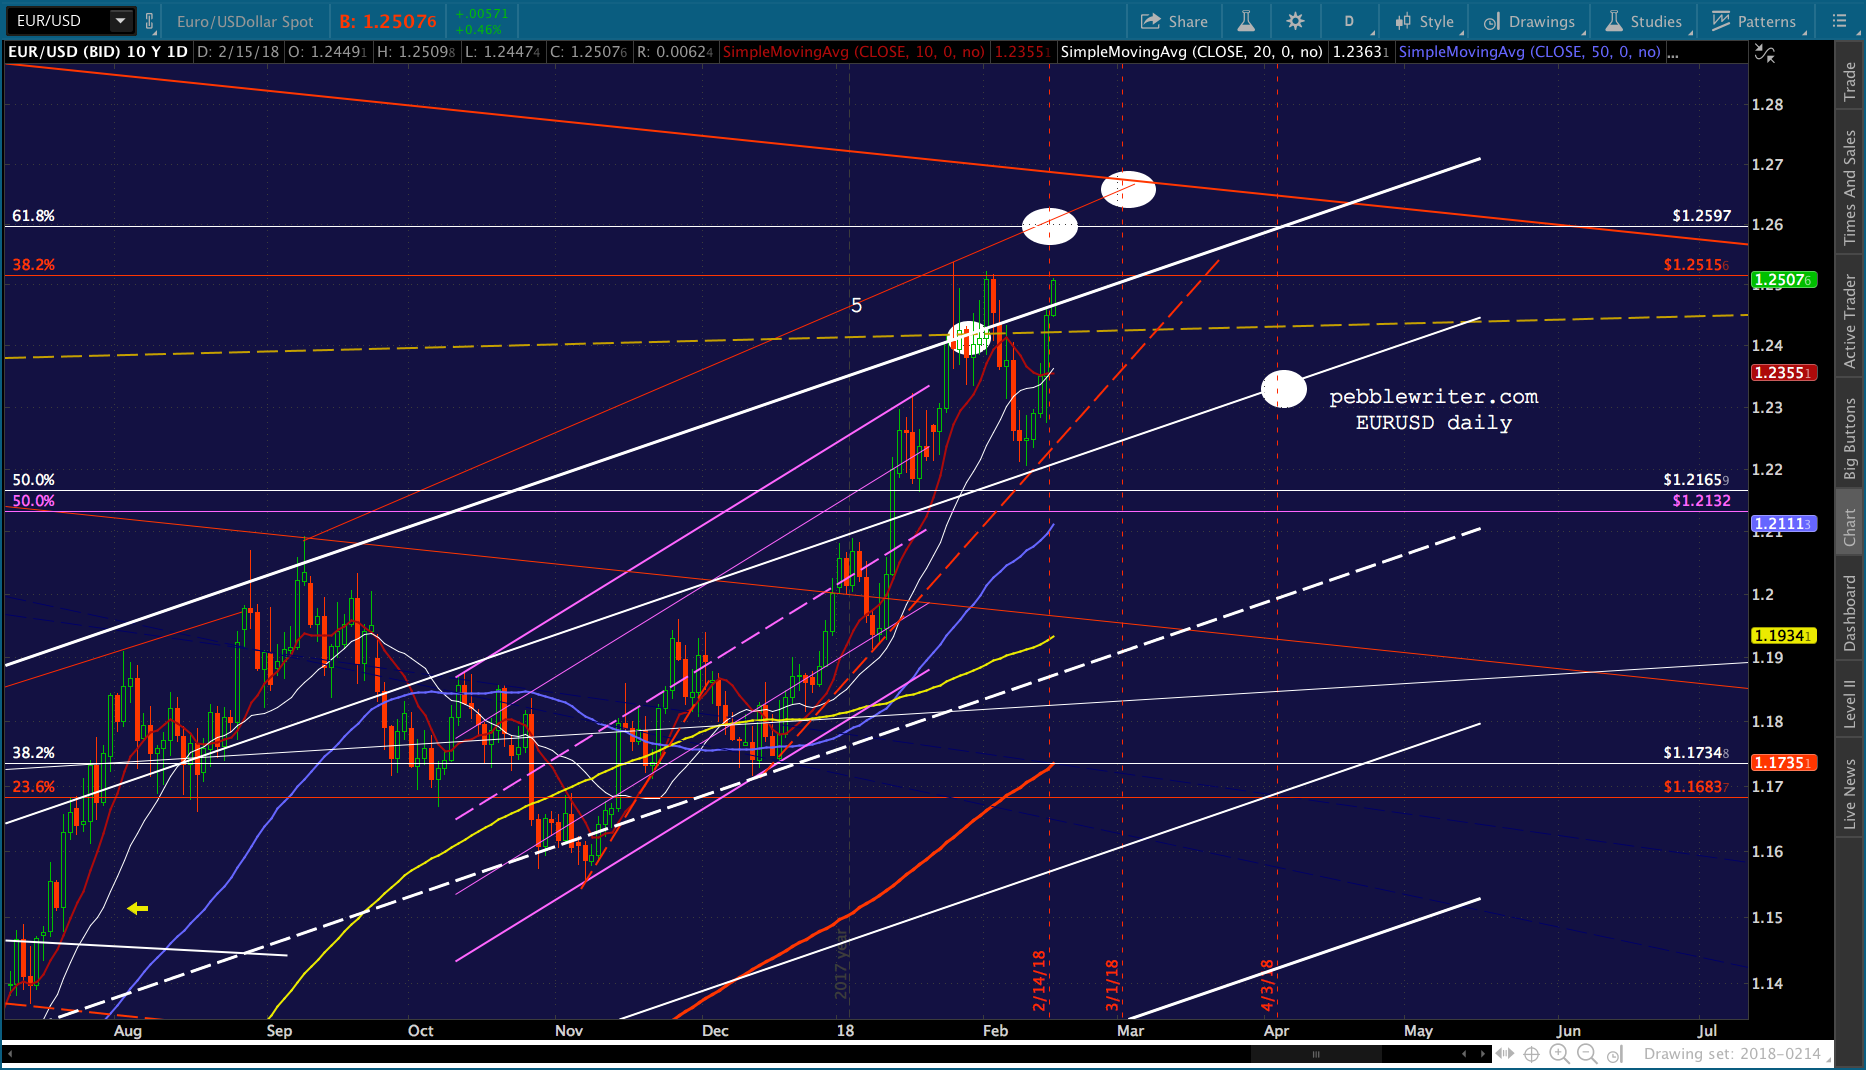
EURUSD is within .0043 of the target we set on Jan 8.


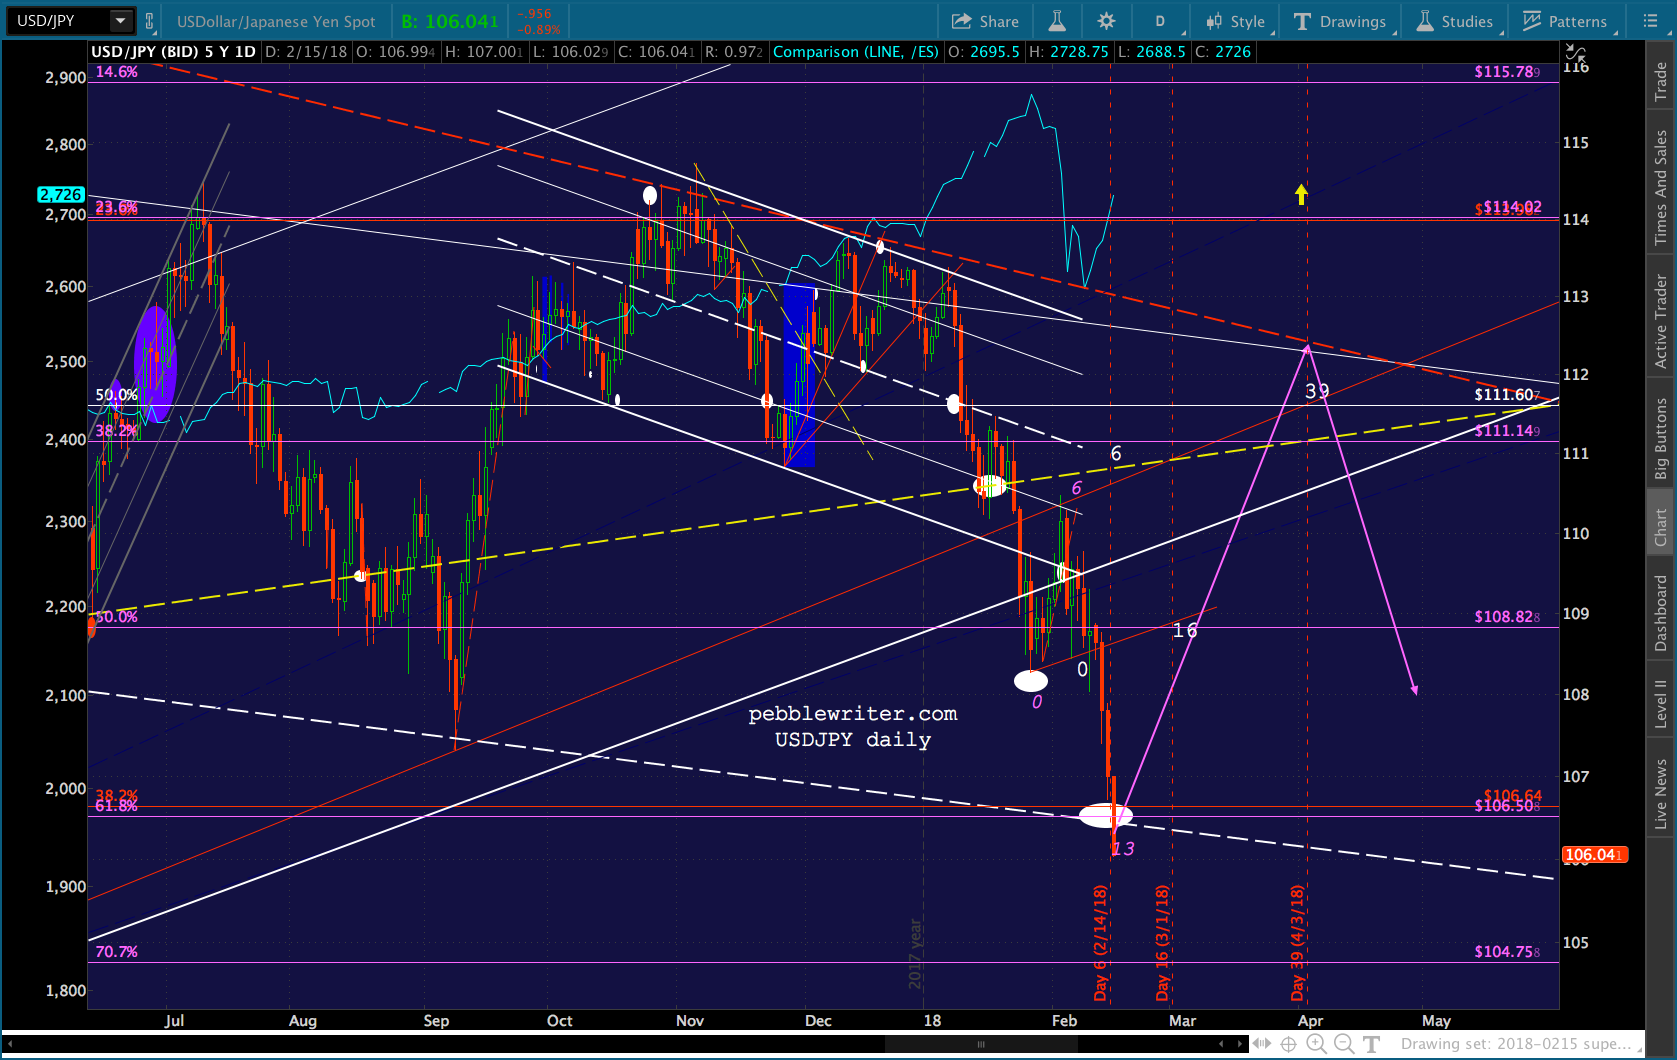
And, USDJPY just reached a target we set last October.


On the bond side, the 10-yr note has slightly overshot our 28.56 target from Jan 10...
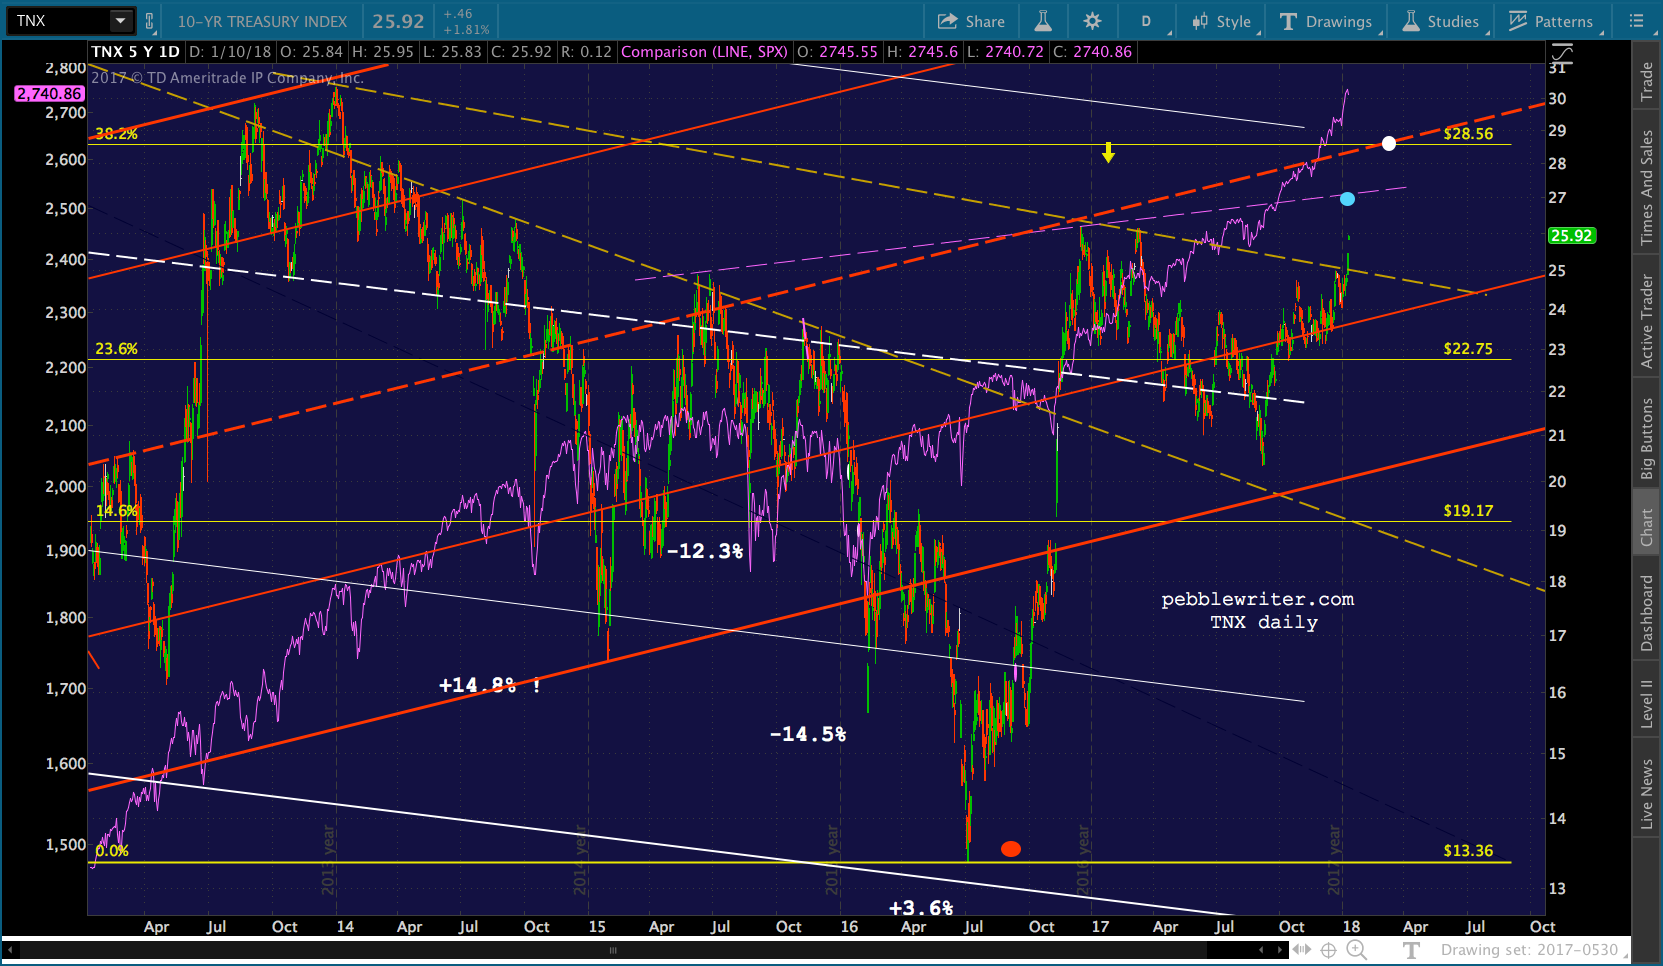

…which could potentially accelerate the yellow channel bottom tag posted on Jan 31.


Perhaps the most satisfying results have been on the equity front. After many false alarms during the Great Meltup of 2017, we wondered on Jan 30 why we weren’t getting the usual instantaneous recovery and included 2703 to our downside case for SPX. We added 2732 and 2533 on Feb 2. SPX nailed our 2533 target a week later (2532.69.)


As SPX was tumbling on Feb 6, however, an analog became apparent [see: Analog Watch.] If it played out, the bounce from the upcoming lows would be very sharp and VIX would collapse from its then current value of 49.21 to 19.10 (refined on Feb 7) by Feb 14.


After SPX bottomed at our 2533 target, we set 2765 on Feb 14 as our initial upside target. This was modified on Feb 12 to 2719. Earlier this morning, SPX reached 2717.66 — a nice 184-pt bounce from our buy signal at 2533. While a day late, this qualifies as pretty decent outcome. And, we’re not done yet.
 My point in presenting the above isn’t to toot my own horn (okay, maybe just a little.) Rather, it’s to point out that by understanding the motives and methods of those pulling the levers, and paying attention to chart patterns, Fibonacci patterns and analogs, reasonably accurate forecasts can be made.
I heard a financial commentator say, this morning, that higher interest rates must not be that big a deal. The 10-yr was pushing 3% and stocks were soaring, so all the anxiousness we saw over the past couple of weeks was overdone.
This is one of the silliest things I’ve heard all week. To this, I would say don’t confuse the ability of algos (which, as we saw last week can push stocks in both directions) to rescue markets with an economically sound framework.
The corollary, of course, is don’t confuse the market with the economy. The US might well be way in over its head, with $100 trillion in obligations (most of which would cost more to meet if rates continue to rise), a growing budget deficit, and consumers who are piling on debt in order to keep up with actual inflation.
But, that doesn’t mean the party is over — at least, not yet.
continued for members…
Here’s our current forecast for SPX, updated through last night. I think it would be a good idea to flesh it out a little. First, my assumptions. The biggest variable is VIX, which has still not declared whether it’s following the red or the white channel. If the red, then 13.32-14.13 is on the table, and SPX could easily make it up to the .618 at 2745 today. The line in the sand is about 19.7, but it’s simply too early to say.
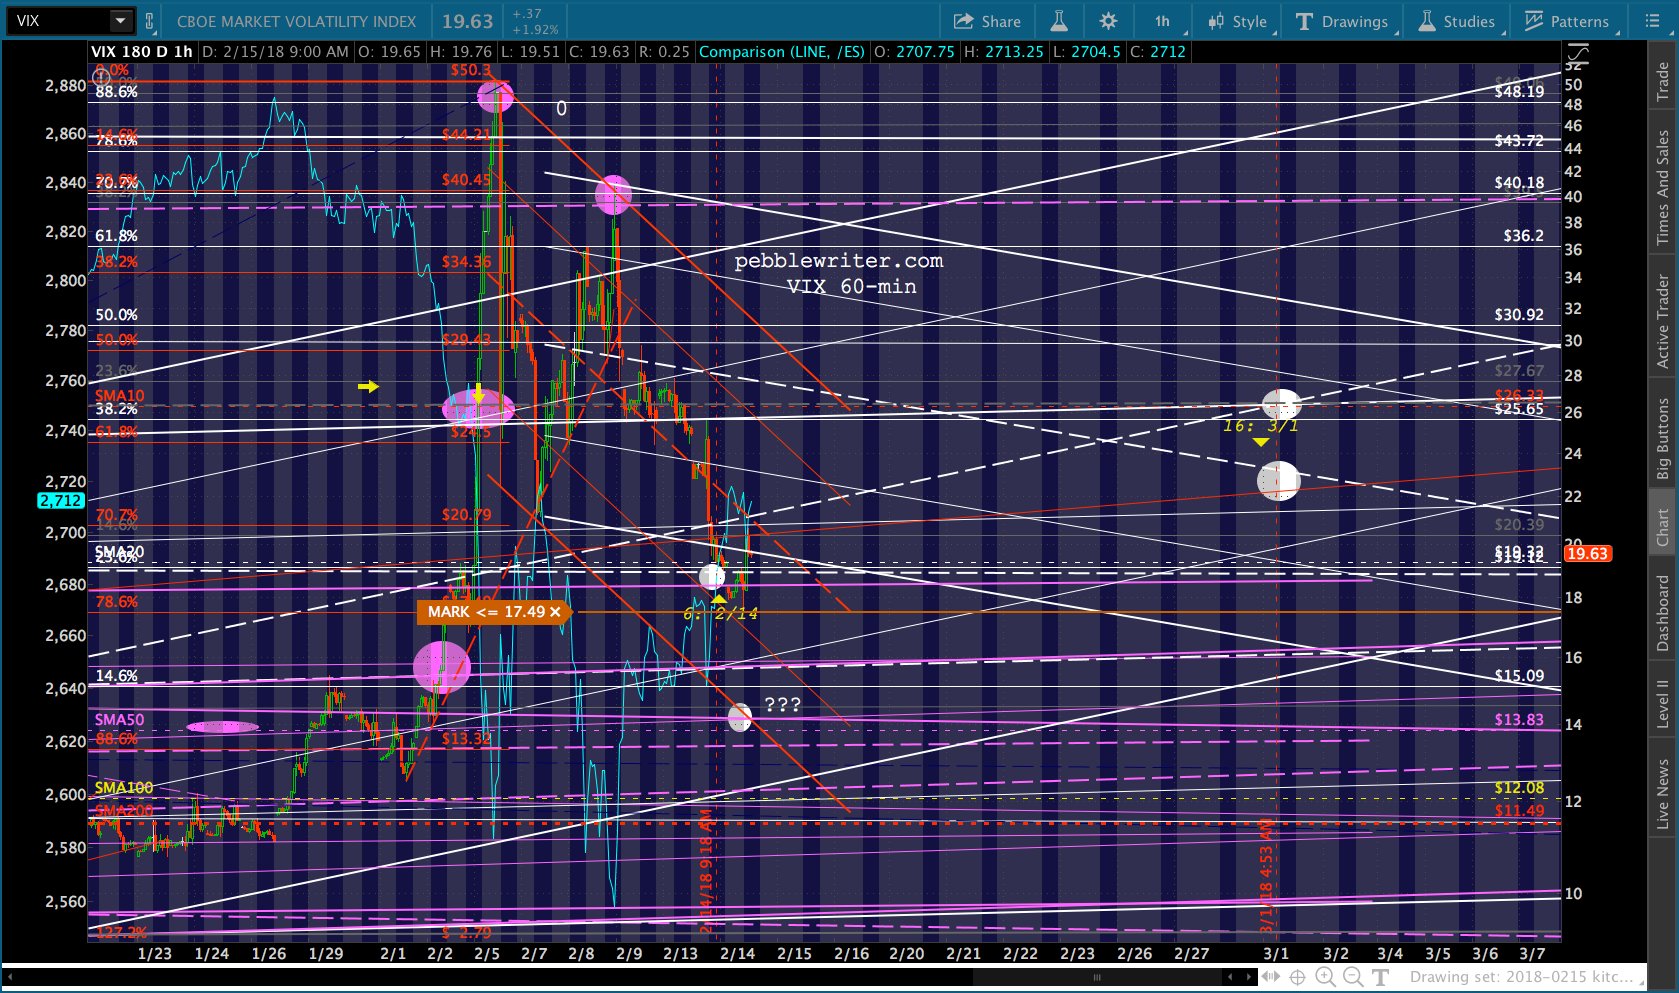 I continue to view TNX as an overshoot, and assume it will hold in this general area — possibly for quite a while. ZN could go sideways for months and tag the yellow channel bottom at 119’180 — or, it could zip down there in the next few minutes. Too hard to say.
 DXY could also go sideways for a while, making it look like it’s bottomed until the right moment comes along. I have assumed it would lead the next leg down in stocks (if/when.)
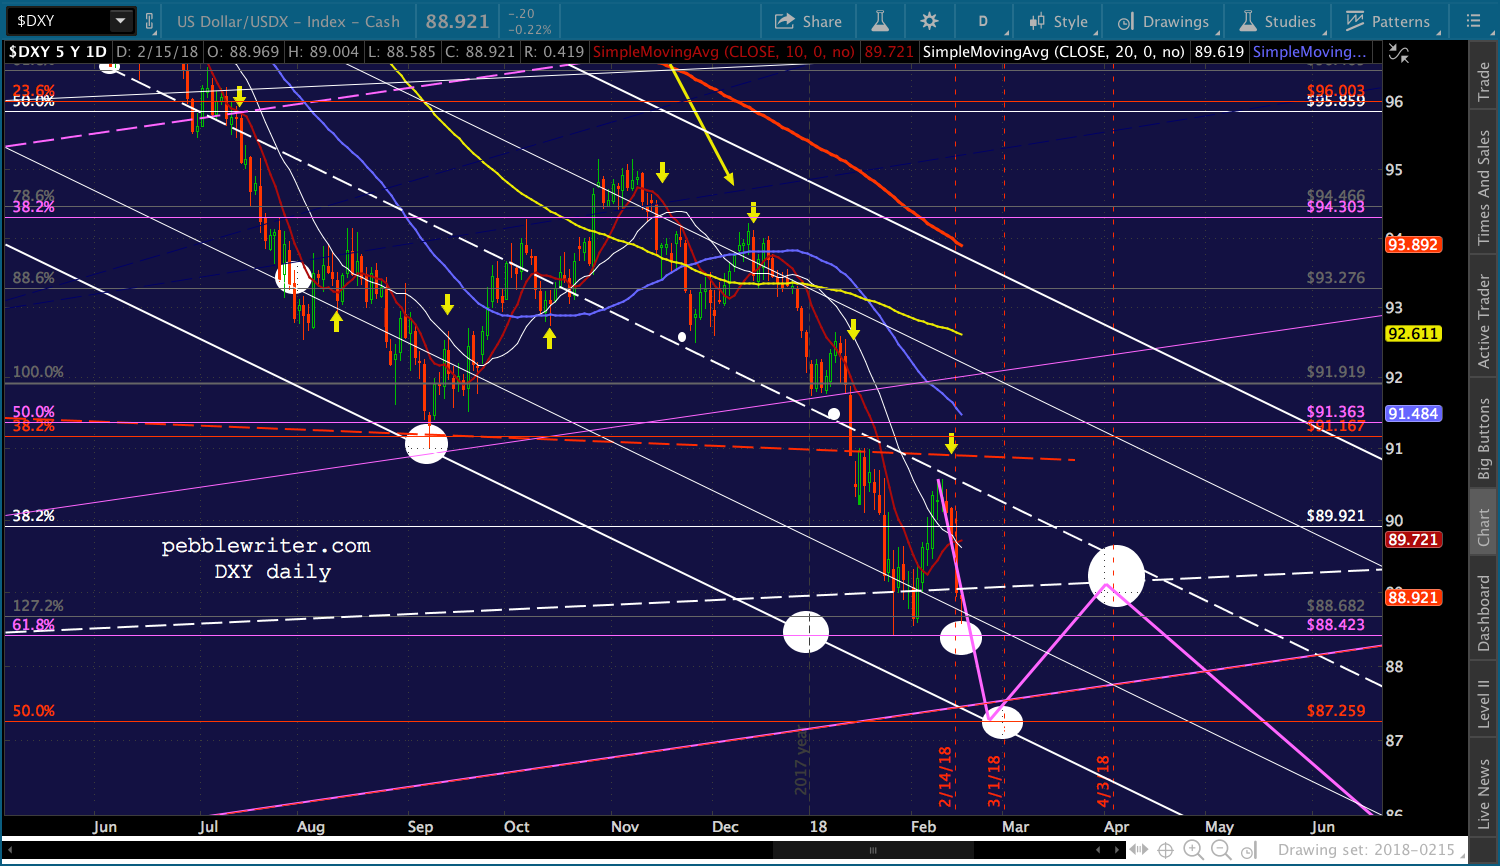 This only matters, of course, because of the implications for EURUSD and, by extension, to USDJPY. If EURUSD pops up to 1.2597 (or the little overshoot to 1.2670) then that dollar weakness would fit with DXY continuing to drop, but makes it tougher for USDJPY to rebound.
The euro has about 4X the weight as the yen in DXY, so it is possible — just more difficult. This matters because we’d need USDJPY to drive stocks via a bounce off 106.50 while VIX is resetting for its next leg down — scheduled to begin on Mar 1.
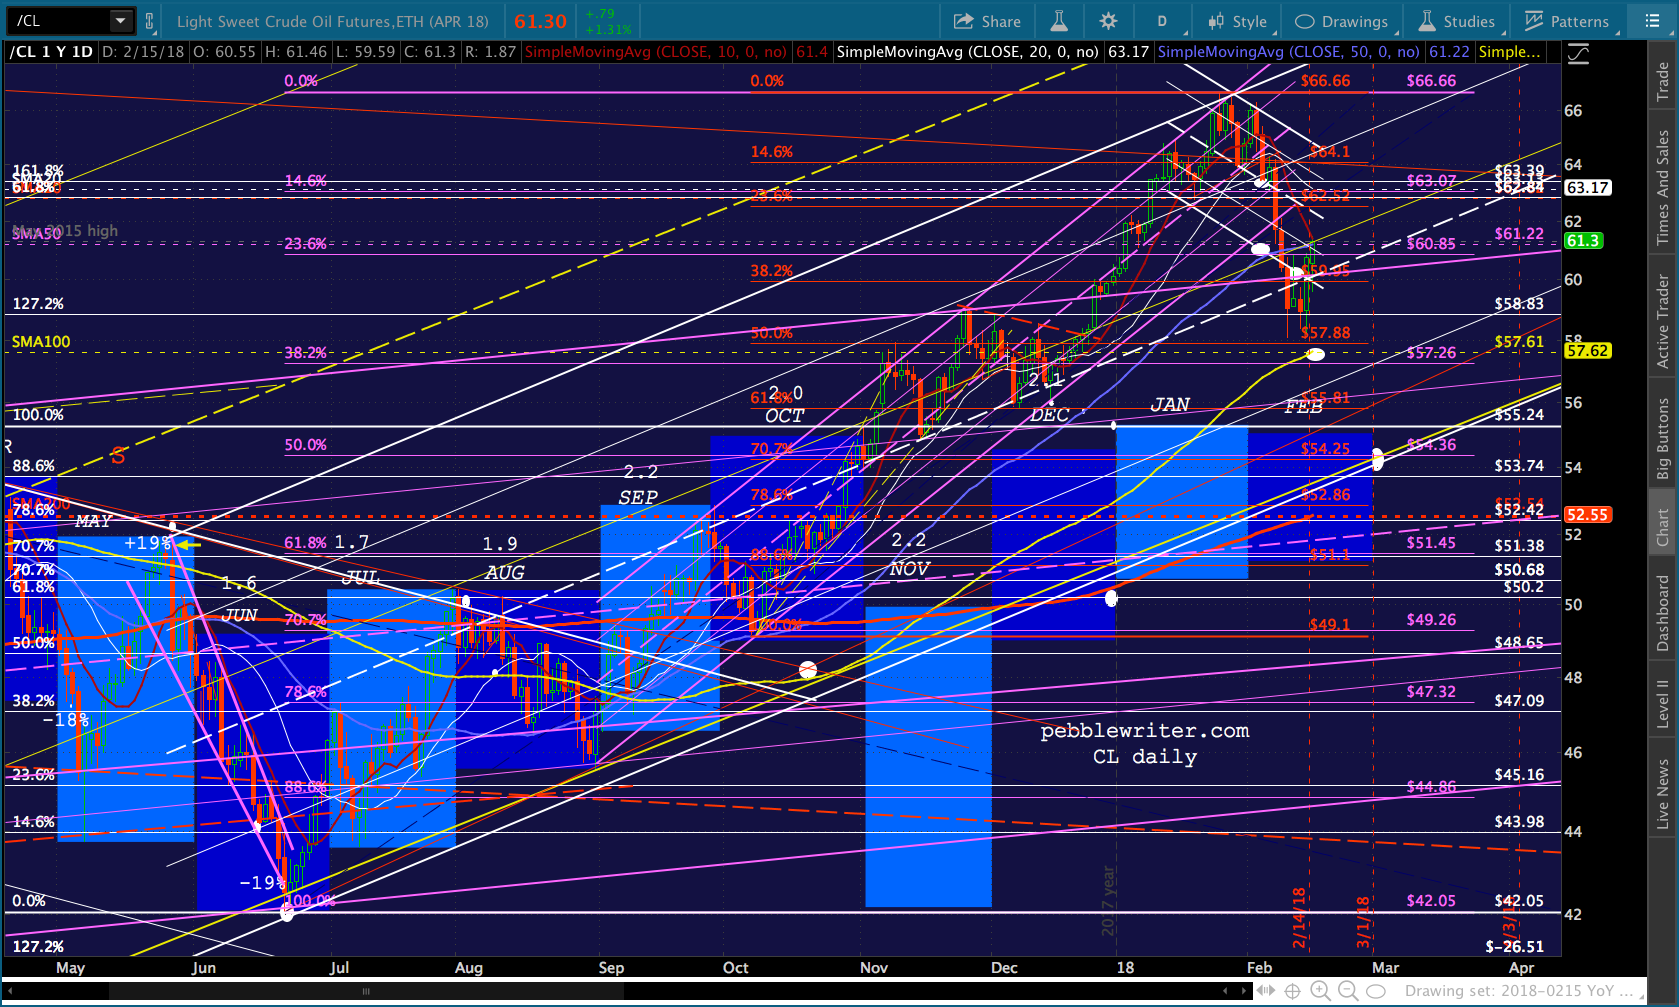
 I’m leaving CL and RB out of the equation for the time being, as I believe yesterday’s bounce was WAY overdone and has a good chance of unwinding (once VIX has bottomed.)
So, if all the above comes to pass, that would leave SPX with a clear path to 2745 — once it gets past the channel line at 2725ish. It’s the one that was tested in Oct 2015: the “Bullard QE4?” note. It’s a big deal, which makes me wonder if VIX has one more leg down left.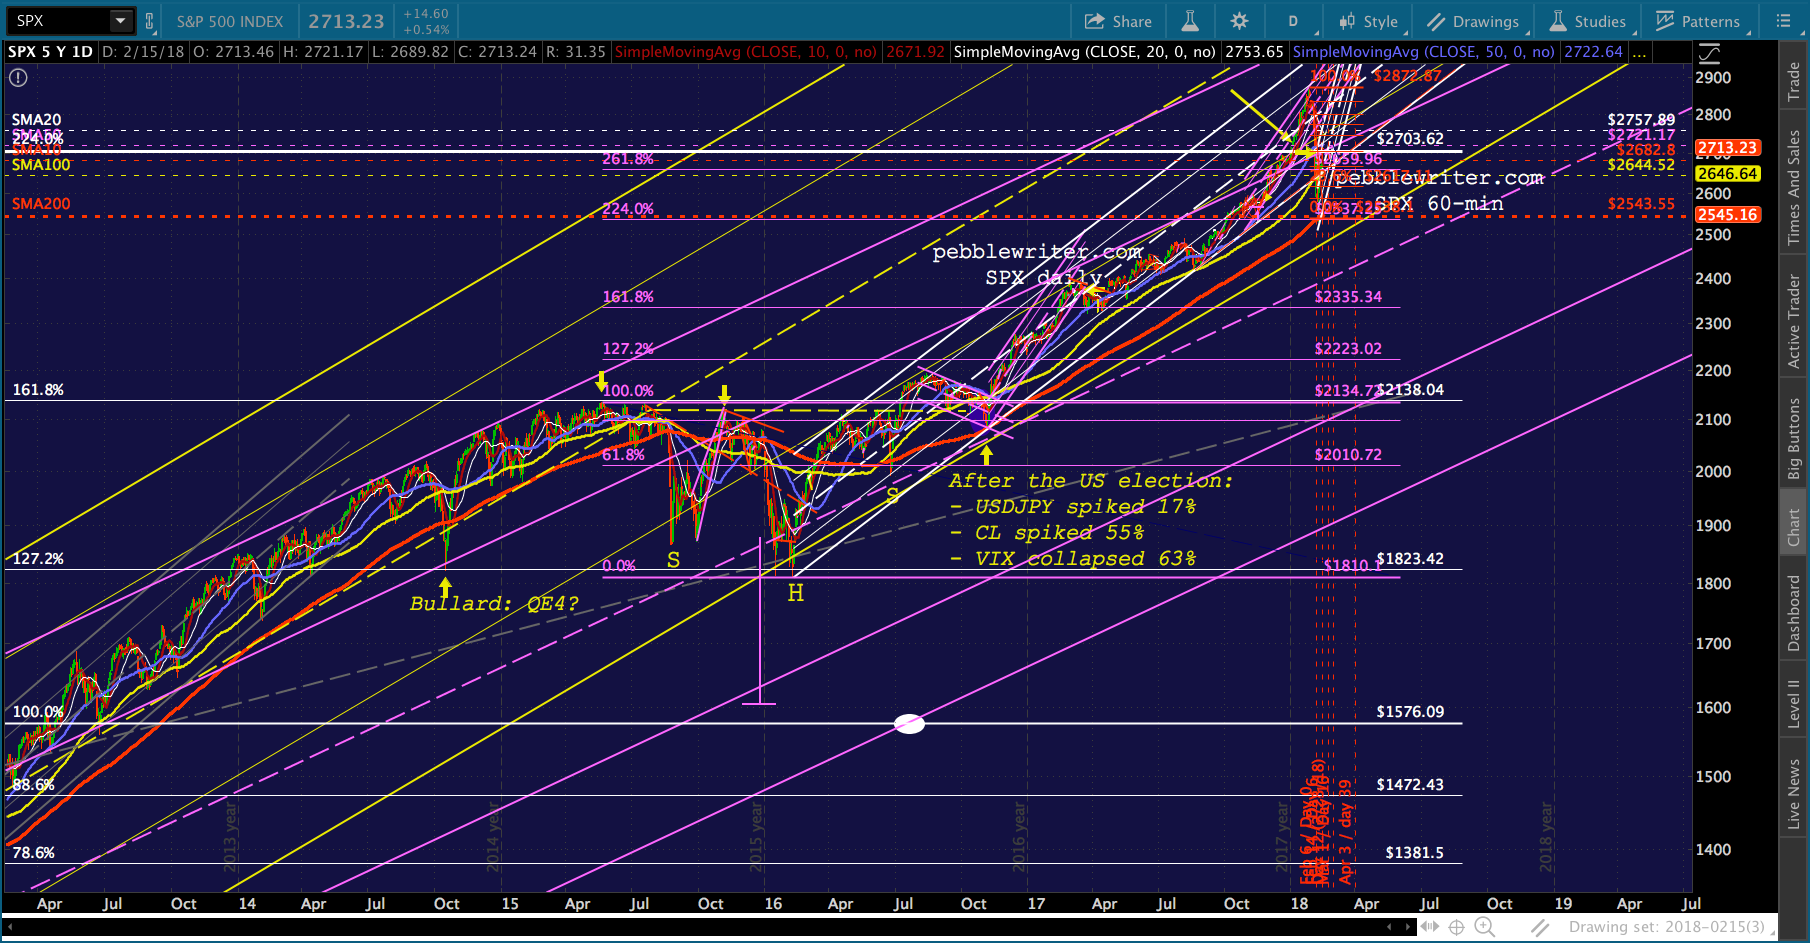 Regardless, it’s important to remember that now, as in 2007, there are other tools to get stocks higher. A strong bounce by USDJPY — which would potentially be just a backtest — could keep it going while VIX has a very gentle rise between now and Mar 1. A reminder…
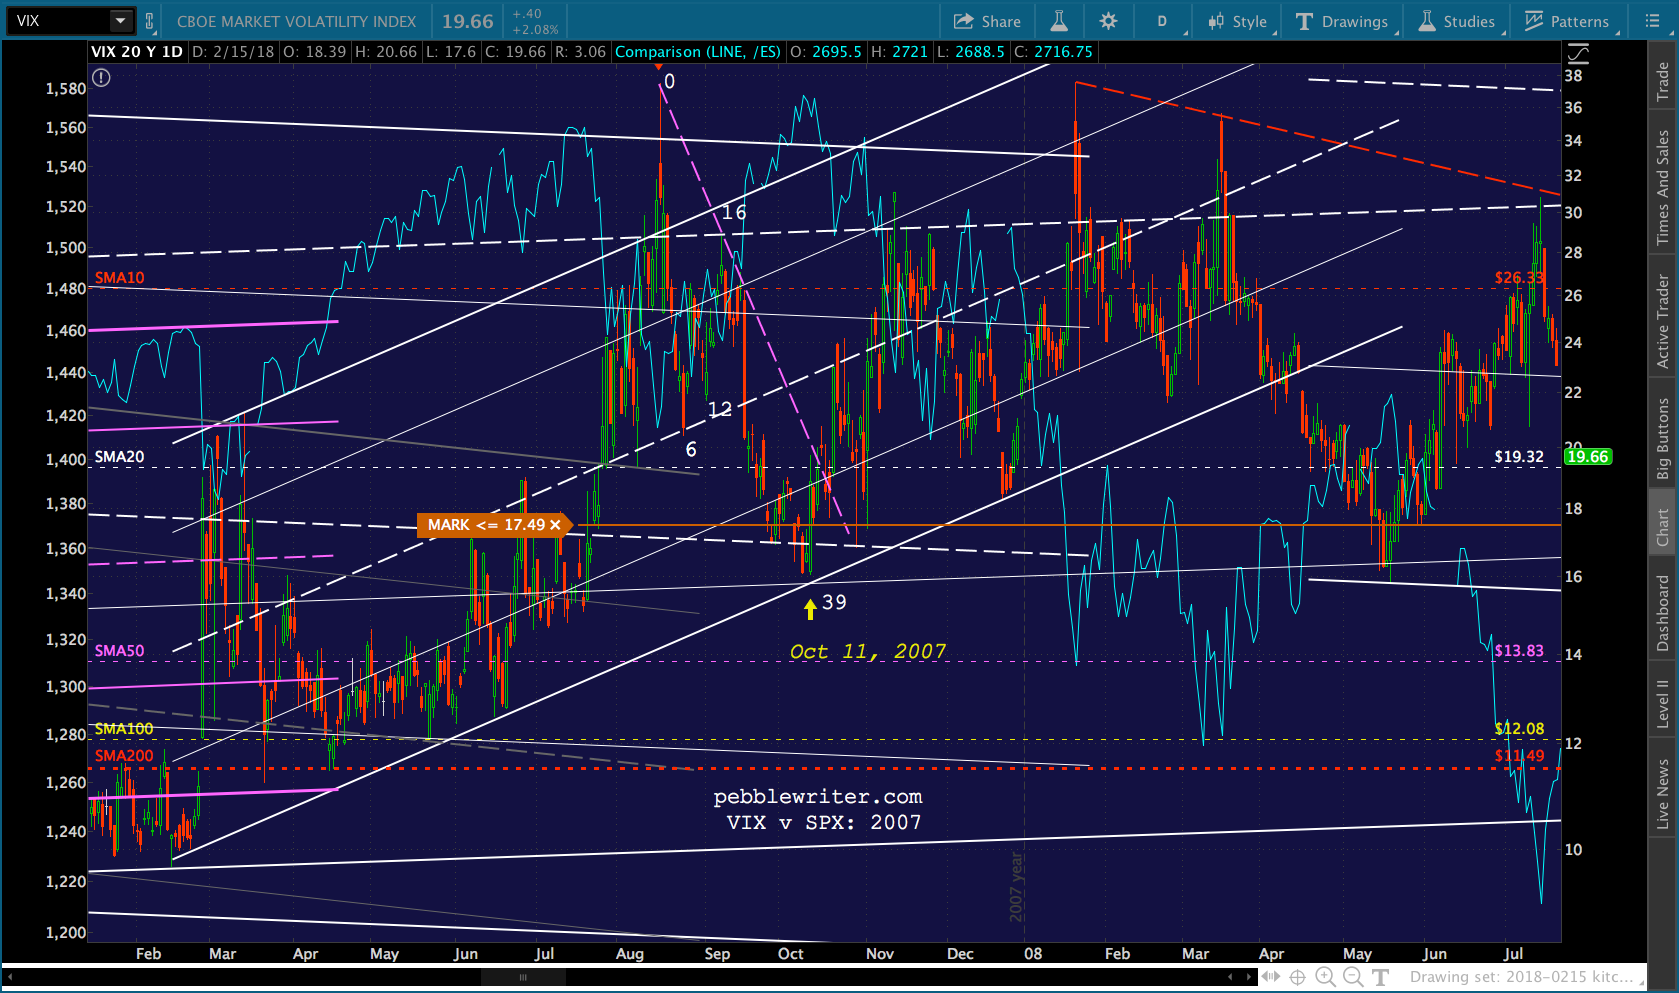 In 2007, the rise between Day 6 and Day 16 was from 20.44 to 28.82 — and stocks still rose. The volatility was tremendous, with 45-50 point swings (about 3%) off the closes.
 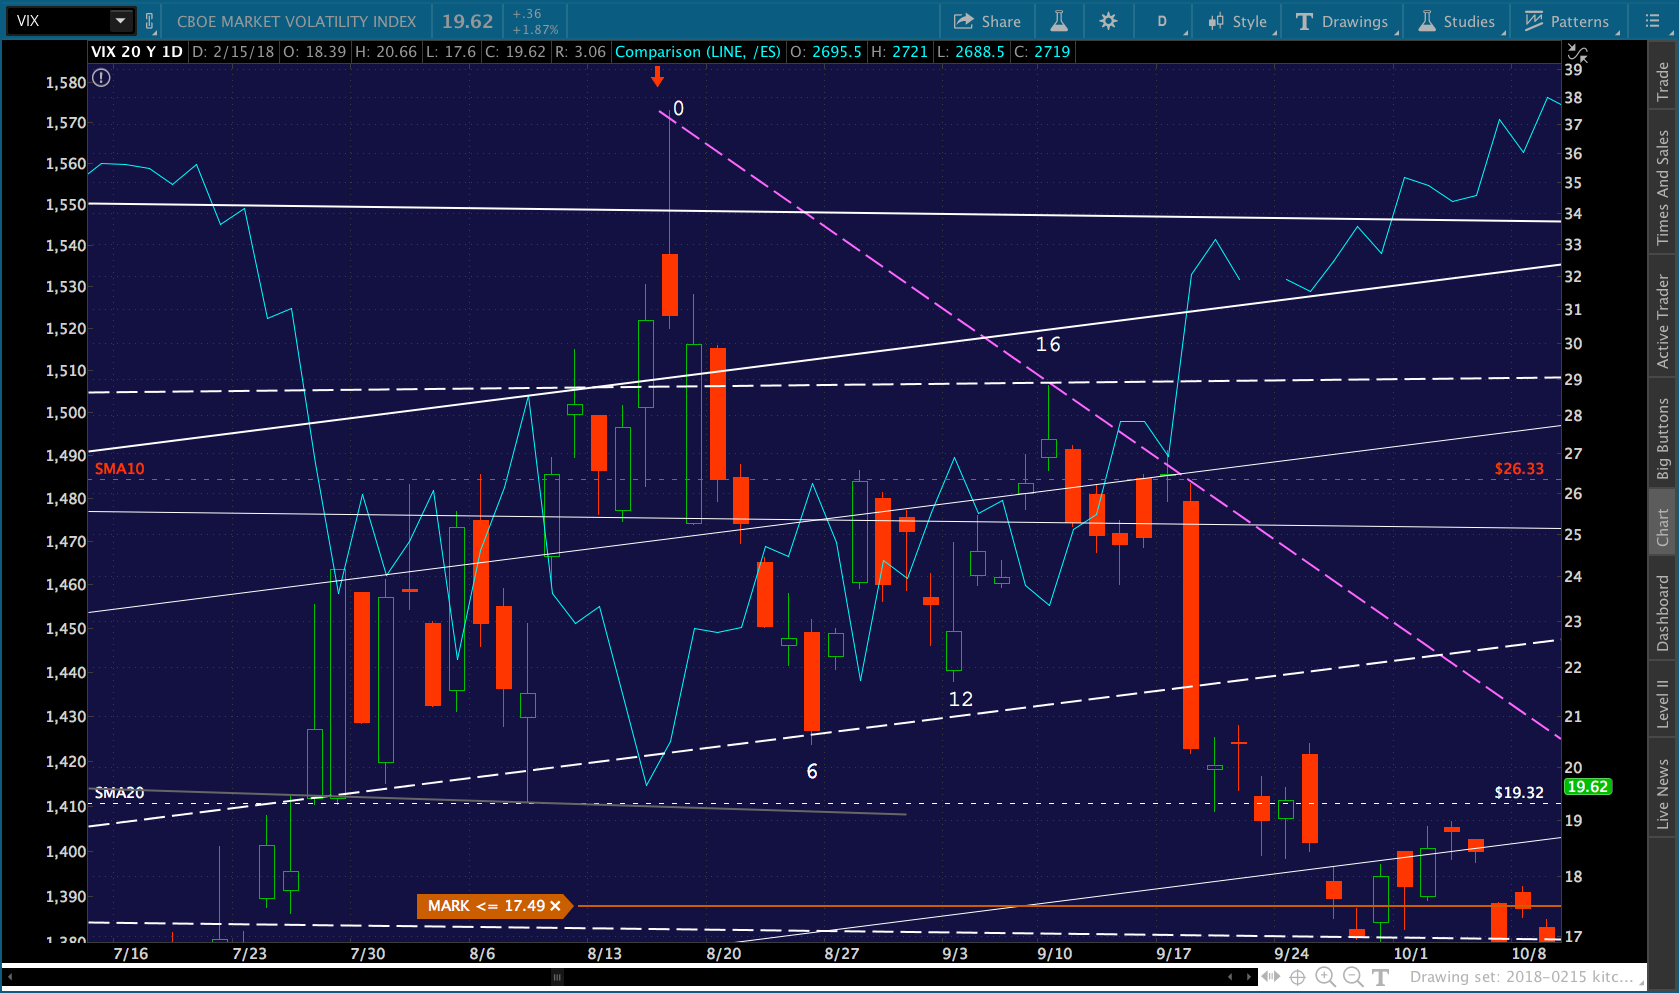 SPX didn’t actually make new highs until day 35, just a few days before the final peak on day 39. But, remember, the Oct 11, 2007 peak was only 20 points higher than the Jul 16 highs. Today, the tools are more effective — which is why we have higher targets in mind.
I imagine we’ll know more as we get closer, particularly as the channel shapes up. The biggest question, then, will be how to keep things going. Every analog breaks down eventually. Can this one continue the meltup, or will the outcome be the same as in 2007.
Lots to think about.
UPDATE: 3:45 PM
ES has just reached its 2.24 as SPX reached that purple channel line we discussed earlier. If TPTB were smart about it, they’d let that pullback occur right here. With a drop to even 2665 they could put together a decent looking IH&S that targeted 2917ish. But, I’ve seen them ignore that opportunity more often than not, I suppose in the interest of expediency.


 I think there’s a very good chance of a pullback here, as DXY and EURUSD are heading for our targets and USDJPY has dropped through support (on this news.) Of course, under the “bird in the hand” approach, getting past ES’ 2.24 today might take precedence.
And, playing the short side might not produce a huge gain. SPX has plenty of support that it just leapt over, starting with its own 2.24 at 2703 – 24 points away.
 A reminder to gold traders…it is still stuck at its most recent .886. Unless DXY continues falling, GC might have run out of steam here. Cautious types should consider taking profits, while the daredevils out there remain focused on 1380.
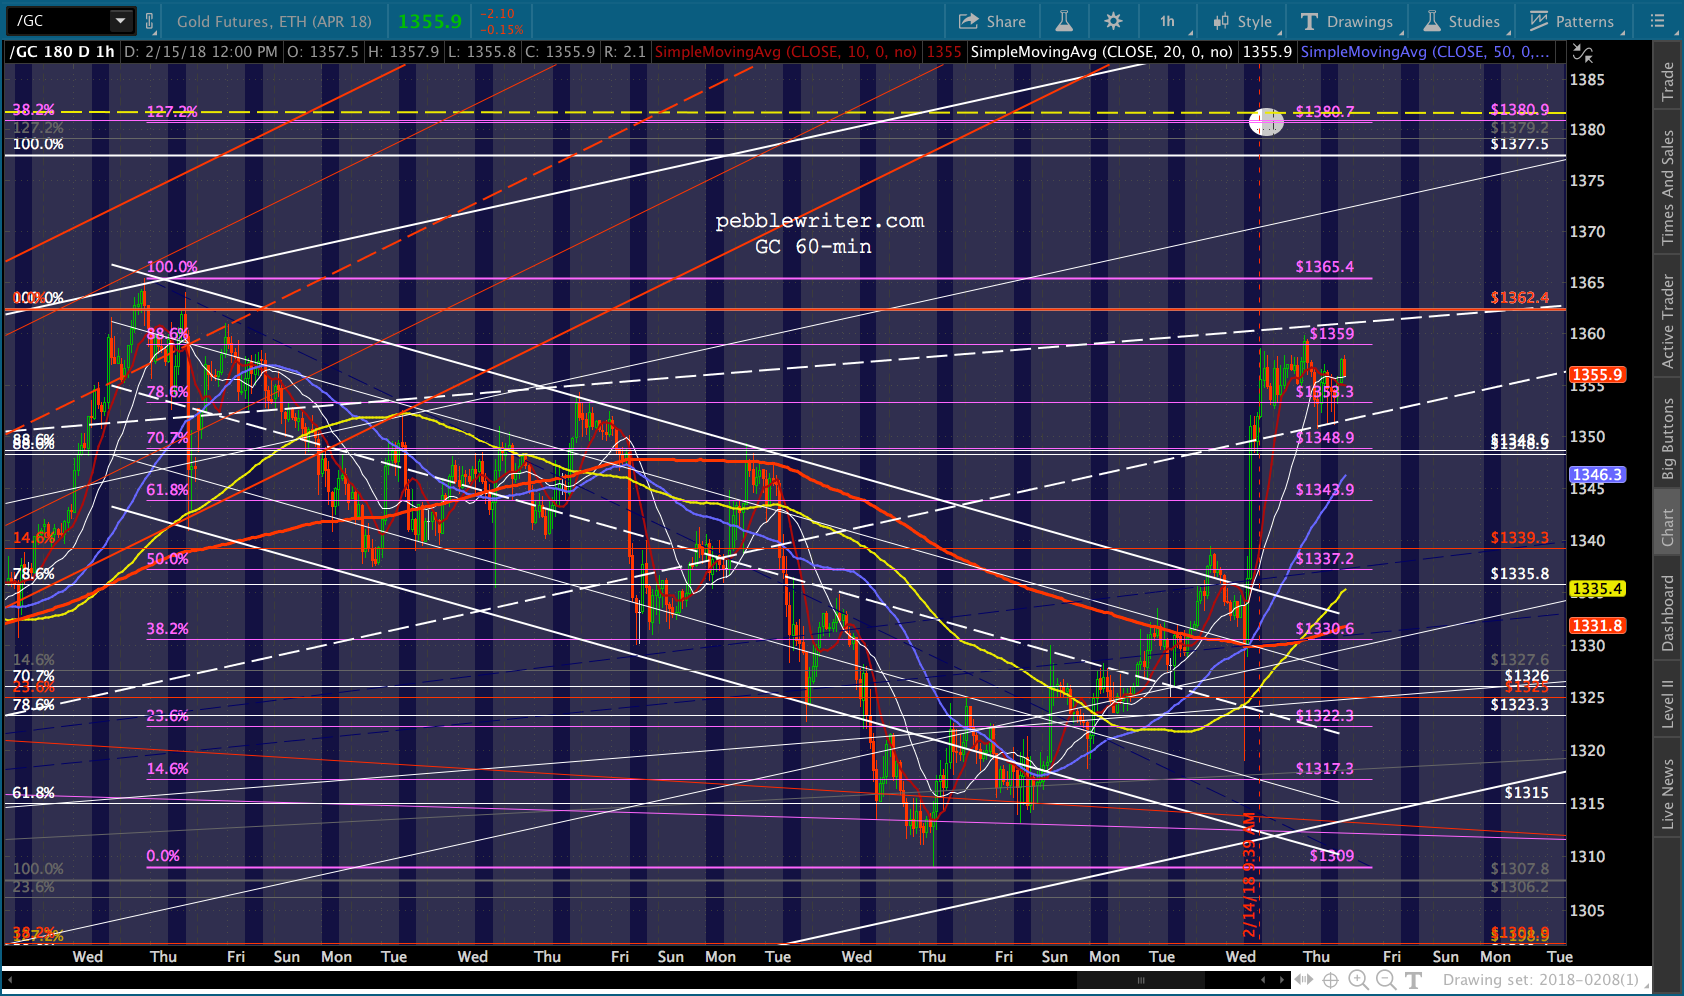 One other note…RB has backtested the recently broken red TL from June 2017. This is an important potential inflection point. A break above would be very bullish, while a reversal here would be quite bearish.
 CL’s trajectory is trickier (as usual.) It just backtested its SMA10 and a channel line, but is back above the purple channel top. Hard to call, but it still has potential down to the SMA100 around 57.62 and the yellow/white channel bottom around 54.36 if it loses momentum here.