

Our analog is playing out nicely so far. I’ve spent 18 of the past 24 hours charting, and have some additional info on what to expect from SPX, ES, DXY, USDJPY, EURUSD, TNX, ZN, RB, CL and, of course, VIX over the next two months.
continued for members…This is likely to take a few hours, as there’s a lot to post. I’ll probably need to follow up with a condensed version after this is done, as these things tend to get a little unwieldy.
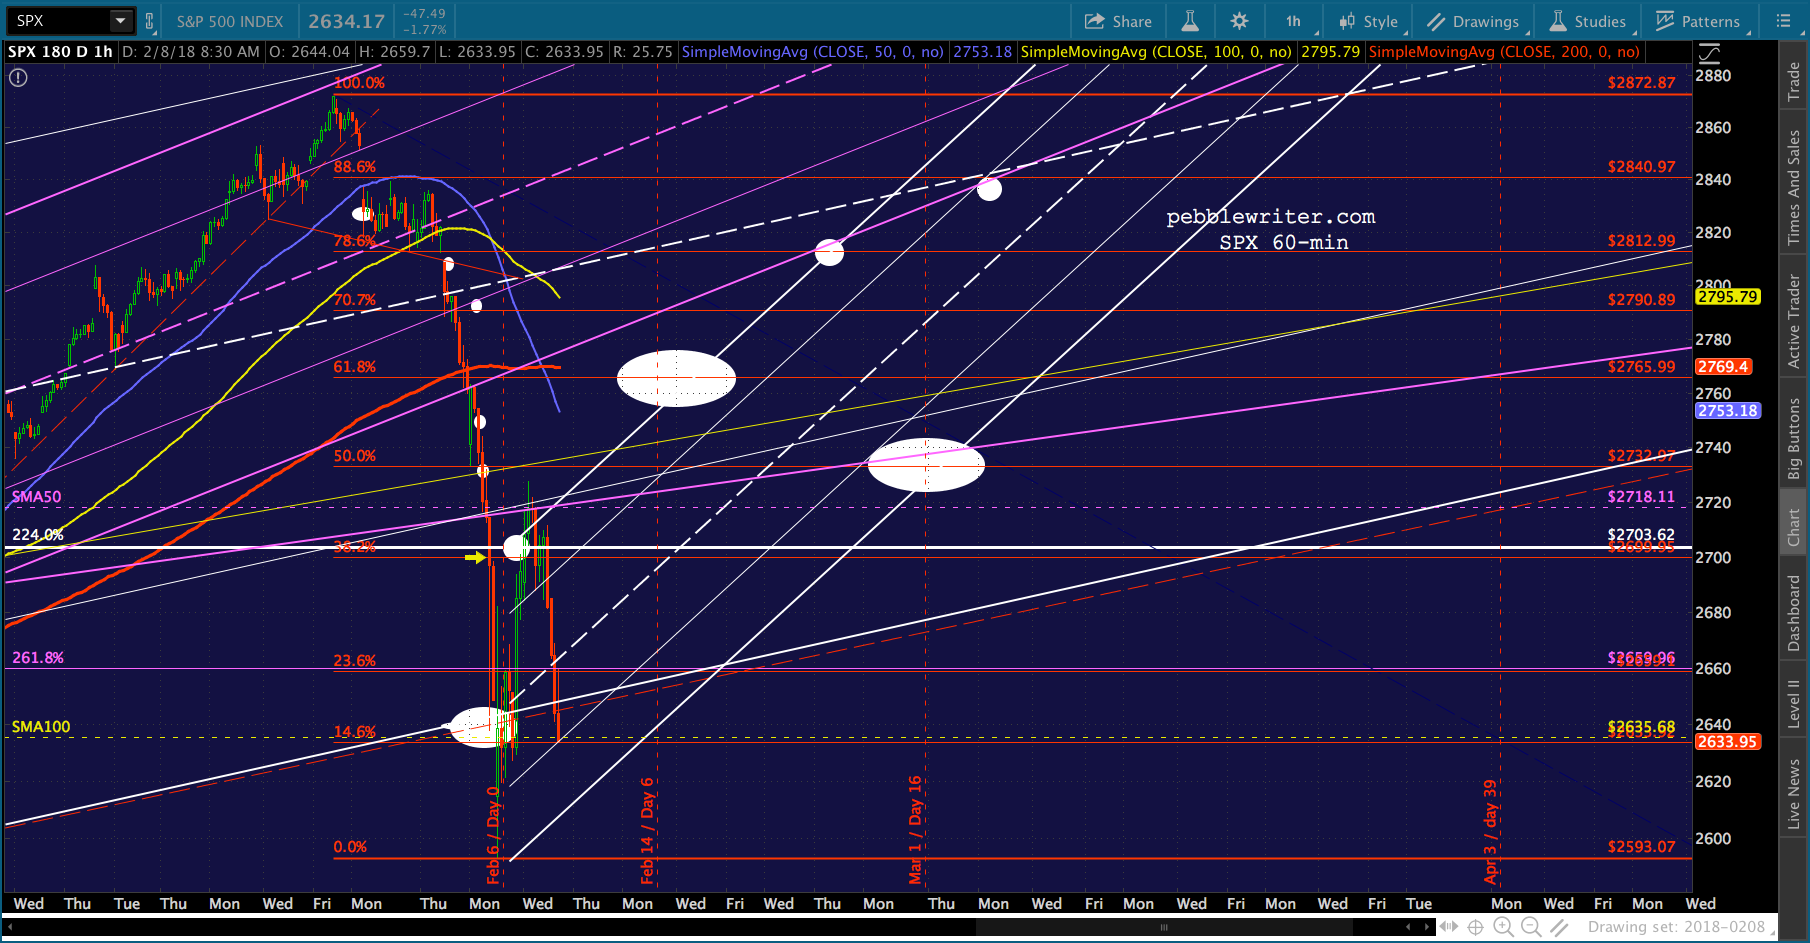
First, a snapshot of where we are so far. This is last night’s chart, showing a path (the small, white channel) to 3047. We have hit the white channel top and pulled back a little, as would be expected.
The key is to push above 2703.62 and close there. It needn’t happen today, but sometime in the next few days. The initial objective is the red .618 at 2765.99 next Wednesday, Feb 14. It should zig zag a little higher, possibly the .707 or .786 before reversing to backtest something.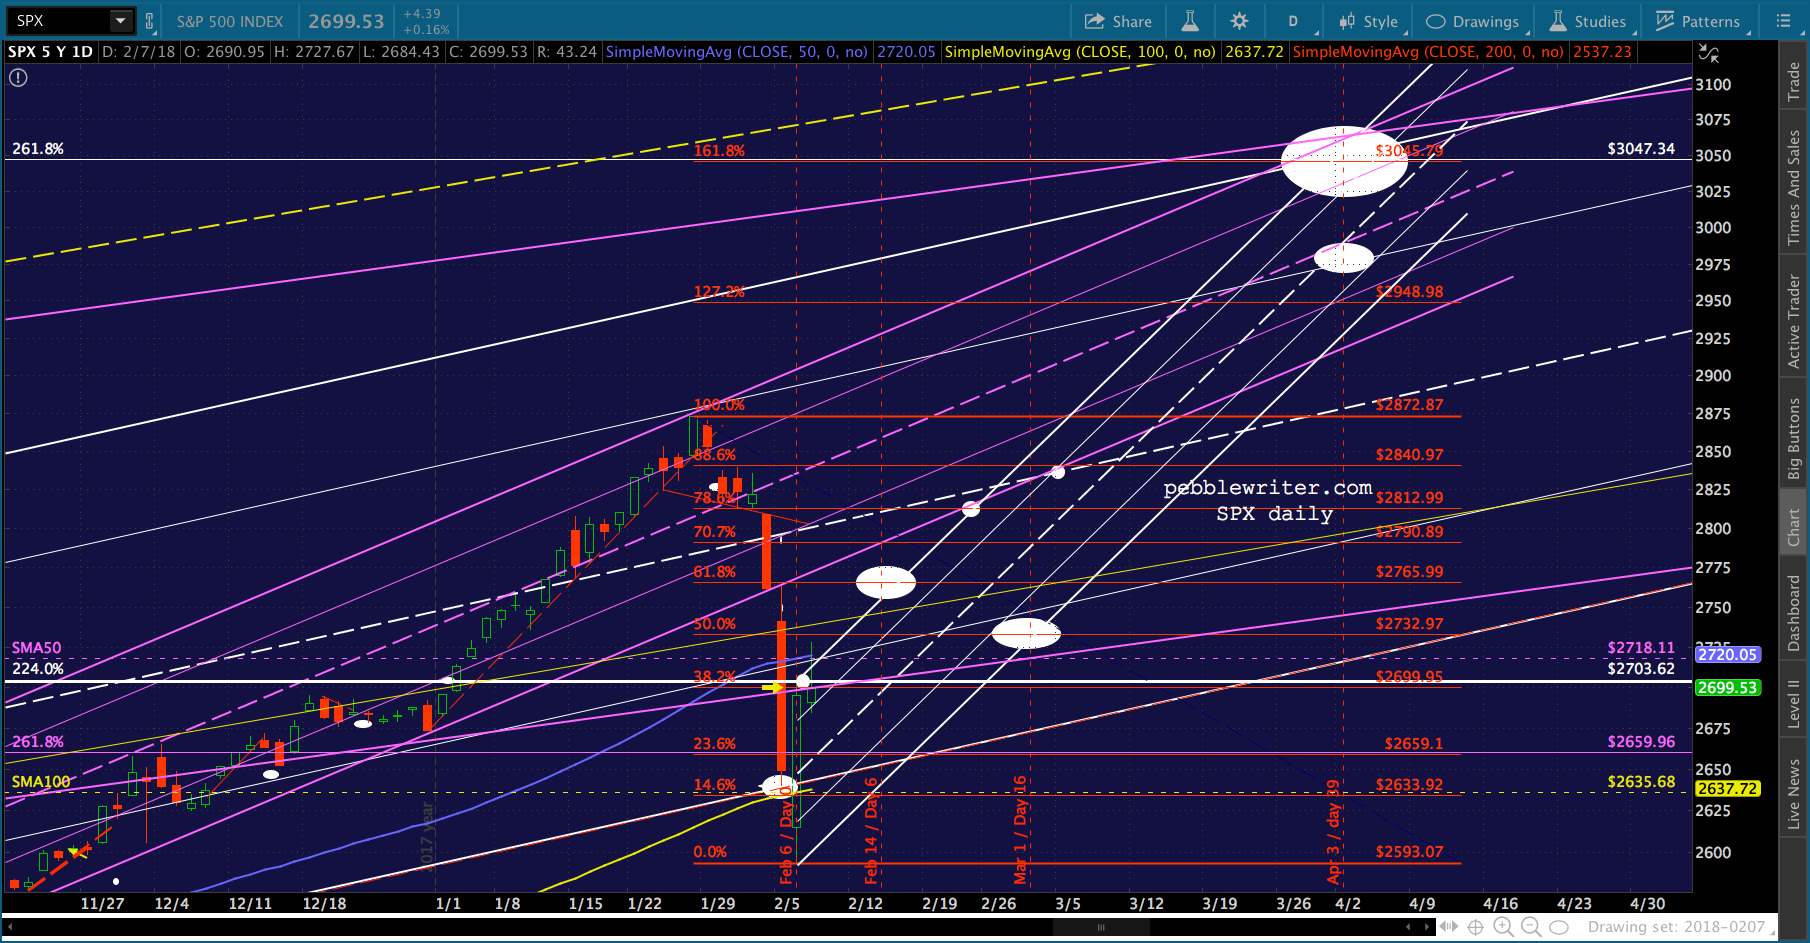 My favorites at this time are the 2.24 at 2703 or the SMA50 which will probably be around 2718. With any luck, that’ll happen on Mar 1. From then on, it should climb pretty steadily until reaching 2948-3045 around Apr 3.
Obviously, we might have some adjustments to the white channel, which would change the reversal points accordingly. It mostly depends on where the actual target is. And, naturally, there are any number of events – black swan and otherwise – that could bust the analog all together.
Now, let’s look at some other charts. For each, we’ll look at what happened in 2007 and what that portends for the months ahead.
TNX and DXY
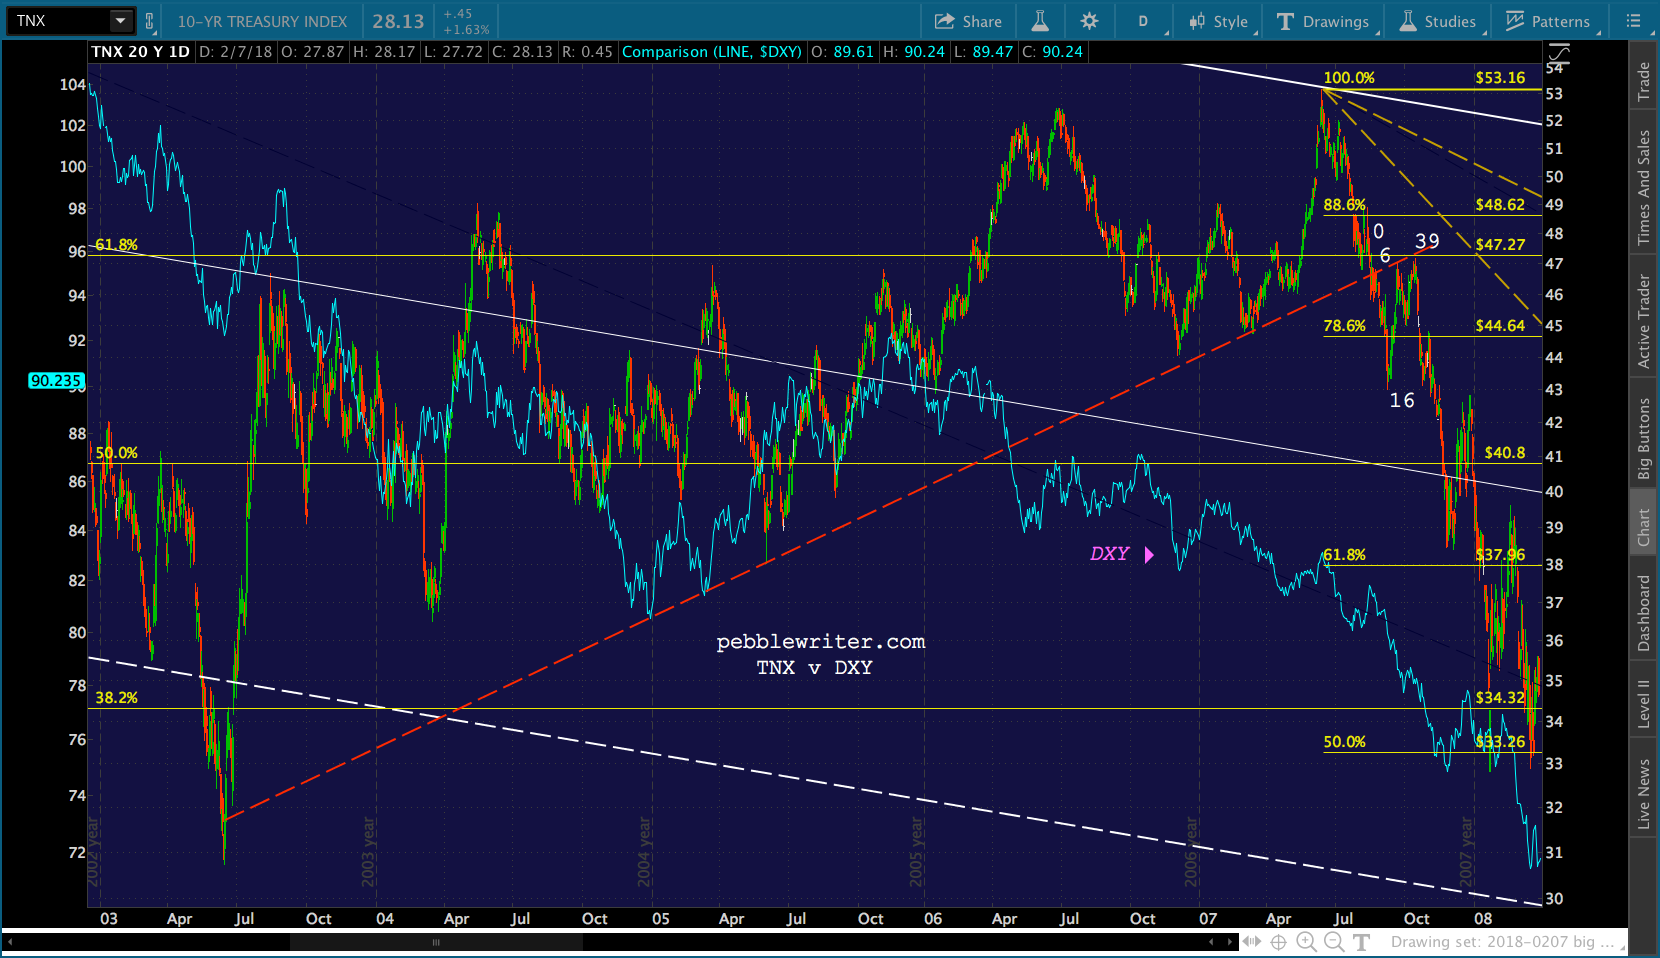
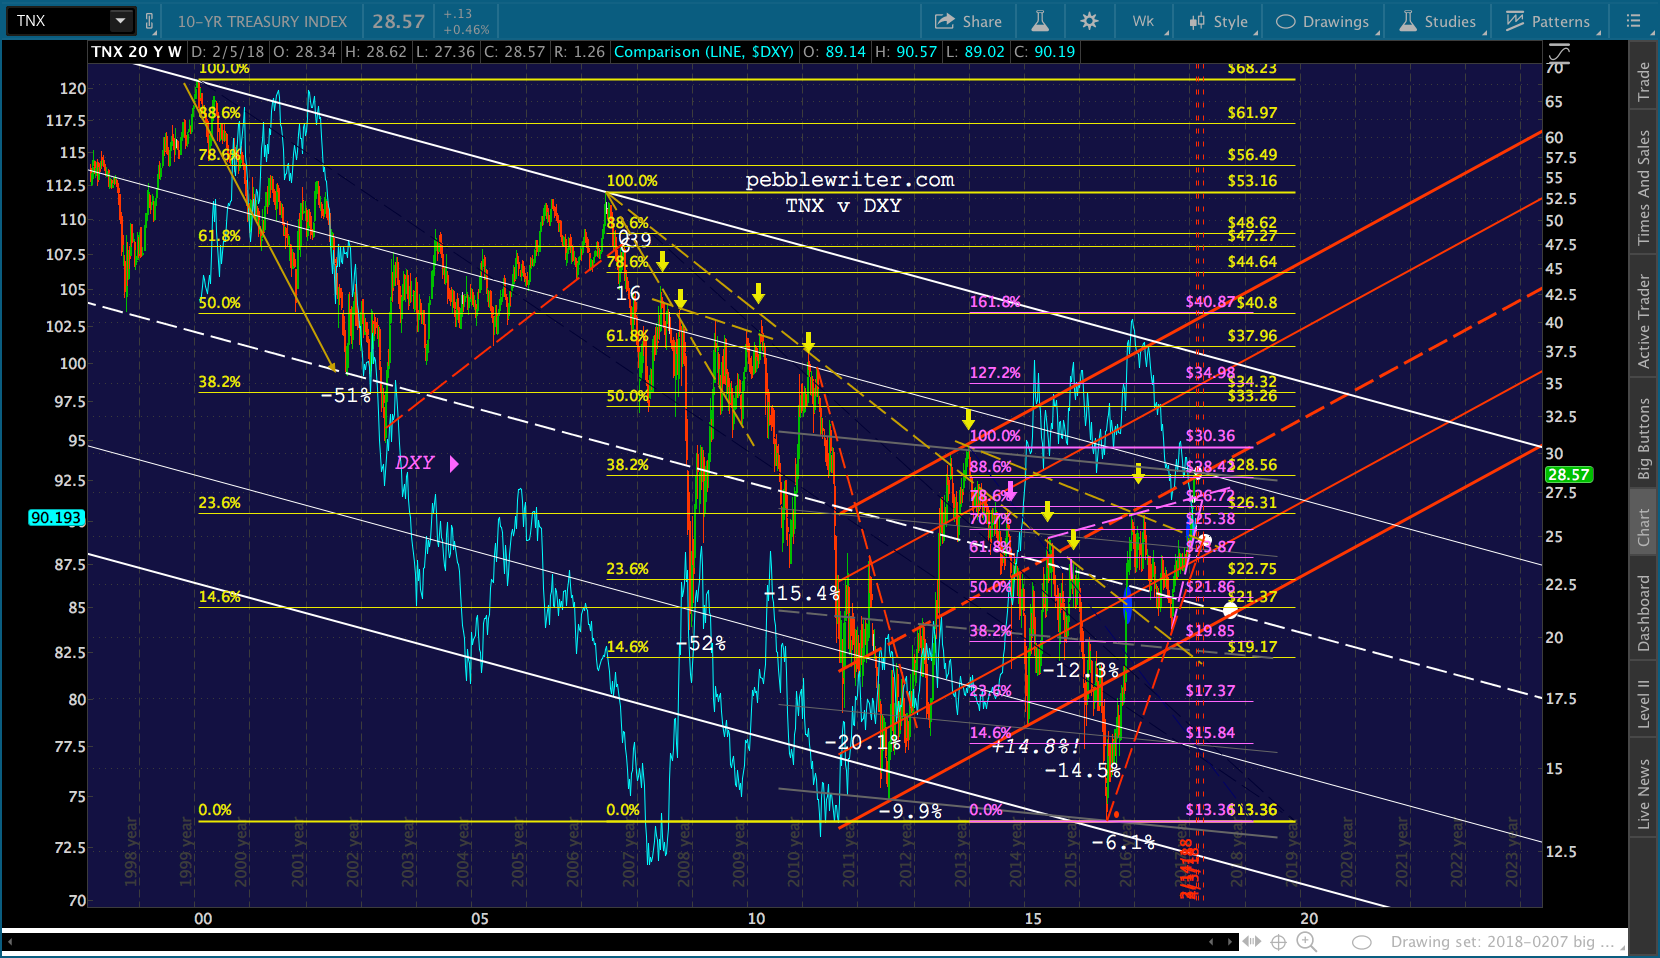
In 2007, TNX had just established the top of the falling white channel that’s still with us today. Jun 2007’s 5.32% was a big increase from 2003’s 3.07. It was also slightly higher than Jun 2006’s 5.25% — a higher high, but not by much.
TNX had risen on a TL, shown in red, from those 2003 lows. Aug 16, 2007 – the day that VIX spiked so high, was the first day that TNX’s TL broke down. 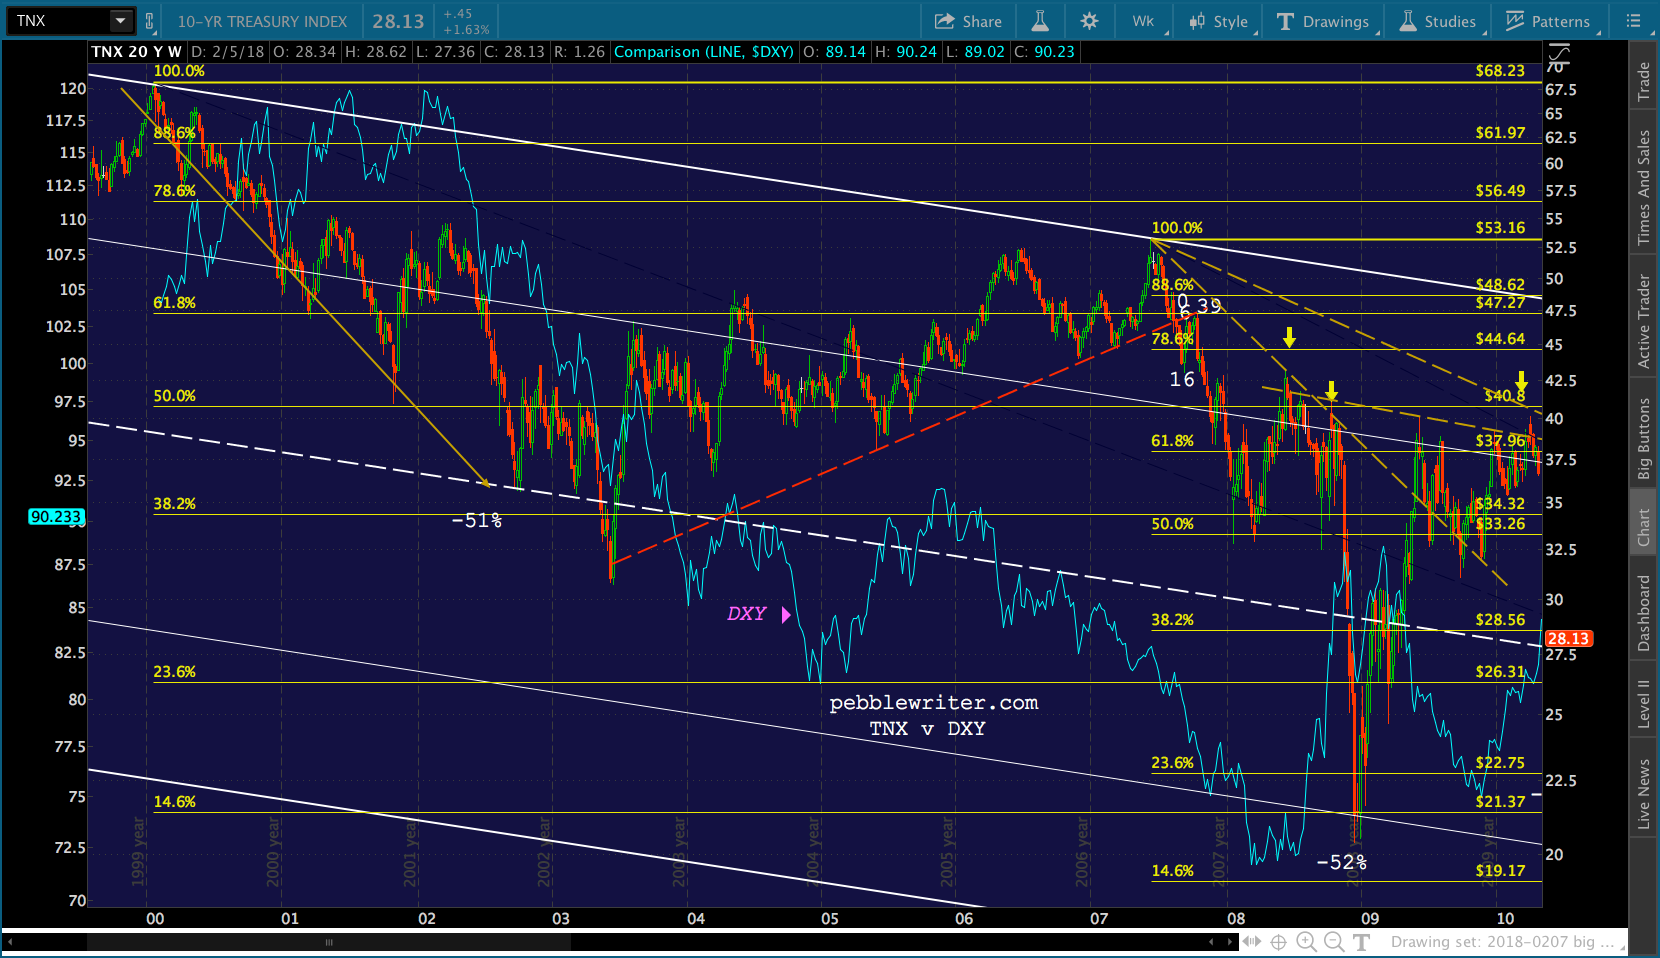 Day 6, the day that VIX first bottomed, coincided with a backtest of the broken TL. Day 16 was the day that TNX began a nice bounce up to Day 39, when it backtested the TL for the final time. To sum up, that VIX spike helped precipitate a plunge in rates.
 Here in 2018, TNX just recently topped its 2016 and 2017 highs, reaching 2.85 (as forecast) versus 2.62/2.61. It would take quite a drop for TNX to make it to the red TL from the 2016 lows by Feb 14.
But, note that it would allow TNX to backtest the red channel .236 line — a normal occurrence after the midline reversal it just made. It would also intersect with the purple .618 at around 23.87 — again, a normal occurrence following a .886 reversal. So. we’ll put a pin in it, with the two likely targets being 25.38 (the purple TL) and 23.87 (the red.)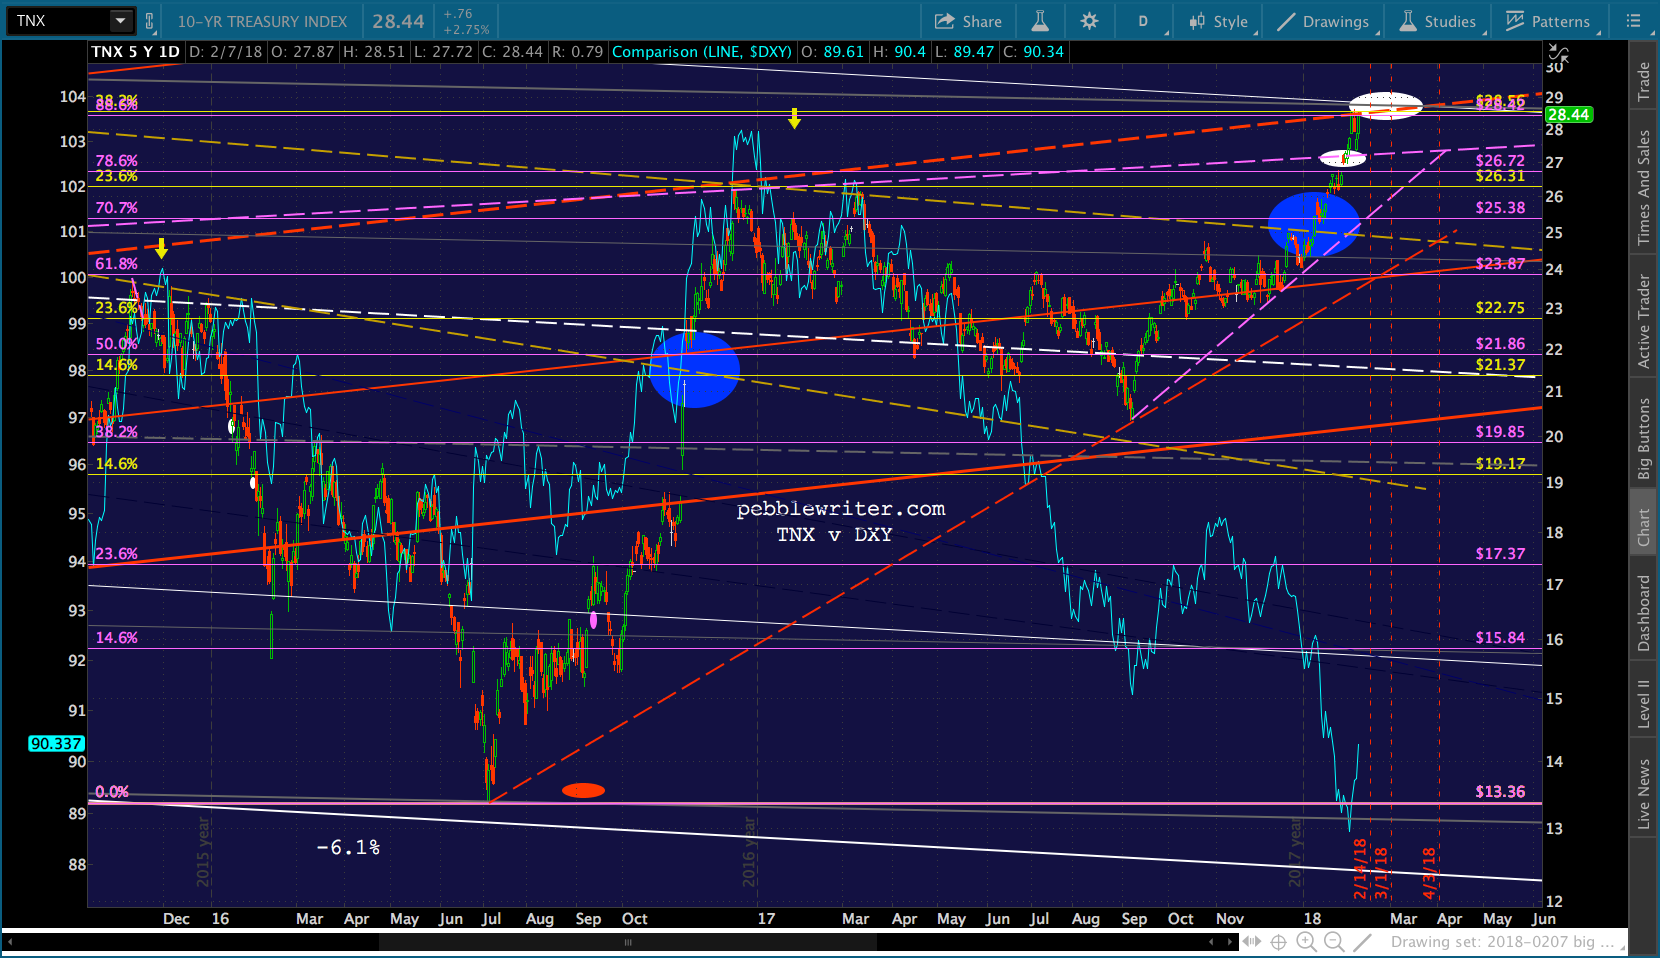 As the 2007 TNX chart shows, DXY continued to drop throughout TNX’s decline. It bounced into Day 0, then made a series of steady declines as TNX fell, and even when it bounced. In other words, interest rate drops made very little difference to the value of DXY. It had dropped and would continue to drop — about 3.8% between Days 0 and 39.
Again, it’s not out of line with what I anticipate for DXY – a drop to the purple channel line at 87.5 (around 3.0%) or the .500 Fib at 87.26 (3.1%.)
From DXY’s perspective, Day 16 represented a breakdown of recent horizontal support, and Day 39 was a slight bump in the otherwise steep drop. DXY dropped for a full seven months following Day 0 — from 82.132 to 70.698.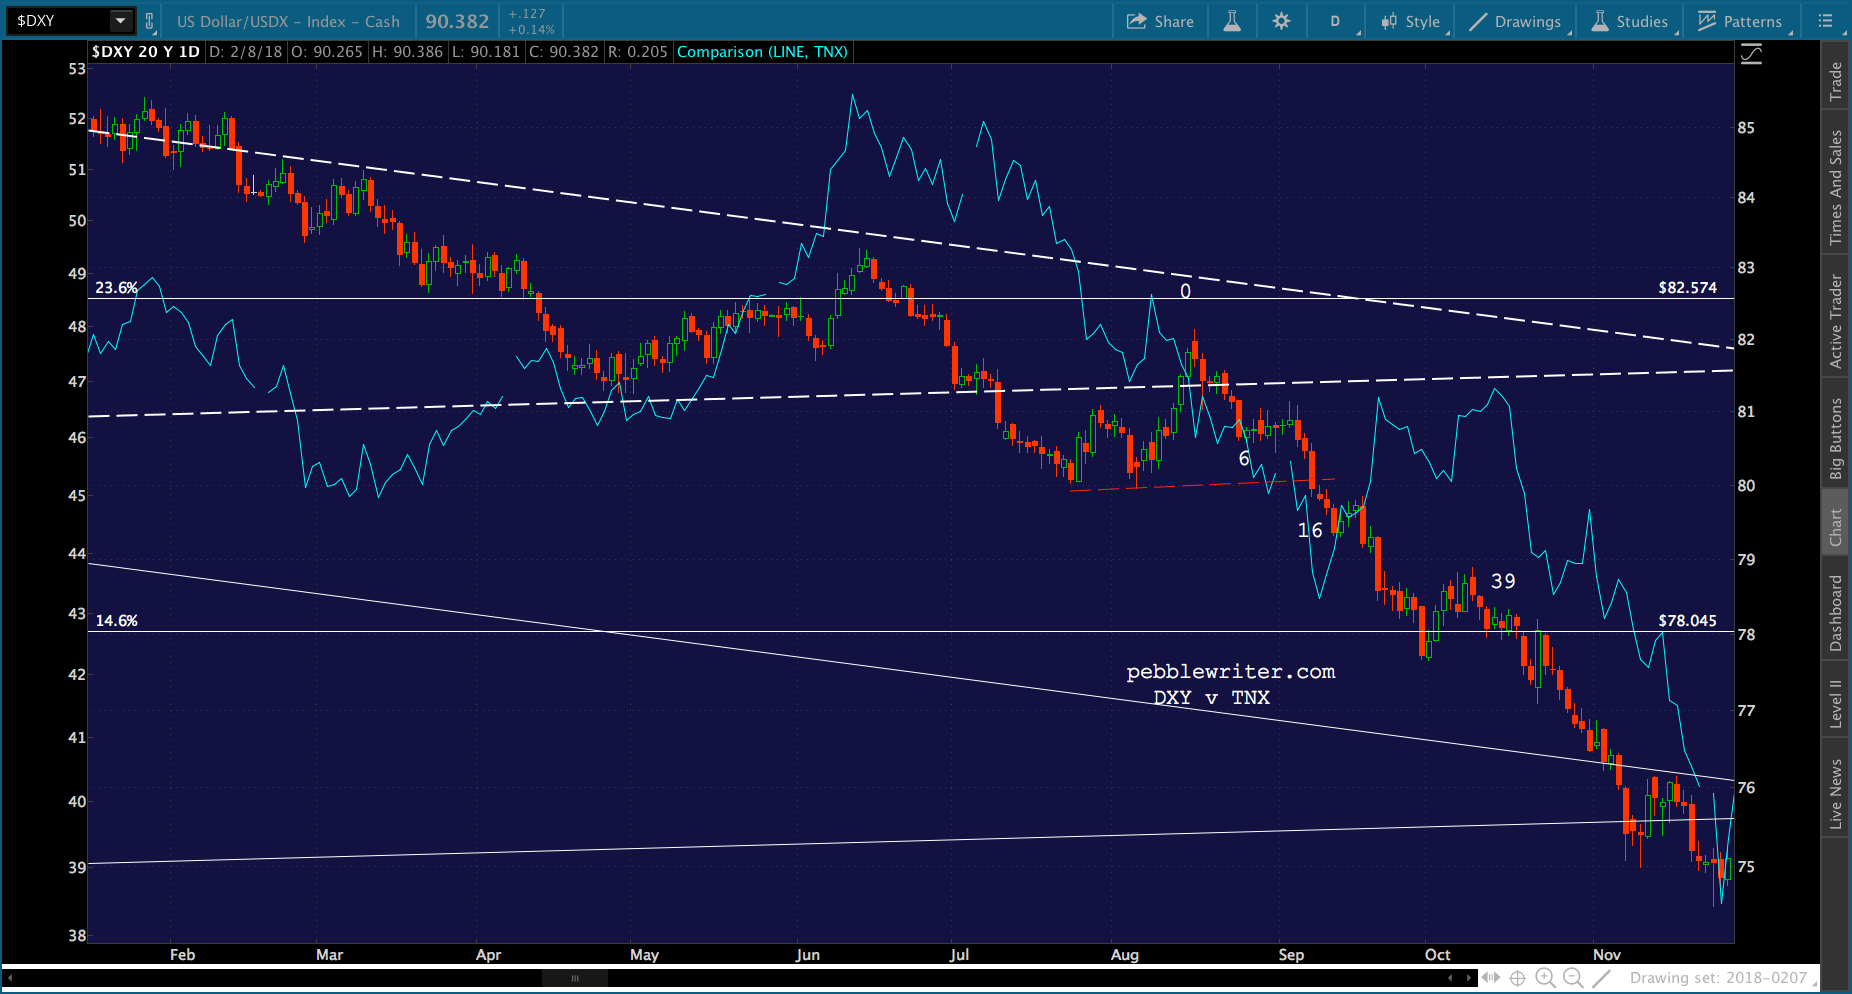 The breakdown was more dramatic when viewed on the weekly chart. The falling white channel didn’t really exist yet, but the yellow channel – a flag pattern – was clearly in place and broke down following the VIX spike.
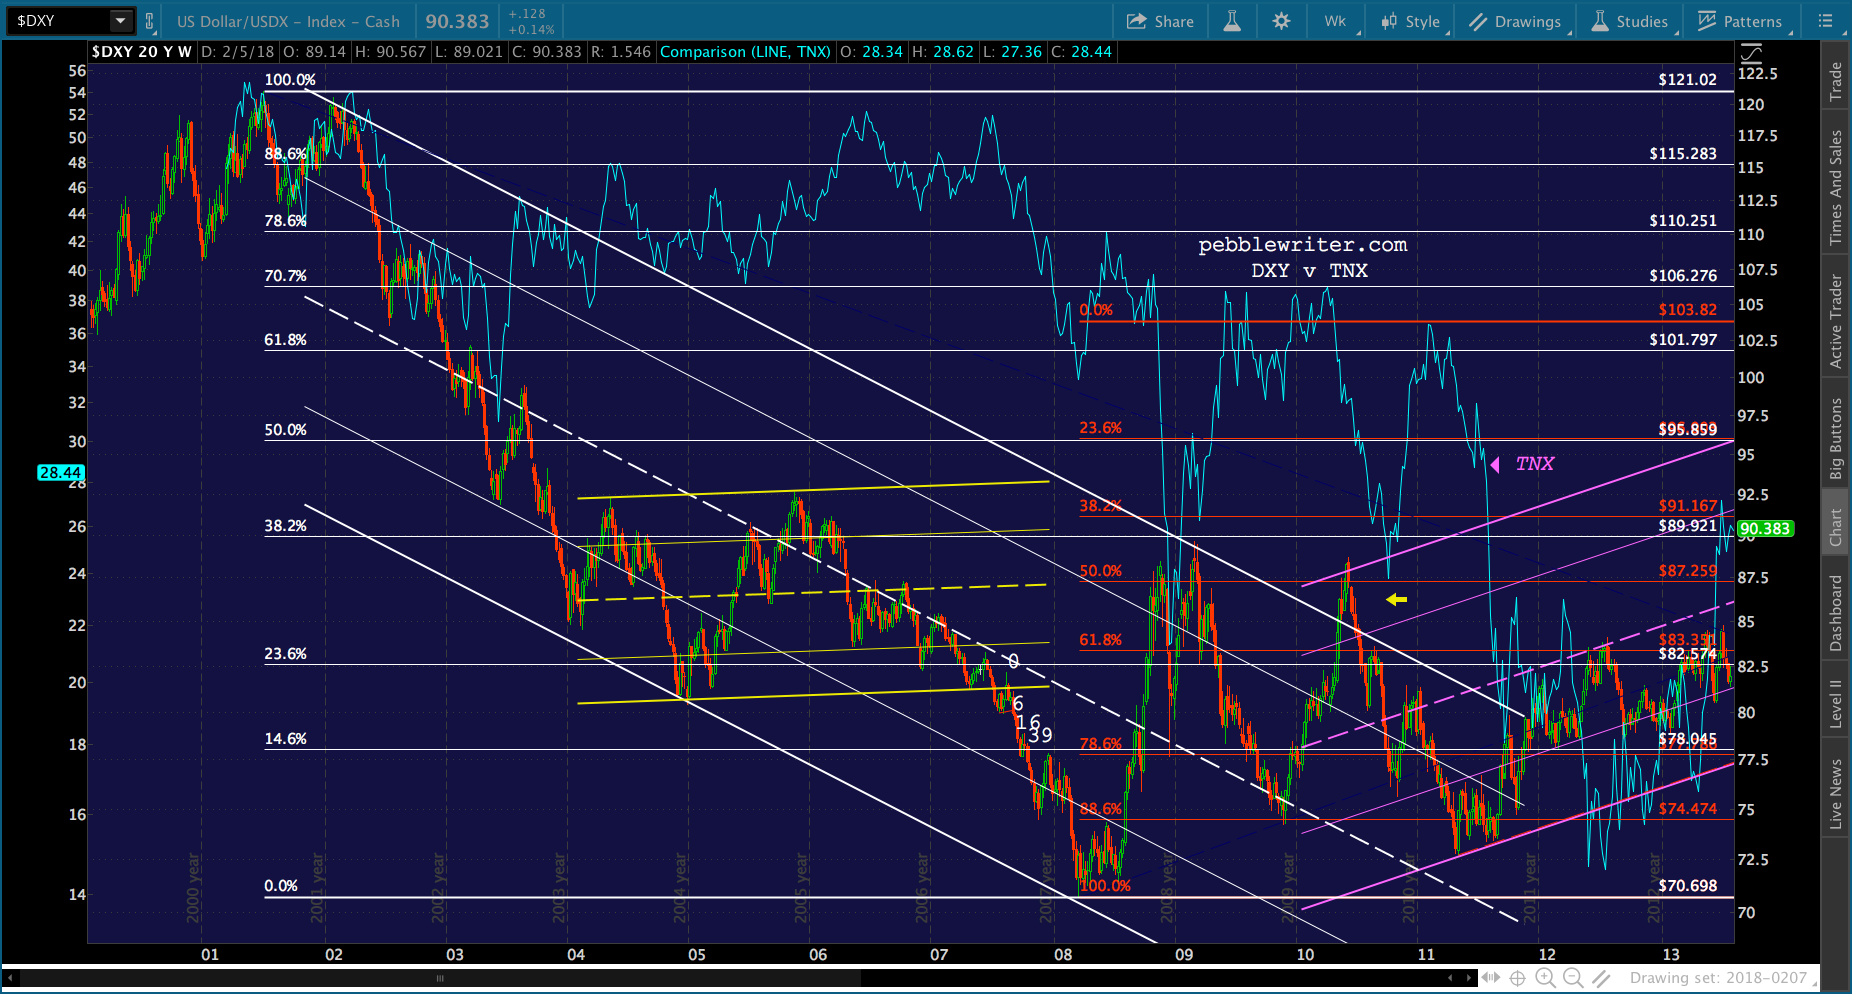 Summary of results from 2007:
A breakdown of TNX (a deep retracement) and DXY (new lows.) Days 0, 6 and 16 were lower for both while Day 39 represented a bounce (backtest for TNX) on the way lower.
What to expect in 2018:
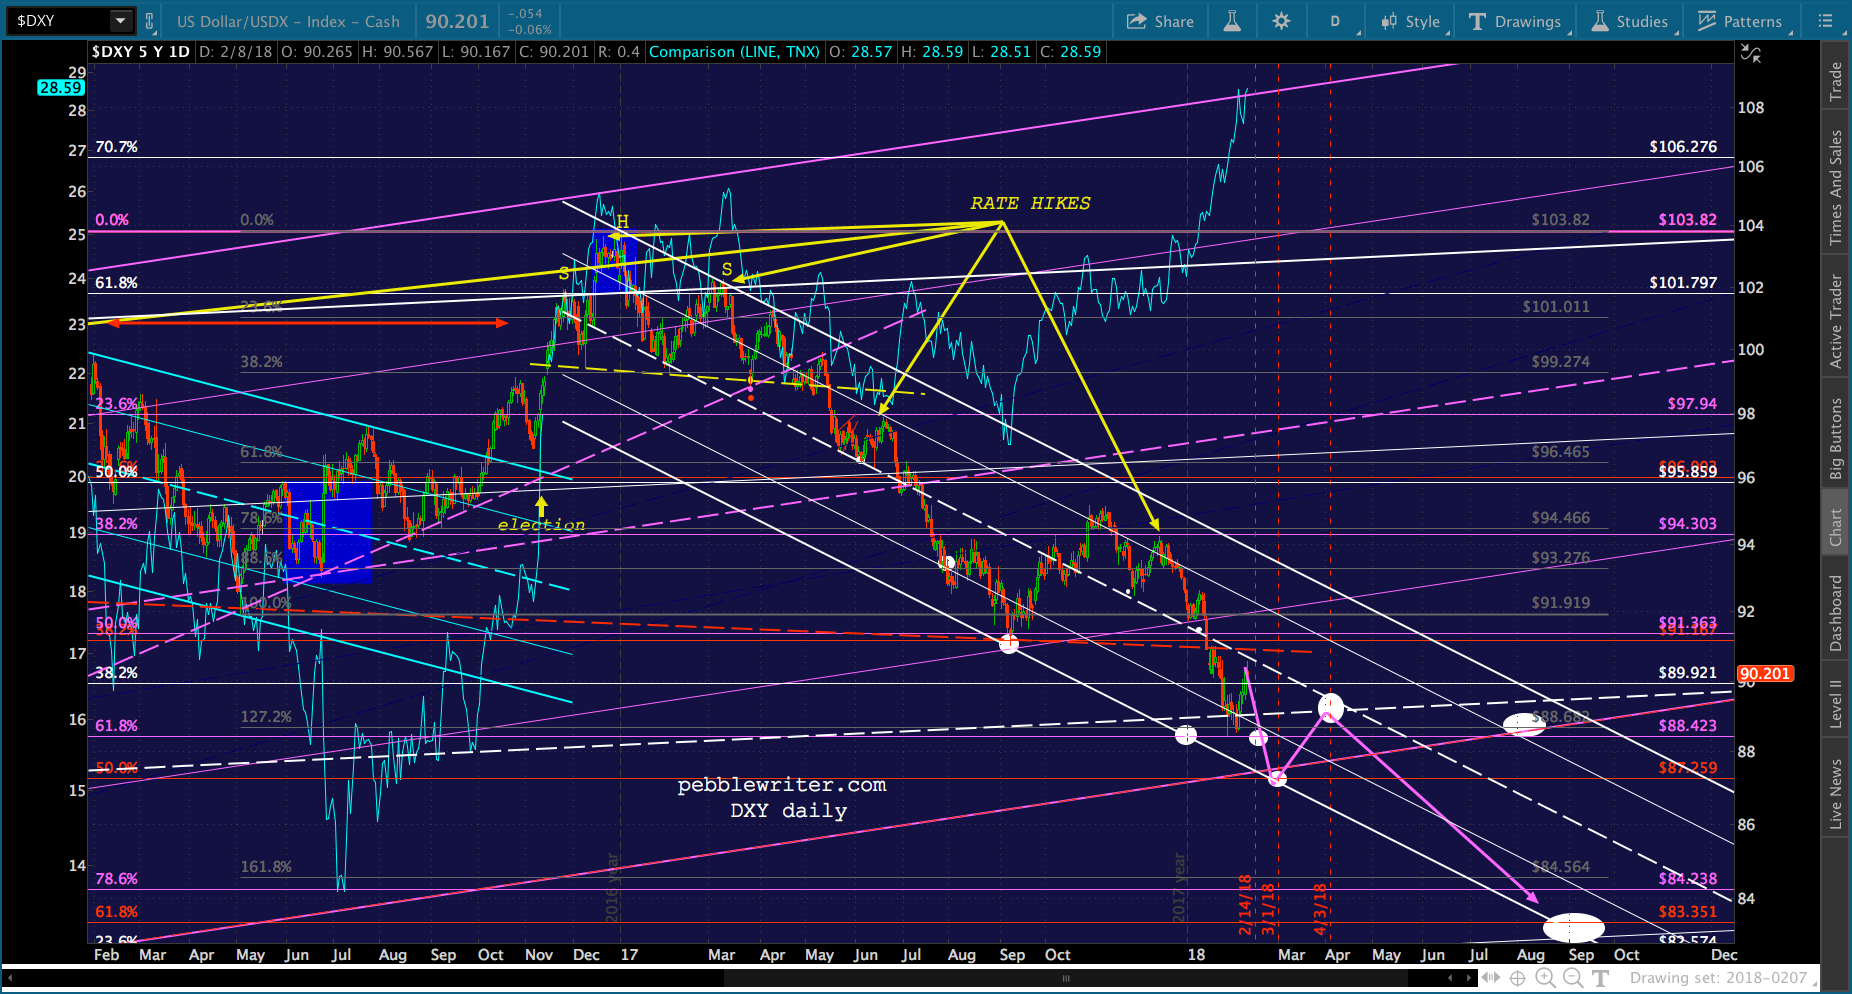
DXY is sitting at the same rising white channel midline that initially caught in in 2007. 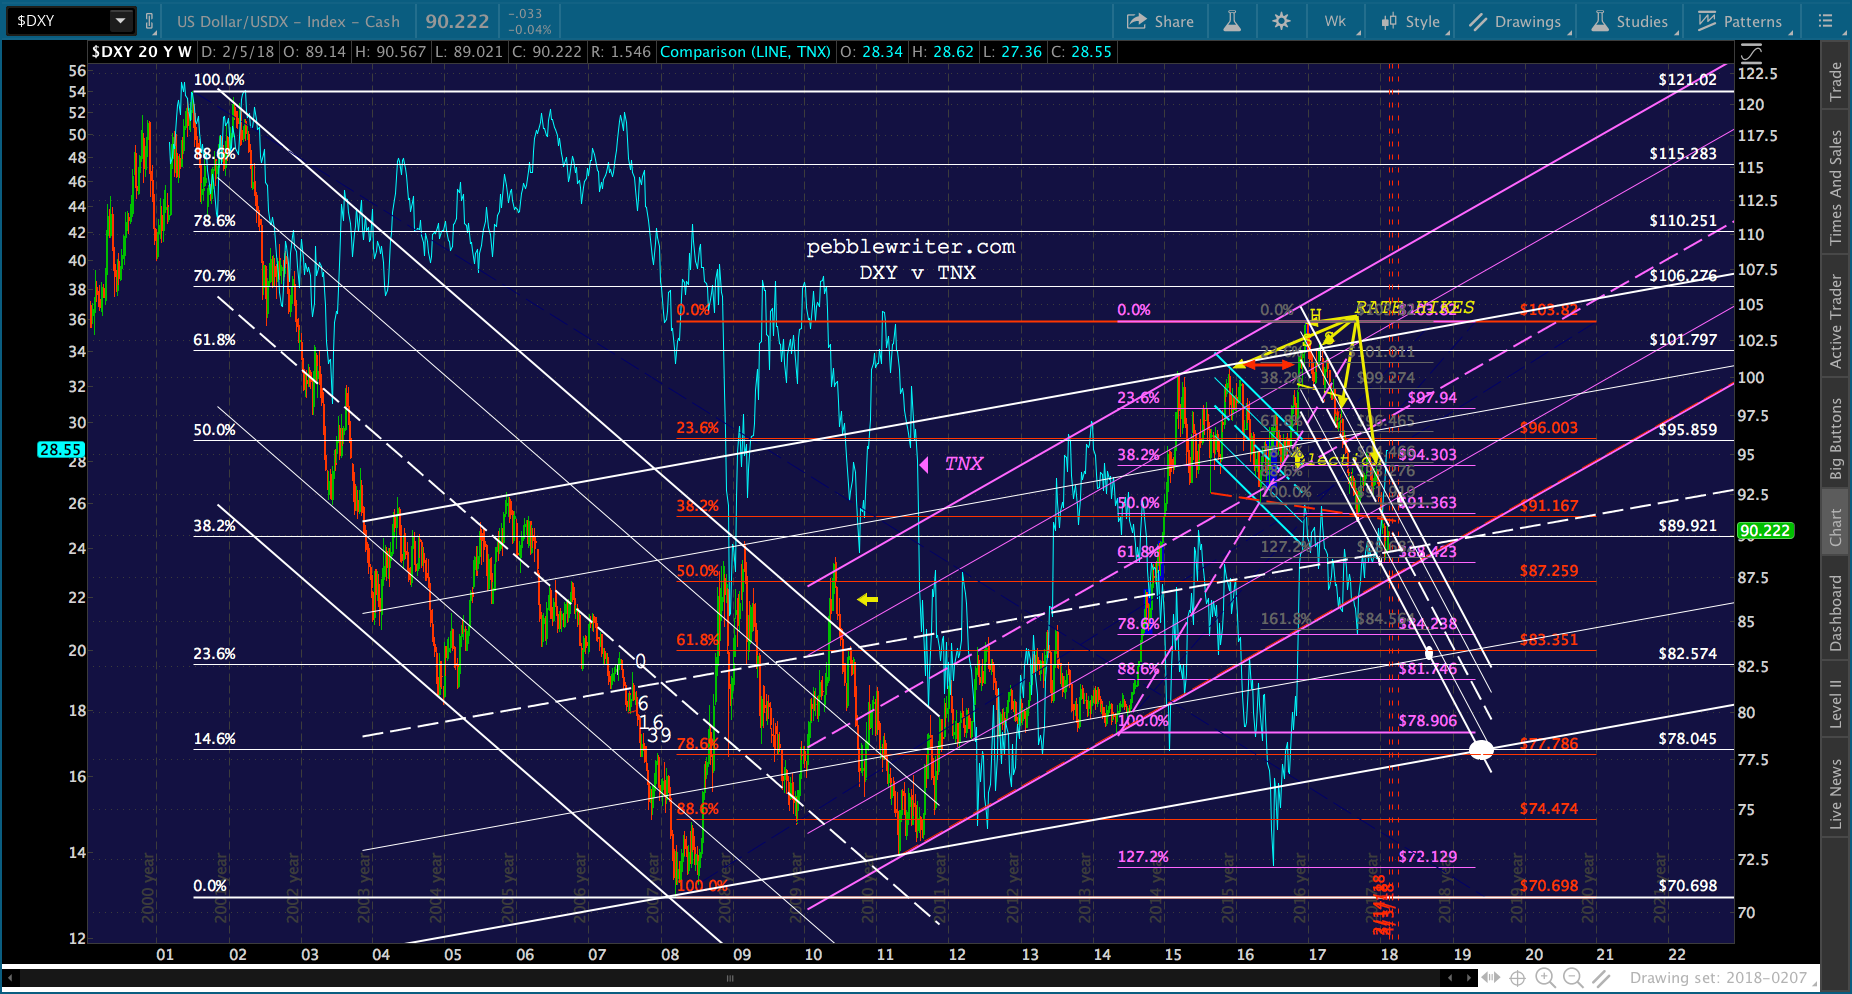 Even before the flash crash and analog came along, we were looking for a test of the rising purple channel bottom and the .500. If the analog plays out, we should expect the midline to break down and eventually lead to our lower targets such as the red .618 at 83.351 and the .786 at 77.786 at the bottom of the rising white channel.
 As an aside, gold supports the idea of further downside for DXY. It has dropped 4.1% since reversing where expected in late Jan, and just reached fanline and double channel support. It also just put in a dragonfly (reversal) candle — icing on the cake. Could it finally be ready to tag 1377-1380?
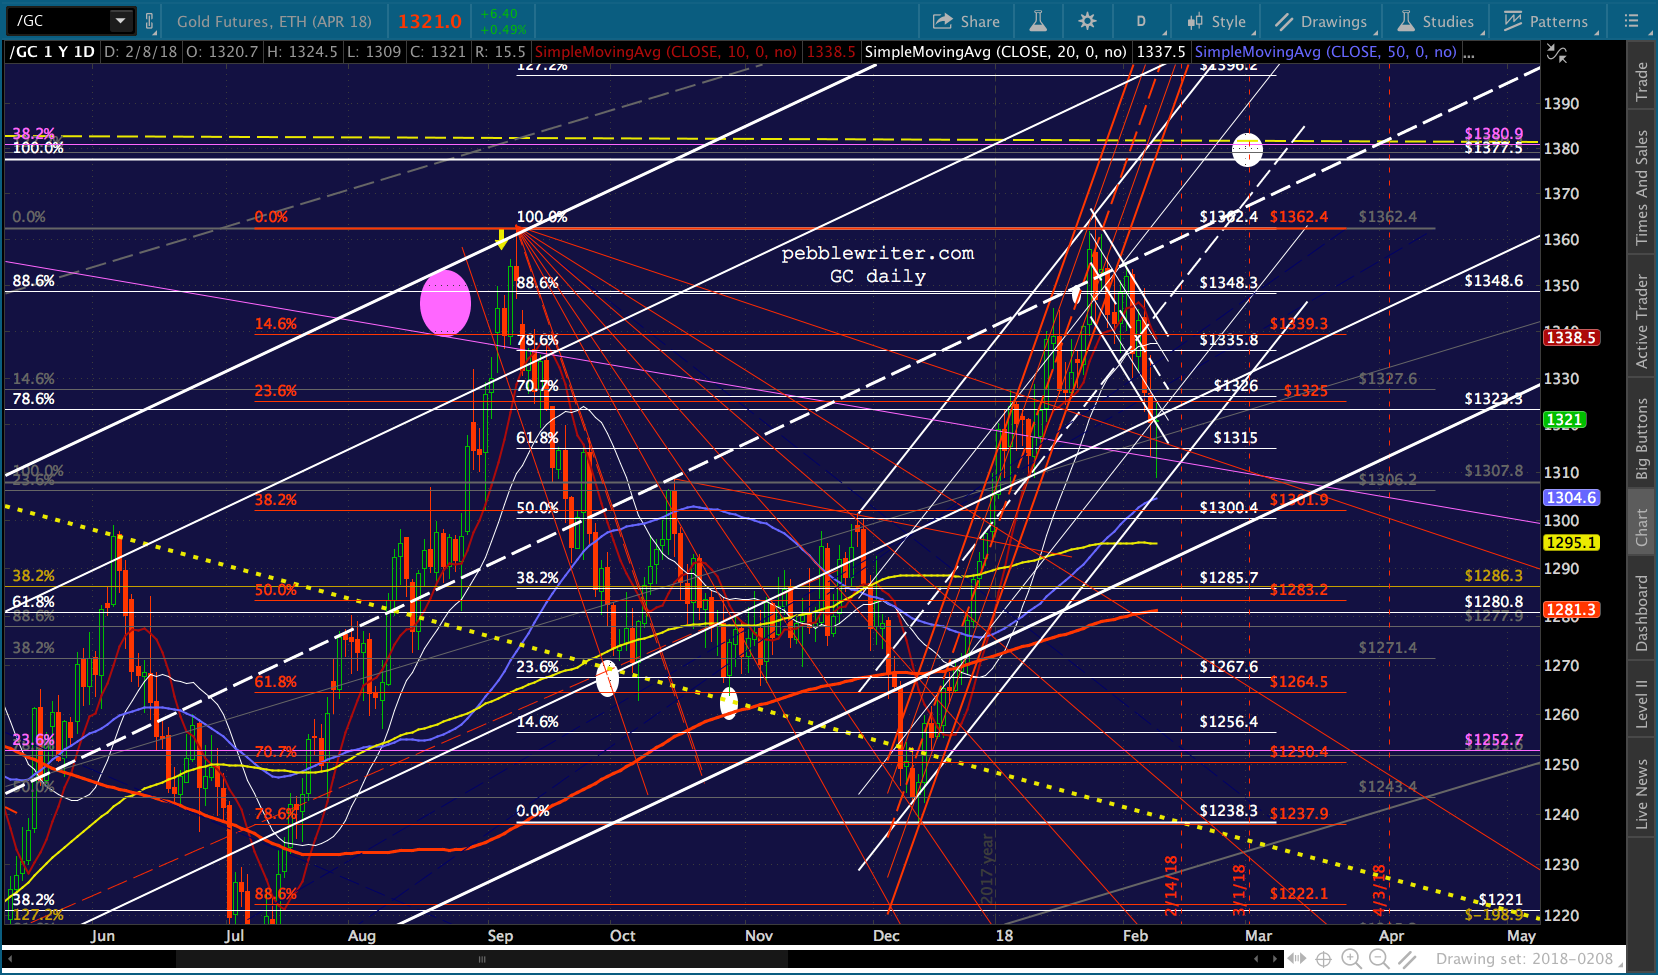
As to TNX, the analog suggests we’ll see interest rates drop right along side DXY. In 2007, central bankers actively reduced interest rates in order to mitigate the effects of the GFC. In addition, money shifted from stocks into bonds, further suppressing rates.
In the absence (yet) of a crash in 2018, rates are more likely to be affected by the growing fiscal deficit and enormous federal debt. In Sep 2007, the debt was a mere $9 billion. Now it’s almost $21 billion and, if Congress gets its way, will top $22 billion by this time next year. Looking at it another way, debt has more than doubled while 10-yr rates have dropped by only 46%.
 If TNX were to push through to the top of the falling white channel to 3.5%, rates would have dropped only a third. Bottom line: more debt service than the budget can handle. I think it’s much more likely TNX pulls back here as it did in 2007.
If it drops straight through to Day 16 and backtests on Day 39, it might look something like this (the mild case)…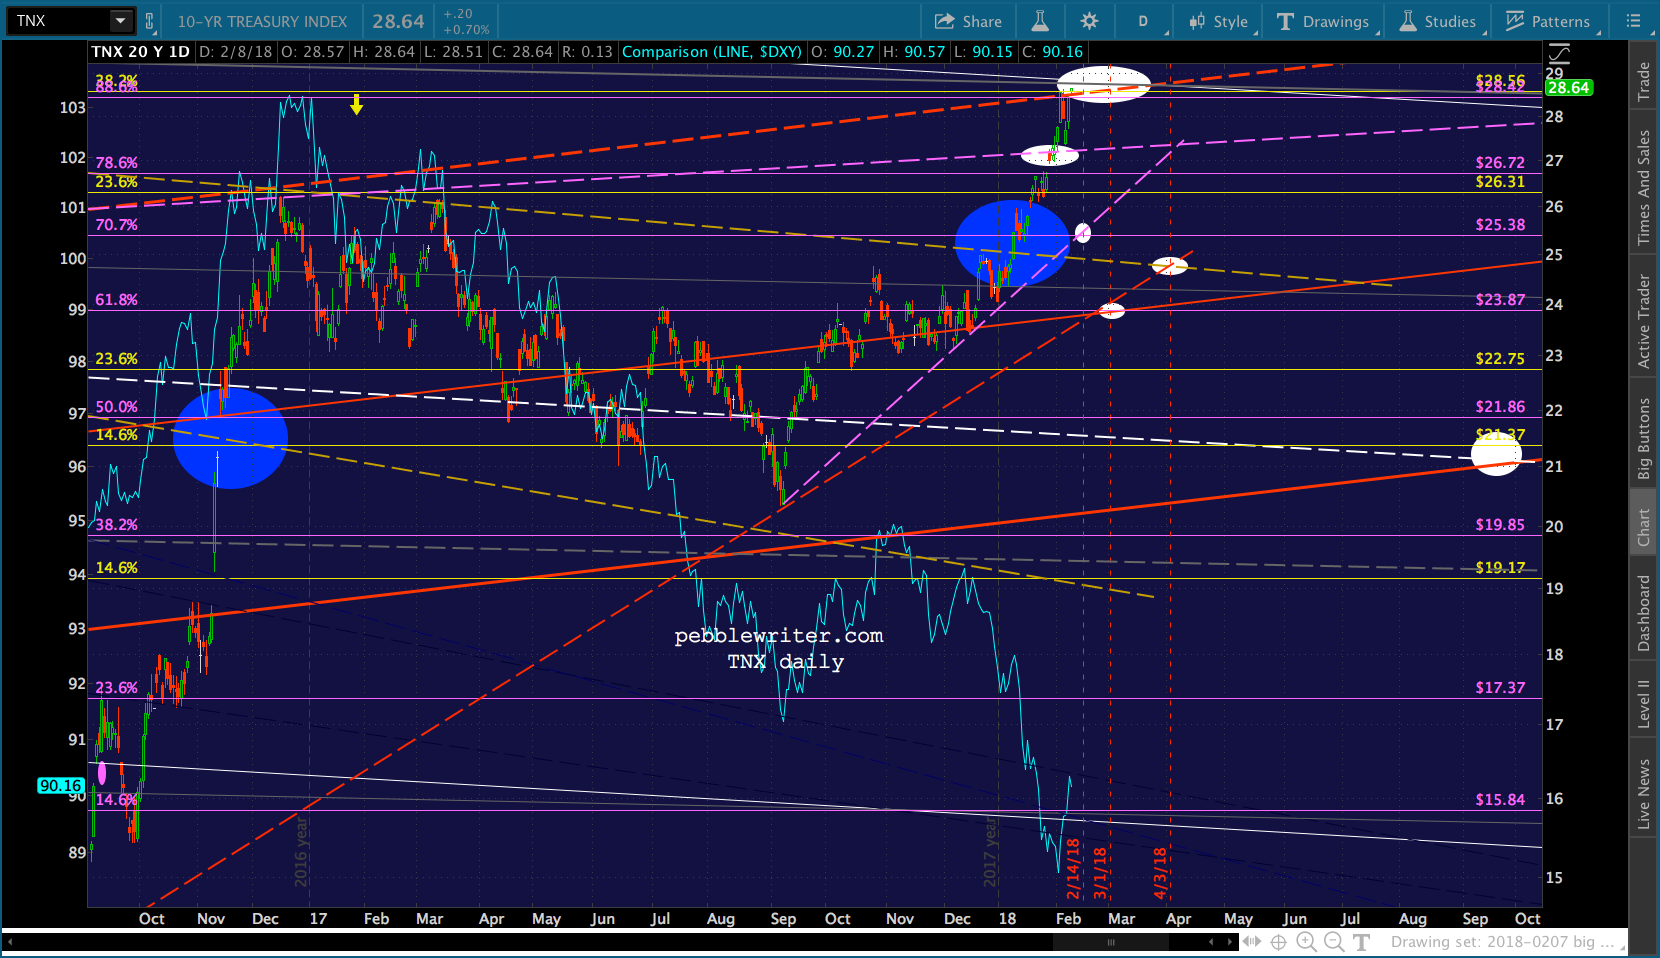 ..or this (the more severe case.)
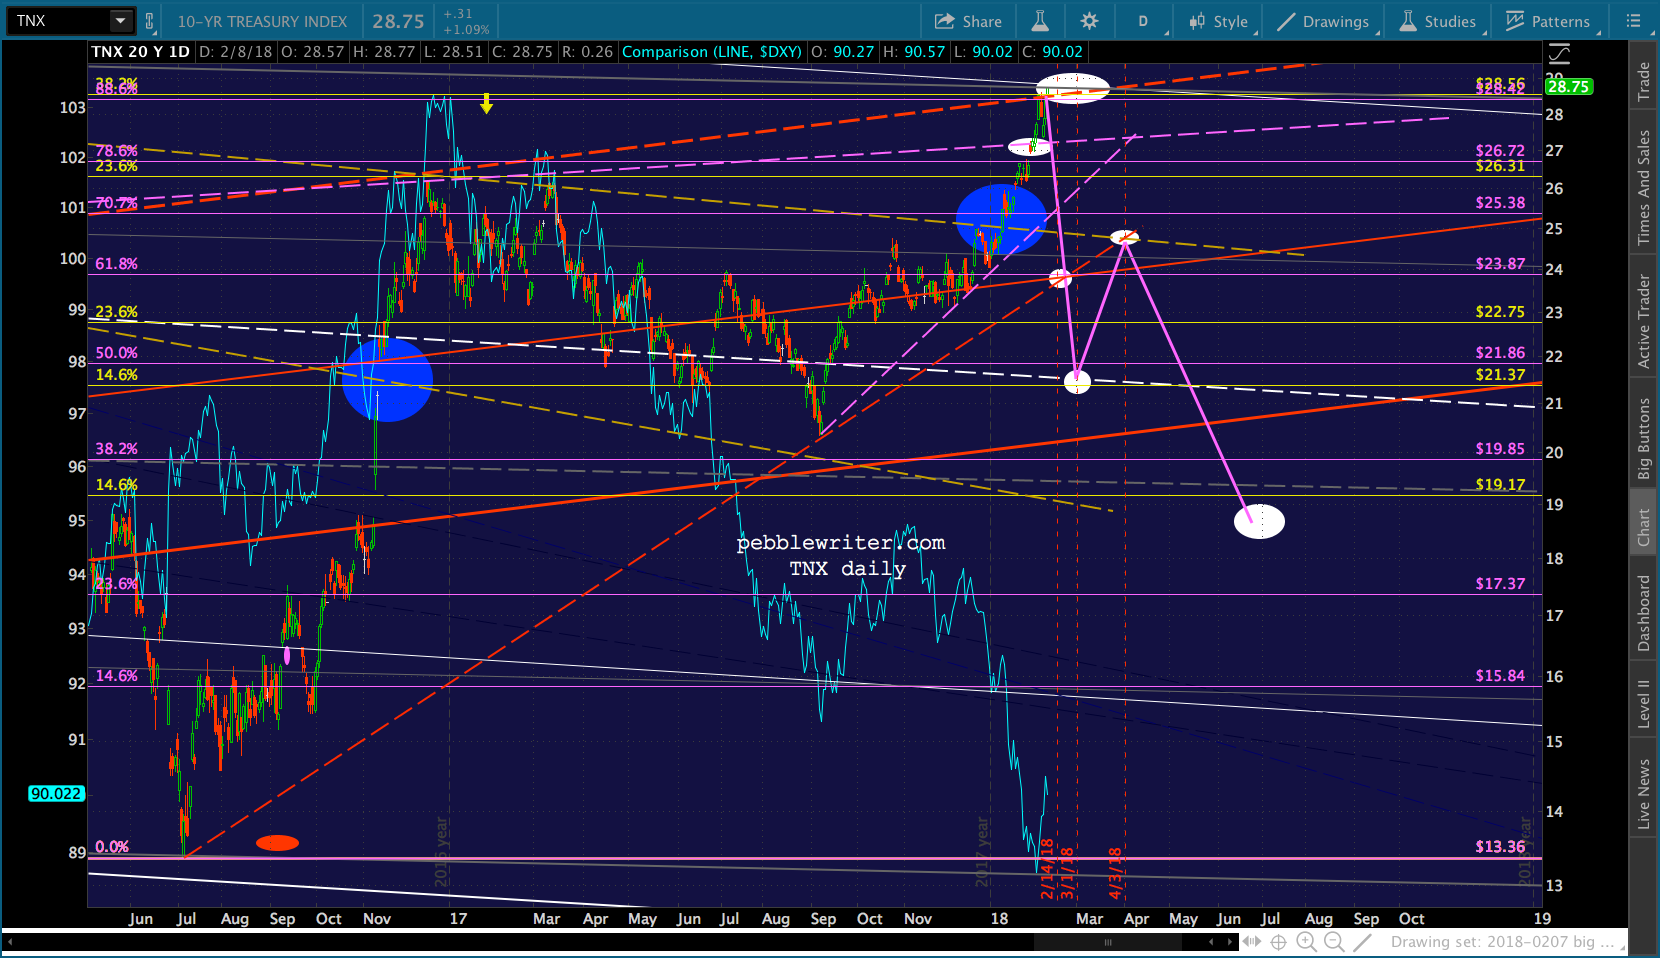
ZN:
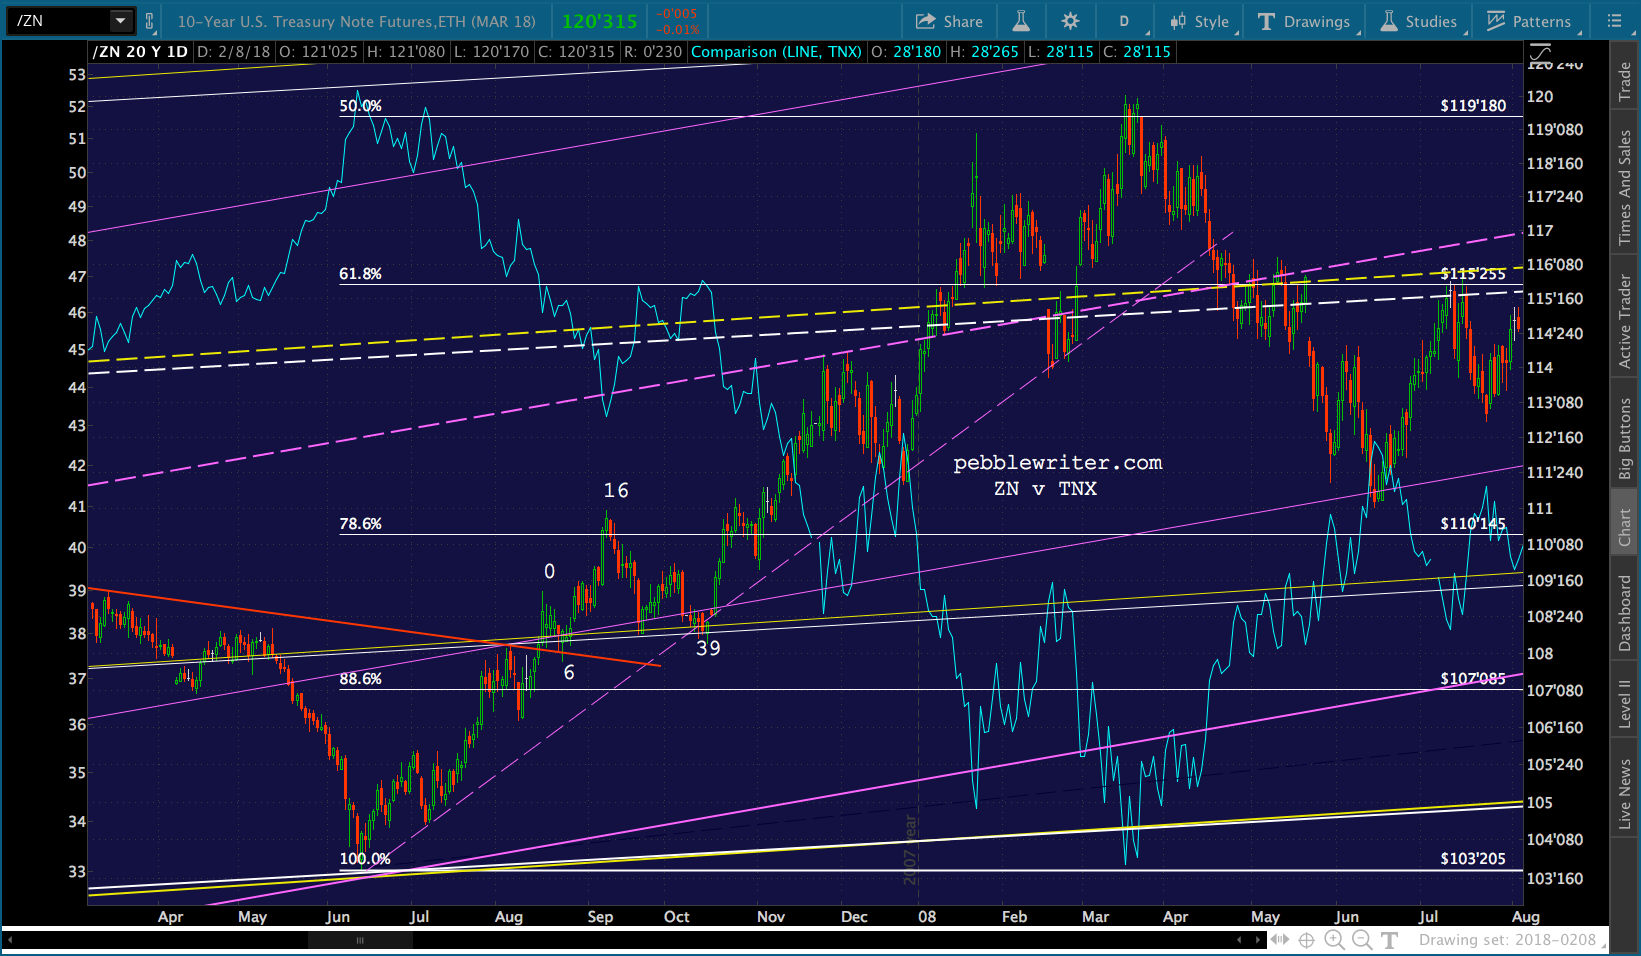
Back in 2007, note prices didn’t fluctuate as much as the rate fluctuation might have suggested. ZN had just broken out of a falling wedge and above two channel .236 lines.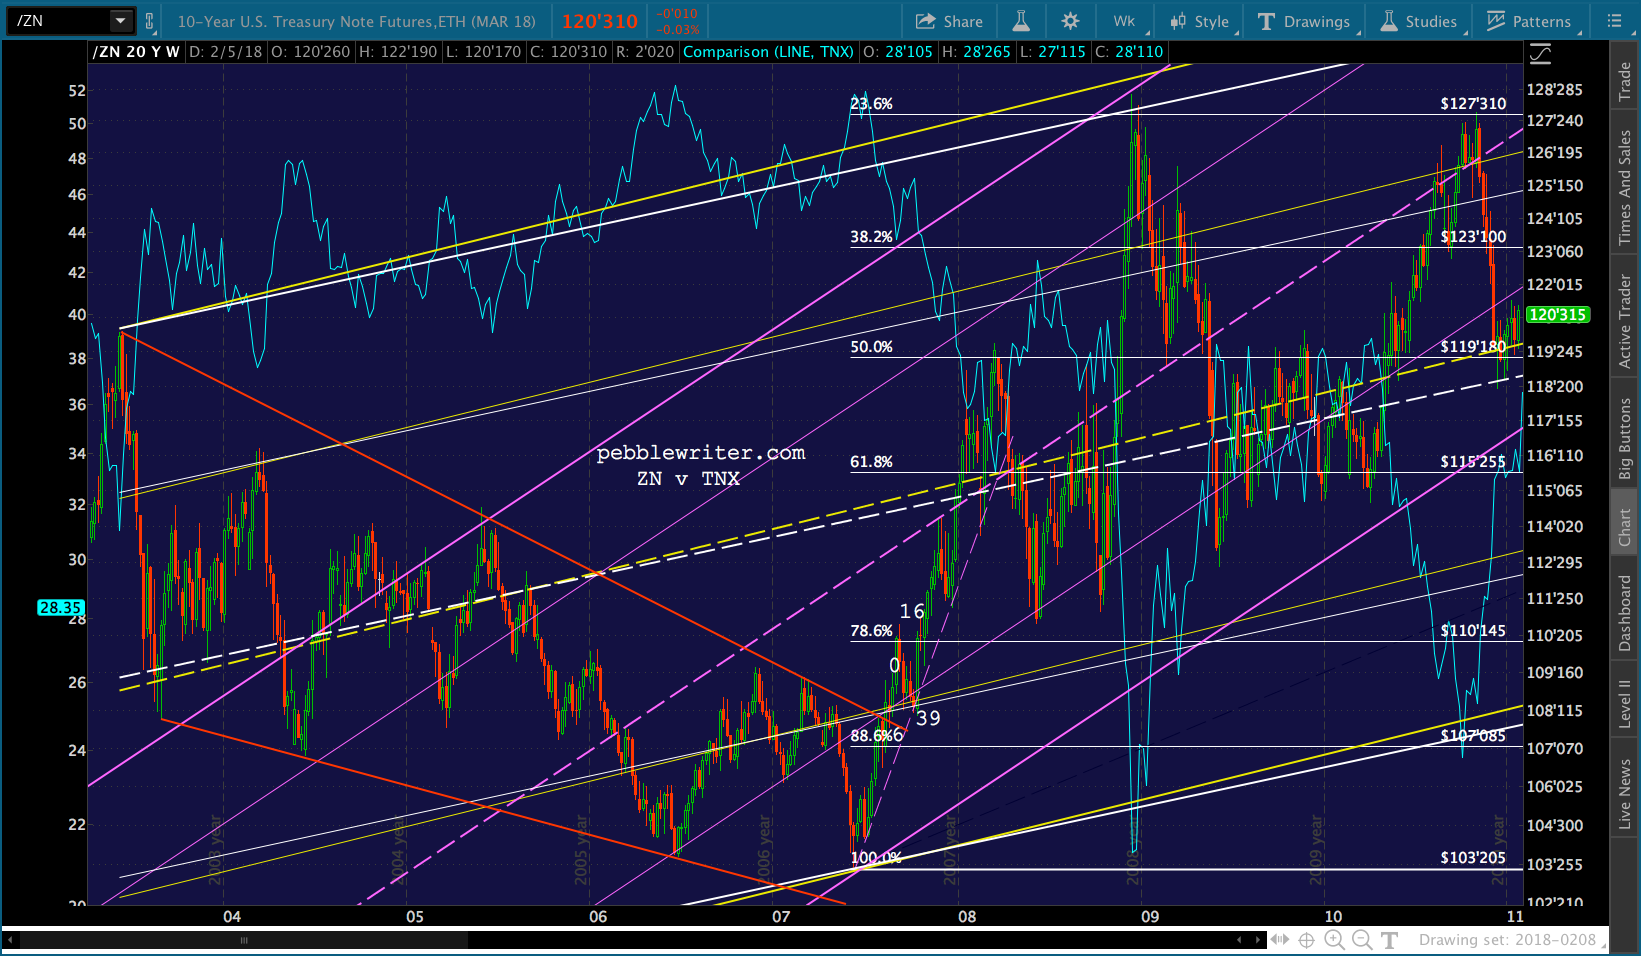
Contrast this with today, where ZN has been falling for months and we’re simply wondering whether or not it’s bottomed.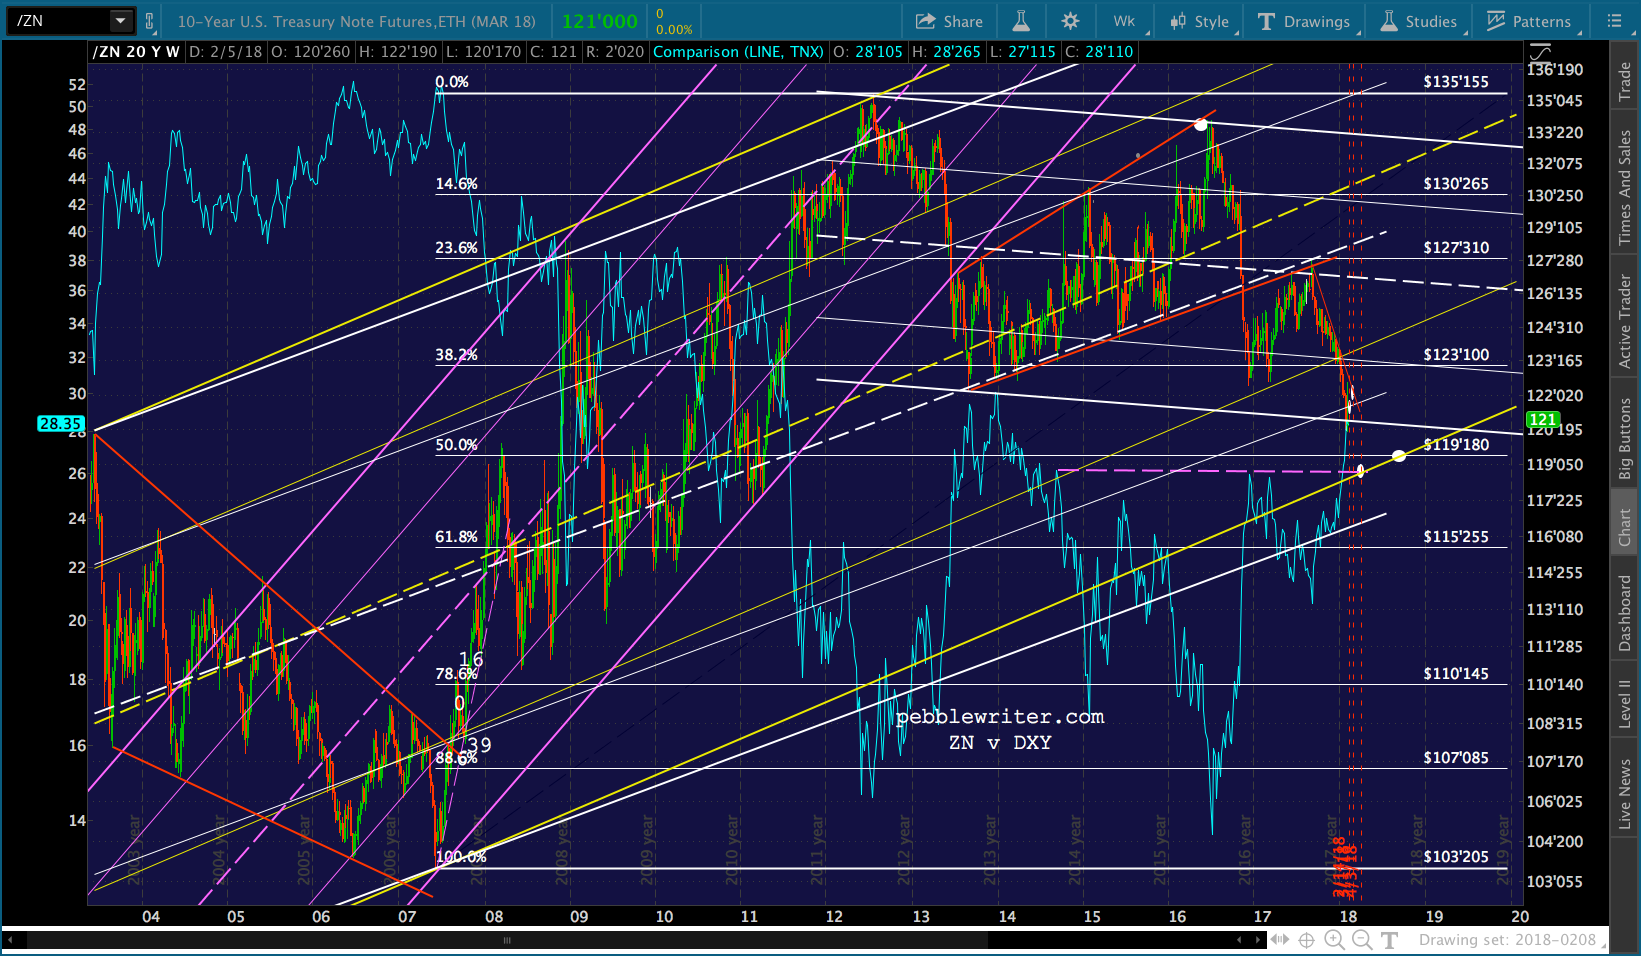 Nevertheless, the VIX spike oin 2007 came with pop up through resistance. Day 6 was a backtest. Day 14 was a new high and Day 39 was a dip that was higher than Day 6 and helped establish a new rising, purple TL.
 If we apply the same price action to today, we’d have something like the chart below. Note that there are two rising channels from 2008, each with its own merits. The yellow one fits the tops in 2003 and 2012, but does a lousy job with its midline. The white one fits the midline perfectly, but doesn’t account for the 2012 overshoot.
Since TNX dropped below where it should have in 2012, I’m inclined to favor the white channel and its target of 117’130. But, it would mean TNX pops up above 3%, which doesn’t seem as likely as the reversal at 2.86%. Bottom line, be ready to go long at the yellow channel (currently 118’125ish.) But, be prepared for a drop though to the white channel at 117’125 — depending on when.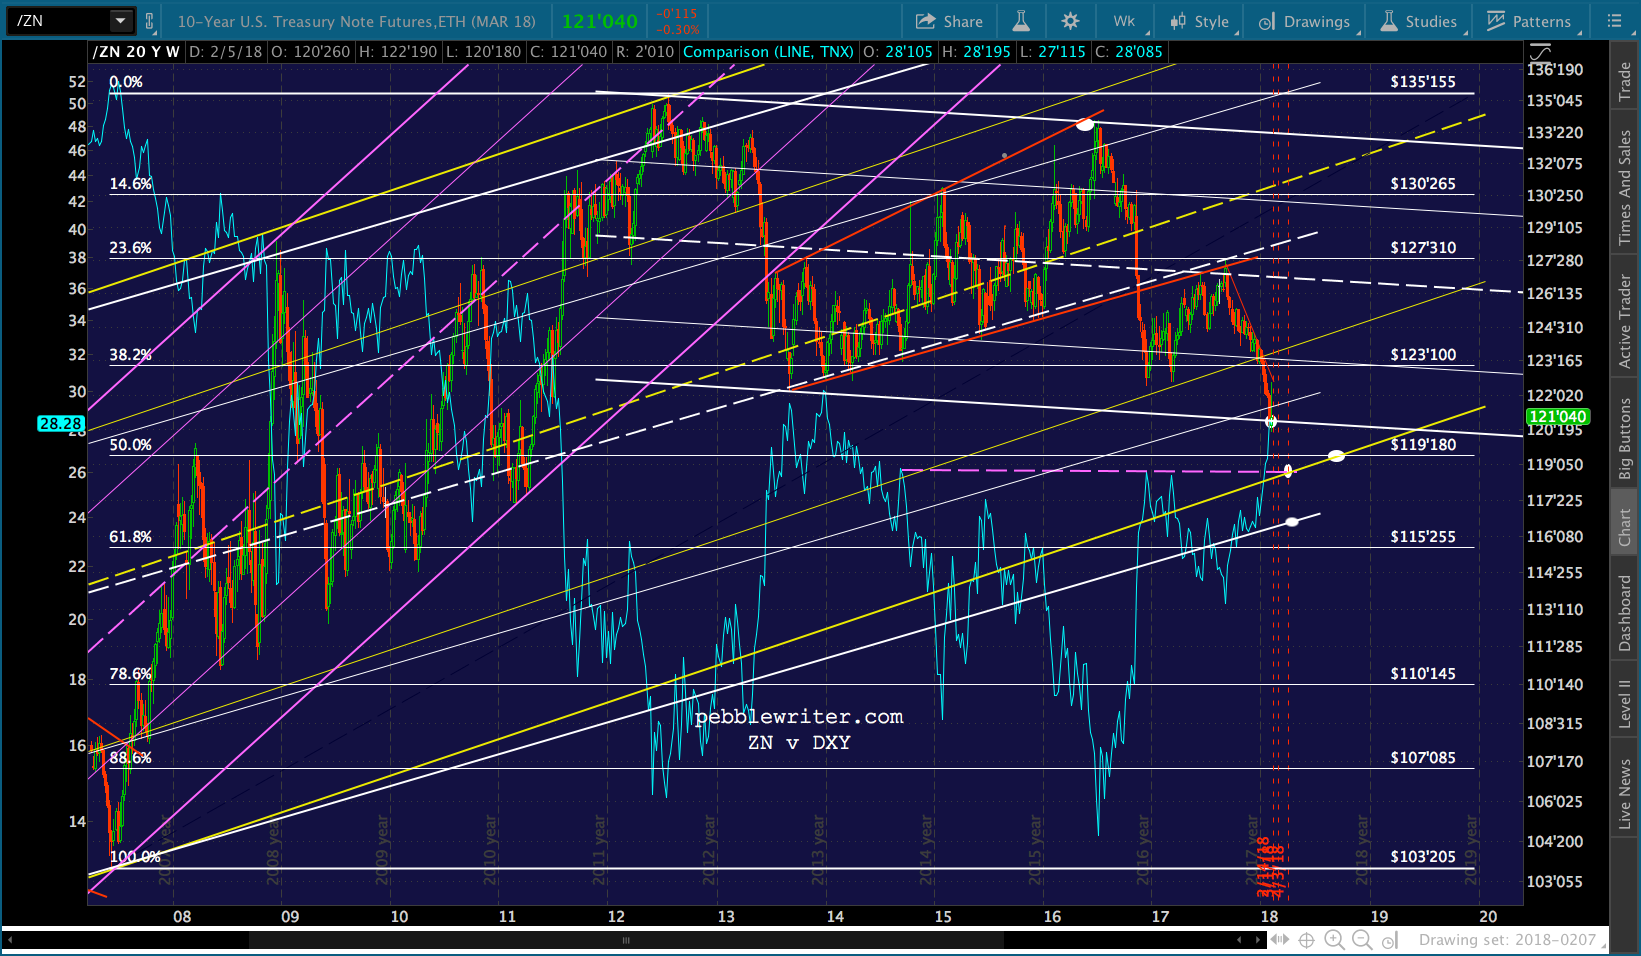
USDJPY
Leading up to Aug 2007, USDJPY had climbed along a TL from a double bottom in 2004. It had pushed above its falling white channel top – an overshoot, which was largely responsible for SPX exceeding its .886 from the 2000-2003 crash. Had this overshoot not occurred, SPX would have reversed and continued lower without exceeding 2000’s highs.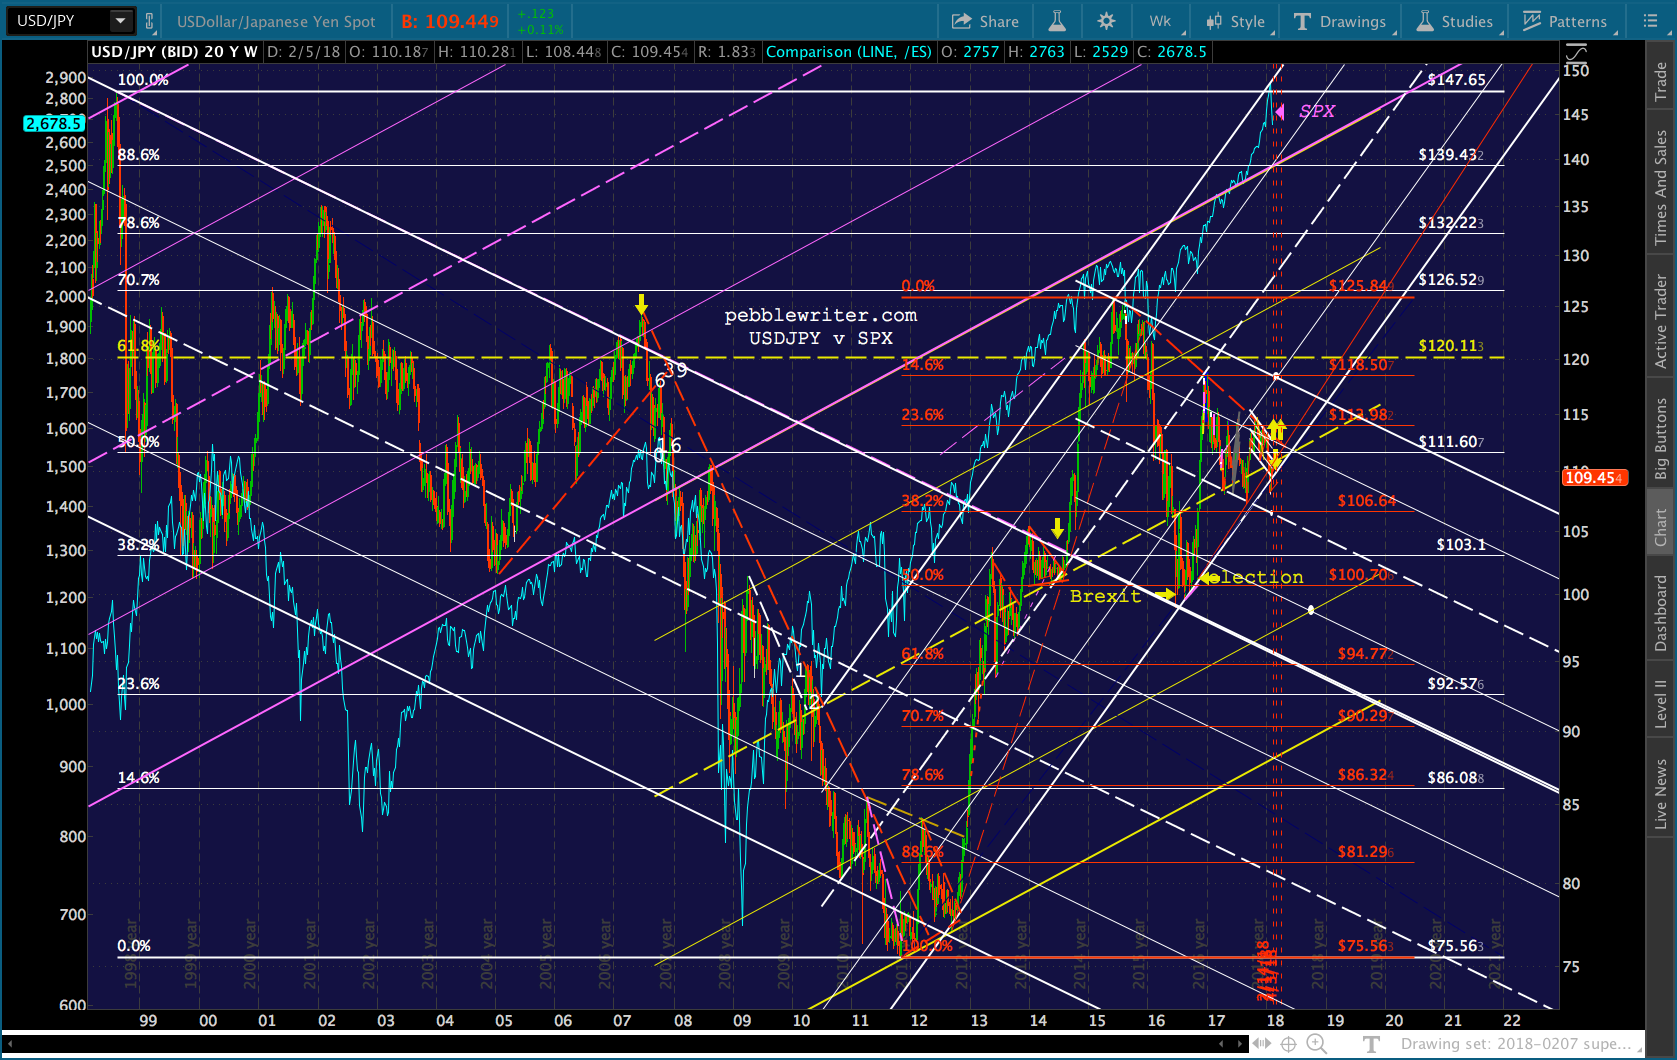 Day 0, the day VIX broke out, USDJPY dropped below the red TL, all the way to the nearest Fib level of support. Day 6 saw it backtest the red TL. Day 16 saw another, not quite as deep drop. And, Day 39 saw a higher backtest that lagged SPX’s top by just a few days and kicked off a dramatic plunge from 118 to 96 in 5 months.
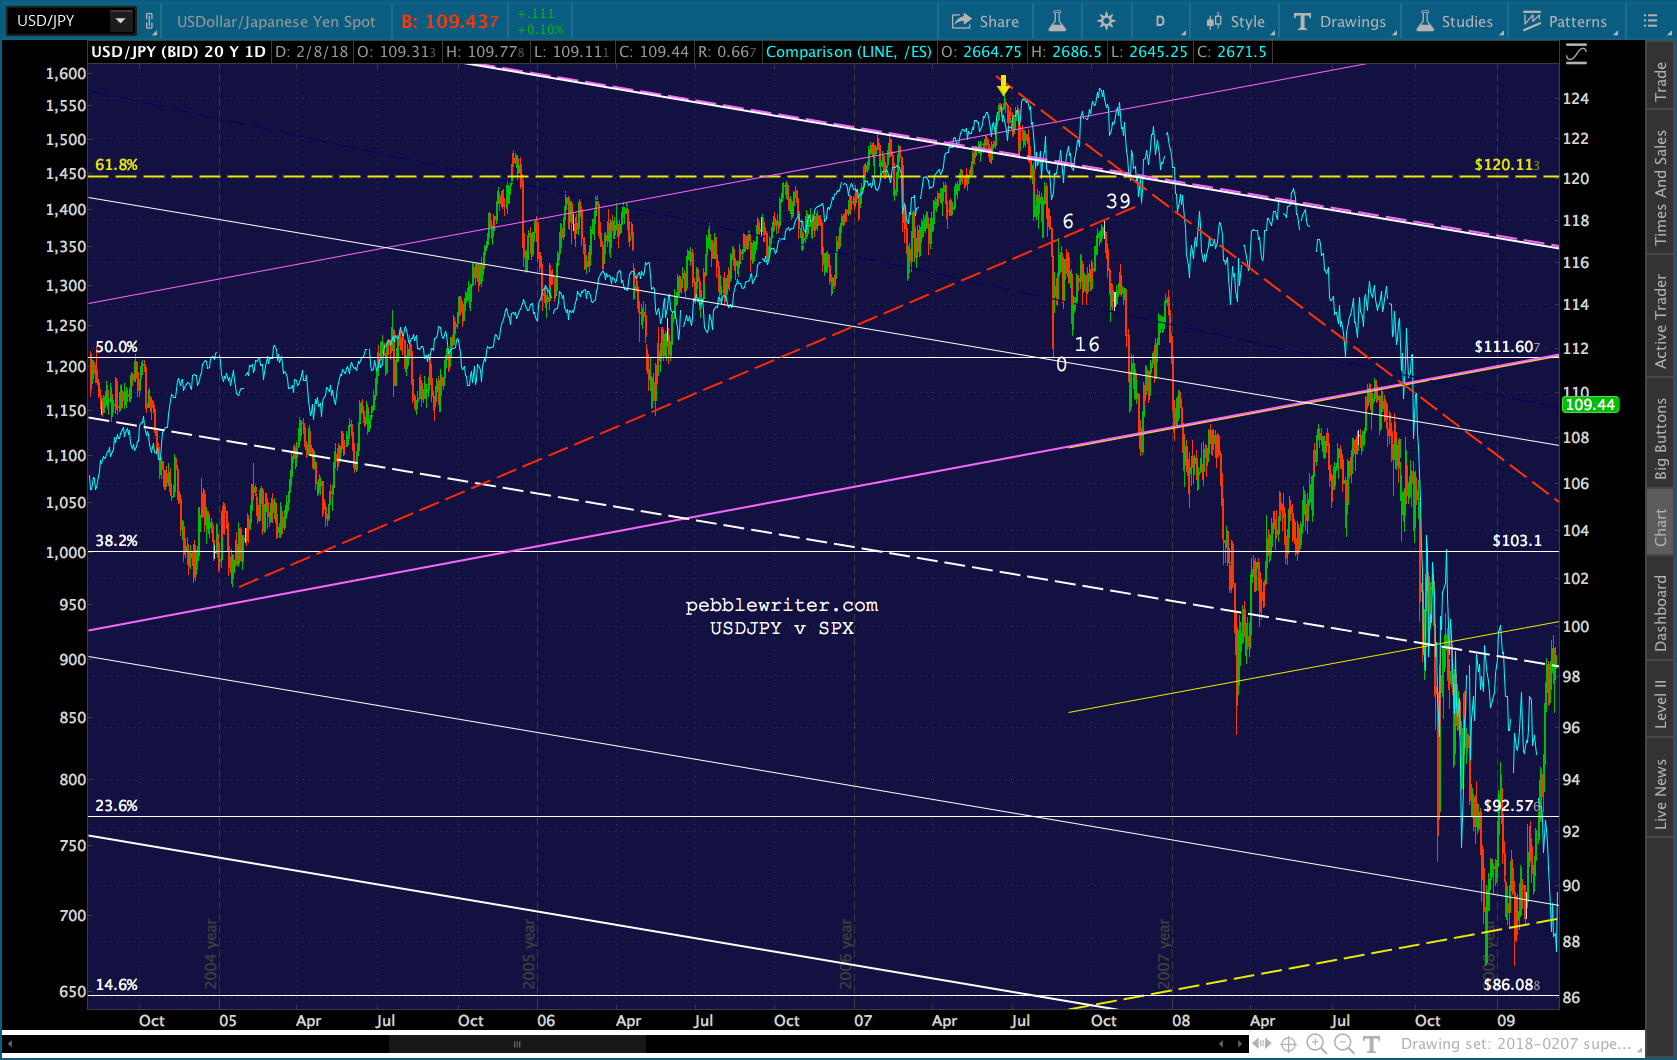 The fact that USDJPY broke through a falling TL (shown below in yellow) was enough for the bulls. They were completely willing to overlook the fact that it happened on a backtest of a much larger, more important TL.
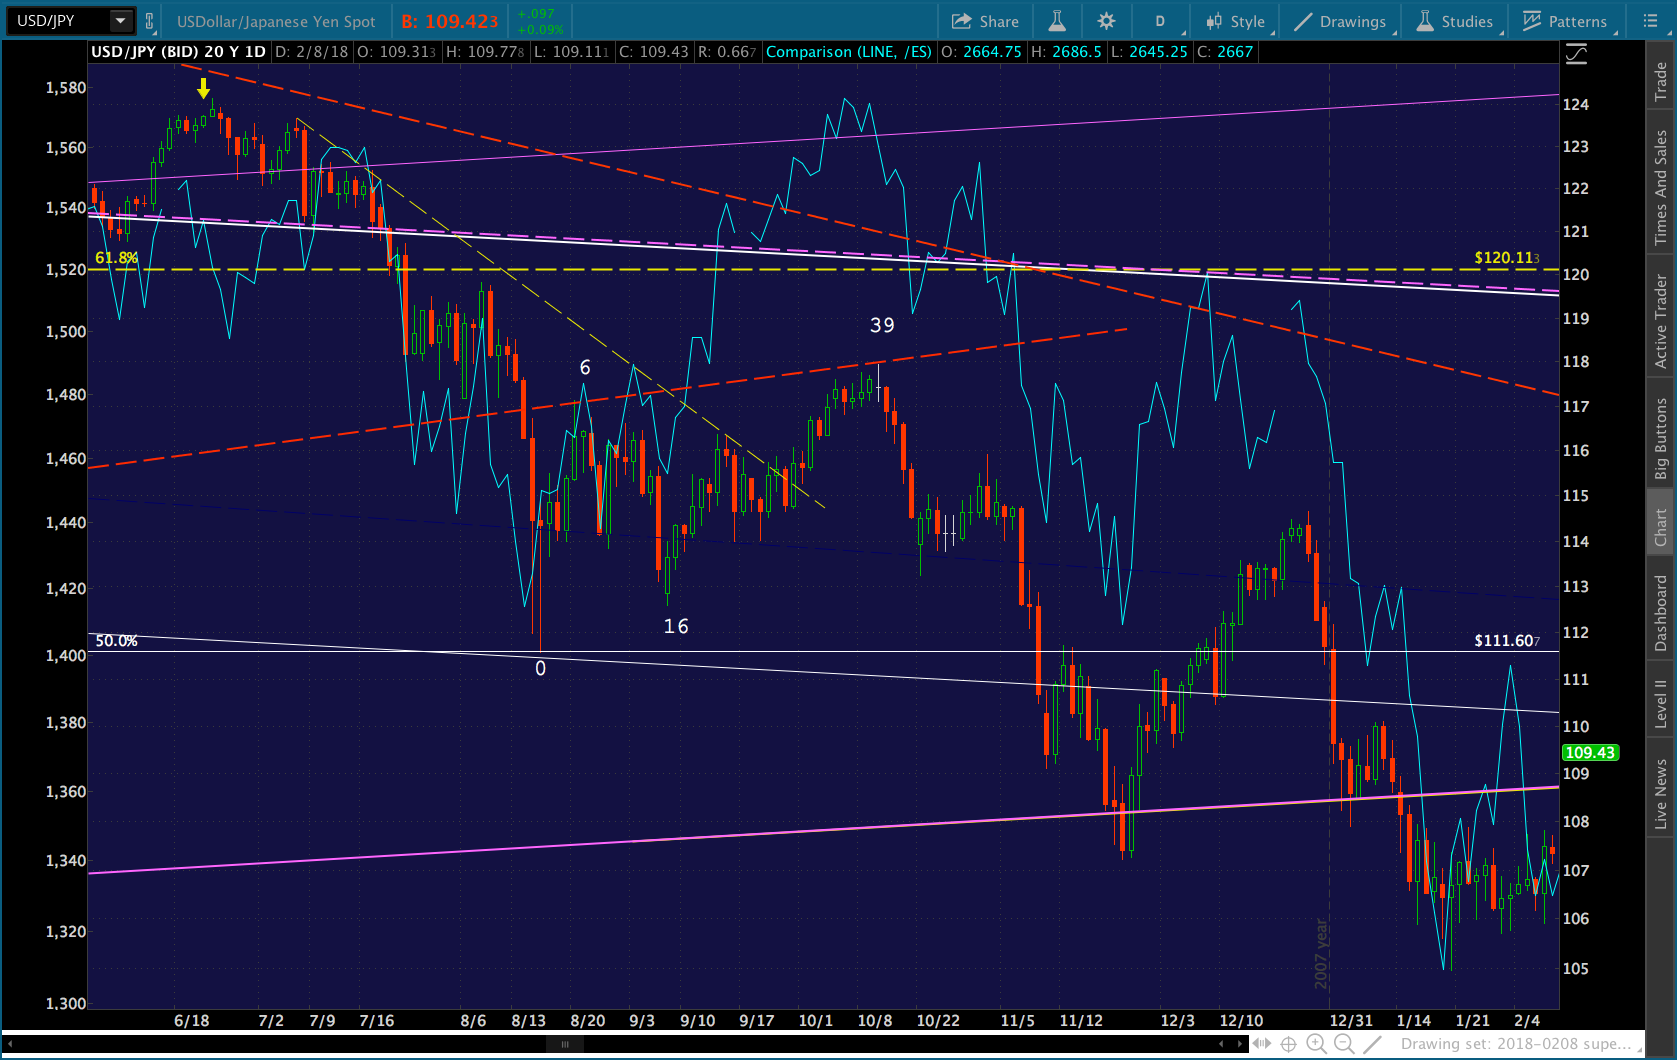 Once USDJPY broke down through the TL (not shown) connecting the Day 0 and Day 16 lows, SPX began falling in earnest. There was no more support, and the crash had begun.
Here in 2018, the major line of support is the white channel bottom — a much steeper “trend line.” The prospect of losing this support has the yen carry trade crowd very much on edge.
But, things are a little more complicated by the fact that this channel bottom hasn’t lined up with a more tightly fitting TL (in red) from the election night lows.
And, things are further complicated by the fact that both the white channel bottom and the red TL already broke down before the VIX breakout — that first white dot on Jan 26. In fact, this was a big factor in the VIX breakout.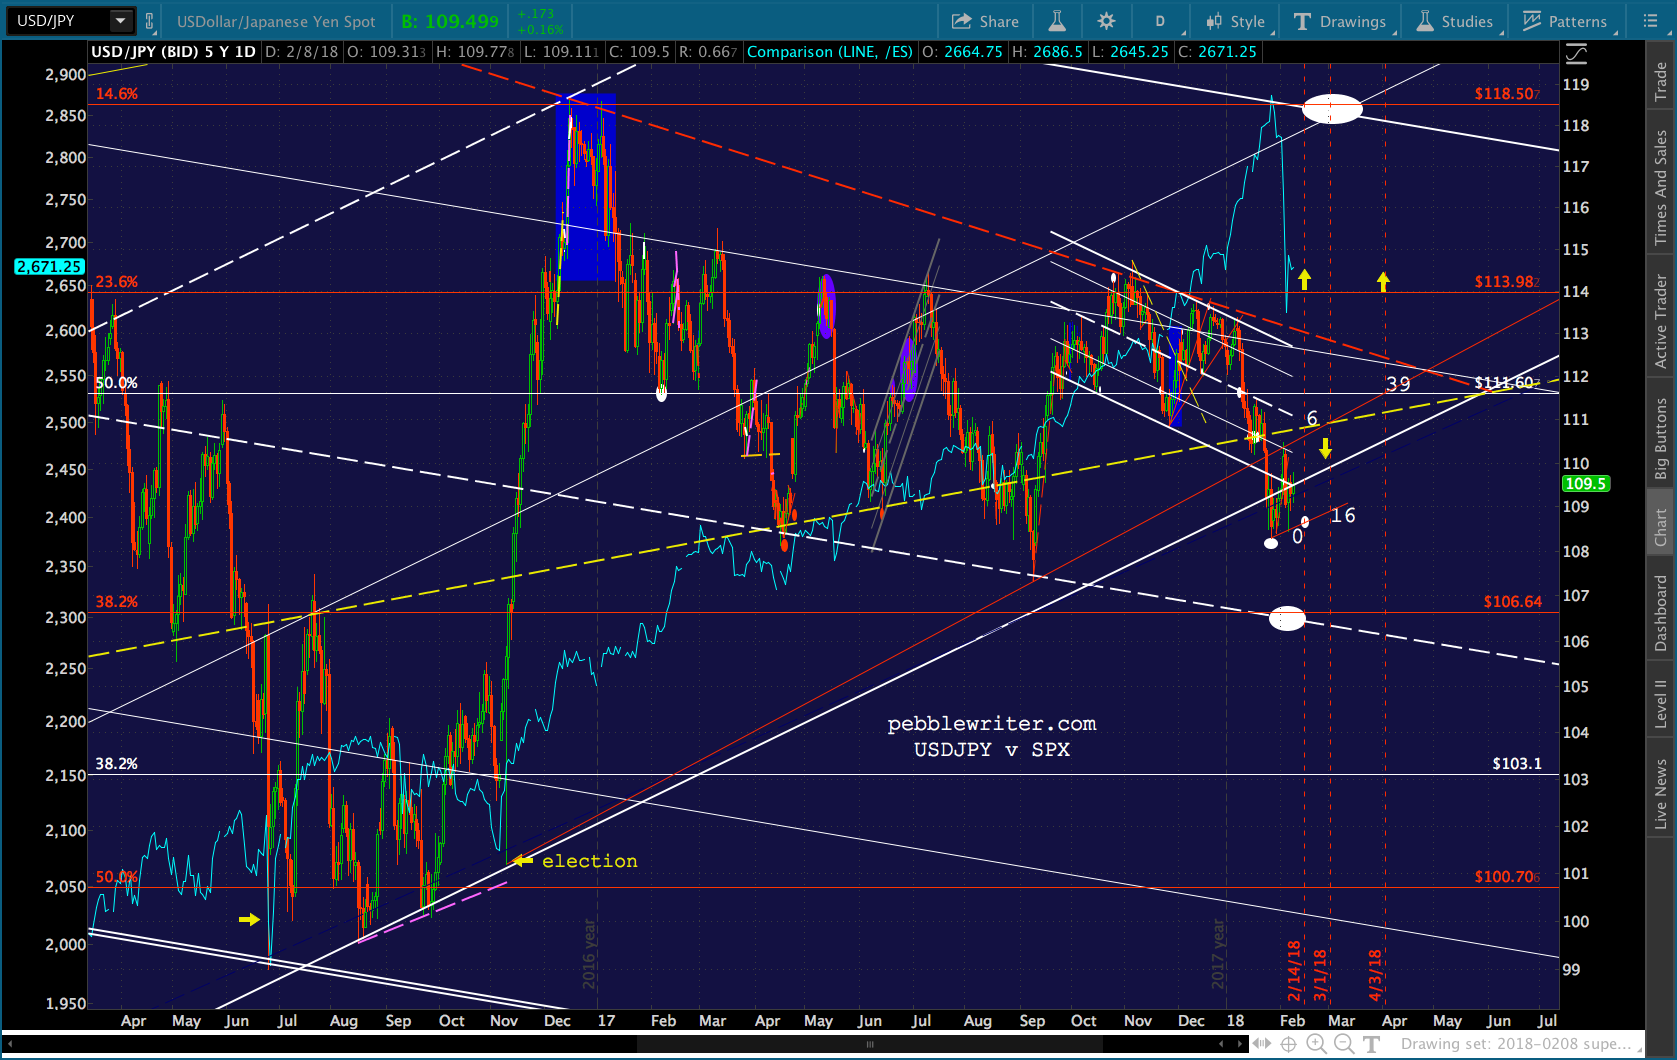 I think it’s safe to say the central bankers pulling the levers are a little more sophisticated than in 2007. What they’ve done so far is to play with the channel bottom as a means of goosing stocks higher.
The mild case: Day 6 could see a backtest of the rd TL and yellow midline up around 110.75, while Day 16 would drop to the small red TL connecting the previous lows and Day 39 will see the pair rally to a higher backtest, perhaps at the .500 Fib at 111.60.  The more severe case could see Day 39 rally up to the red channel top around 112.42.
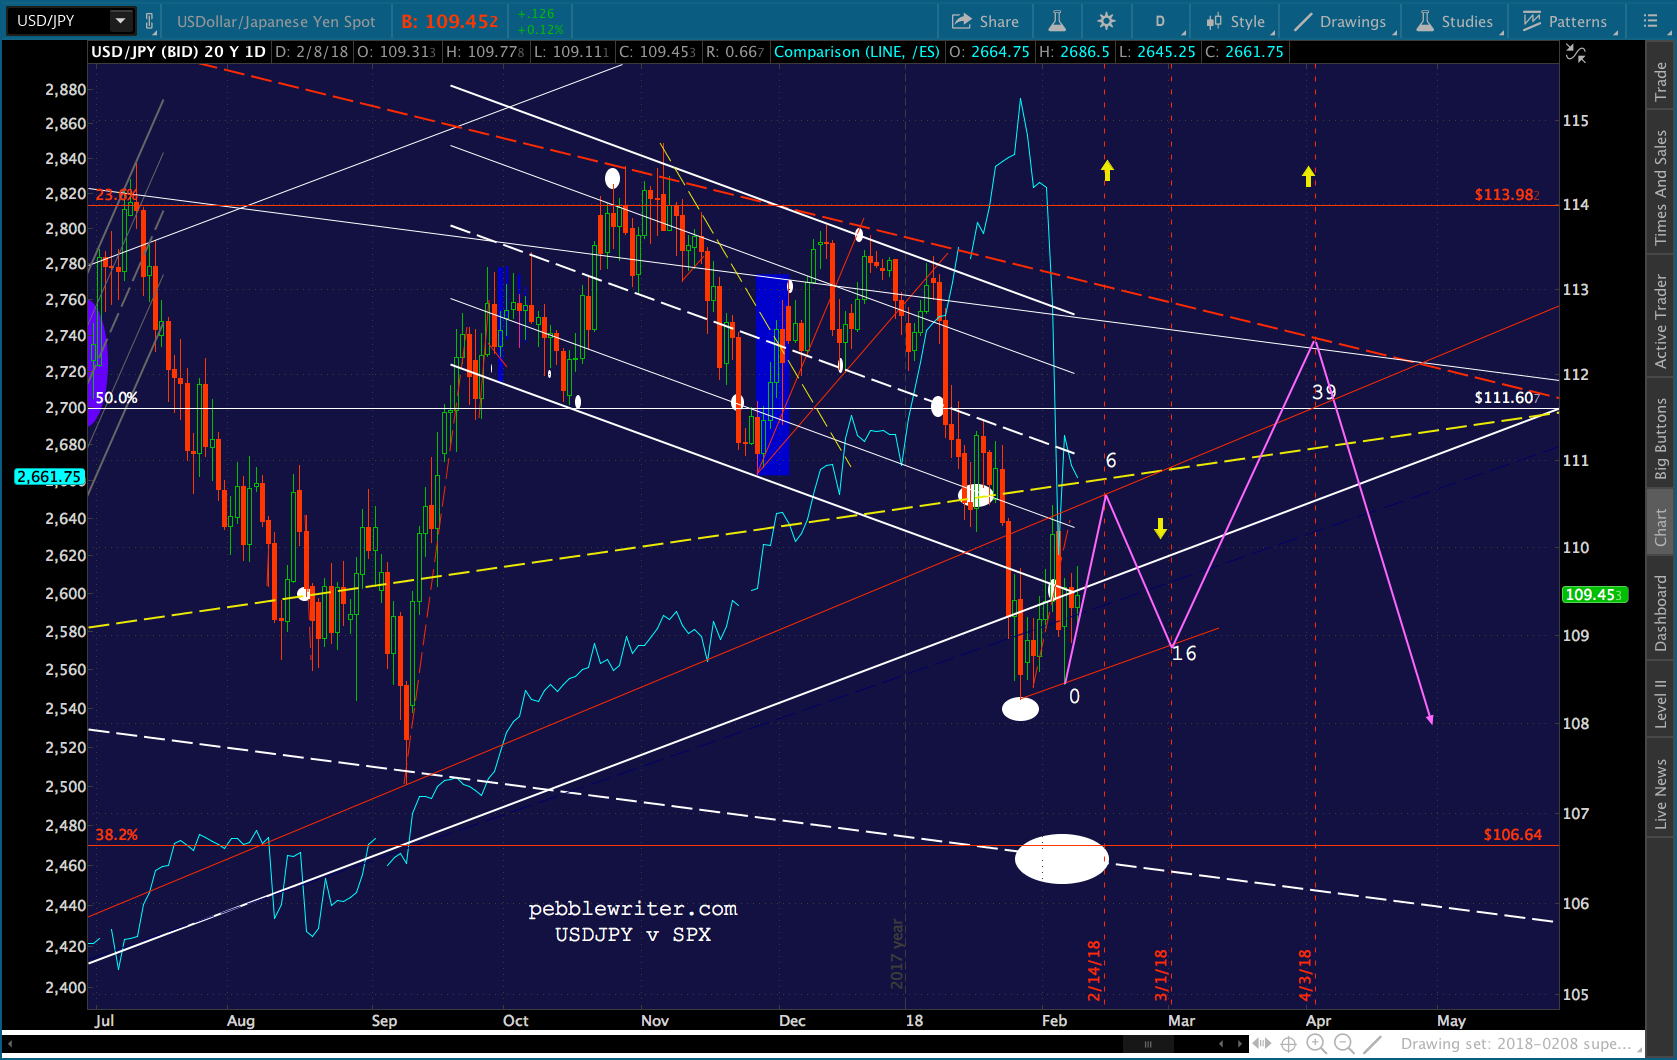
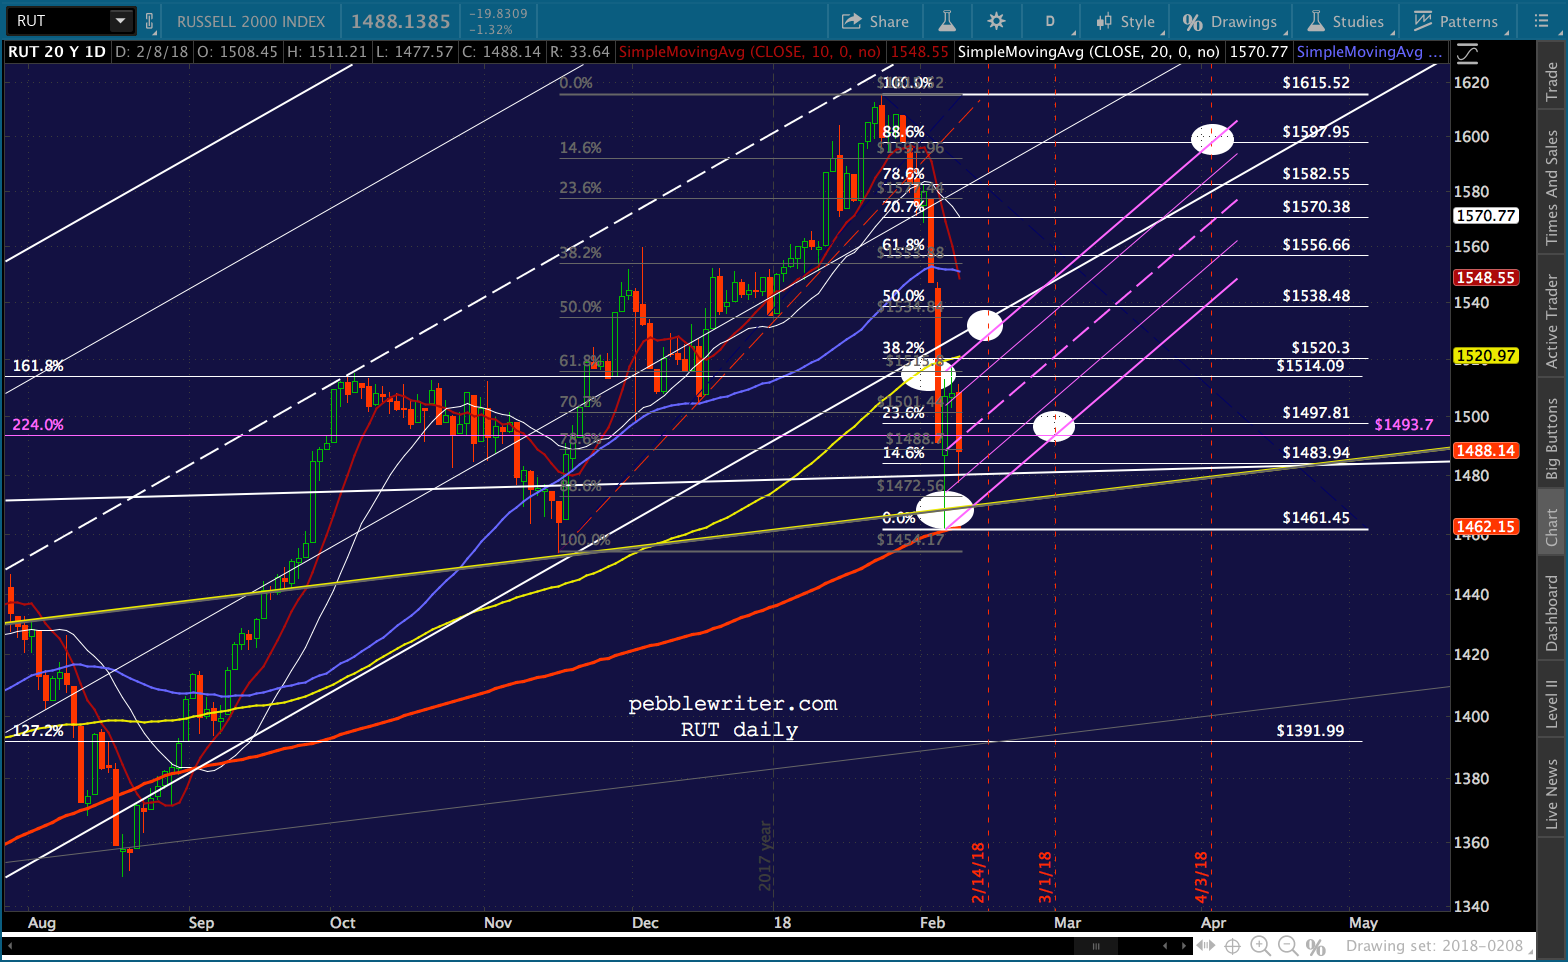
RUT
Somewhat surprisingly, RUT didn’t make a new high in Oct 2007. 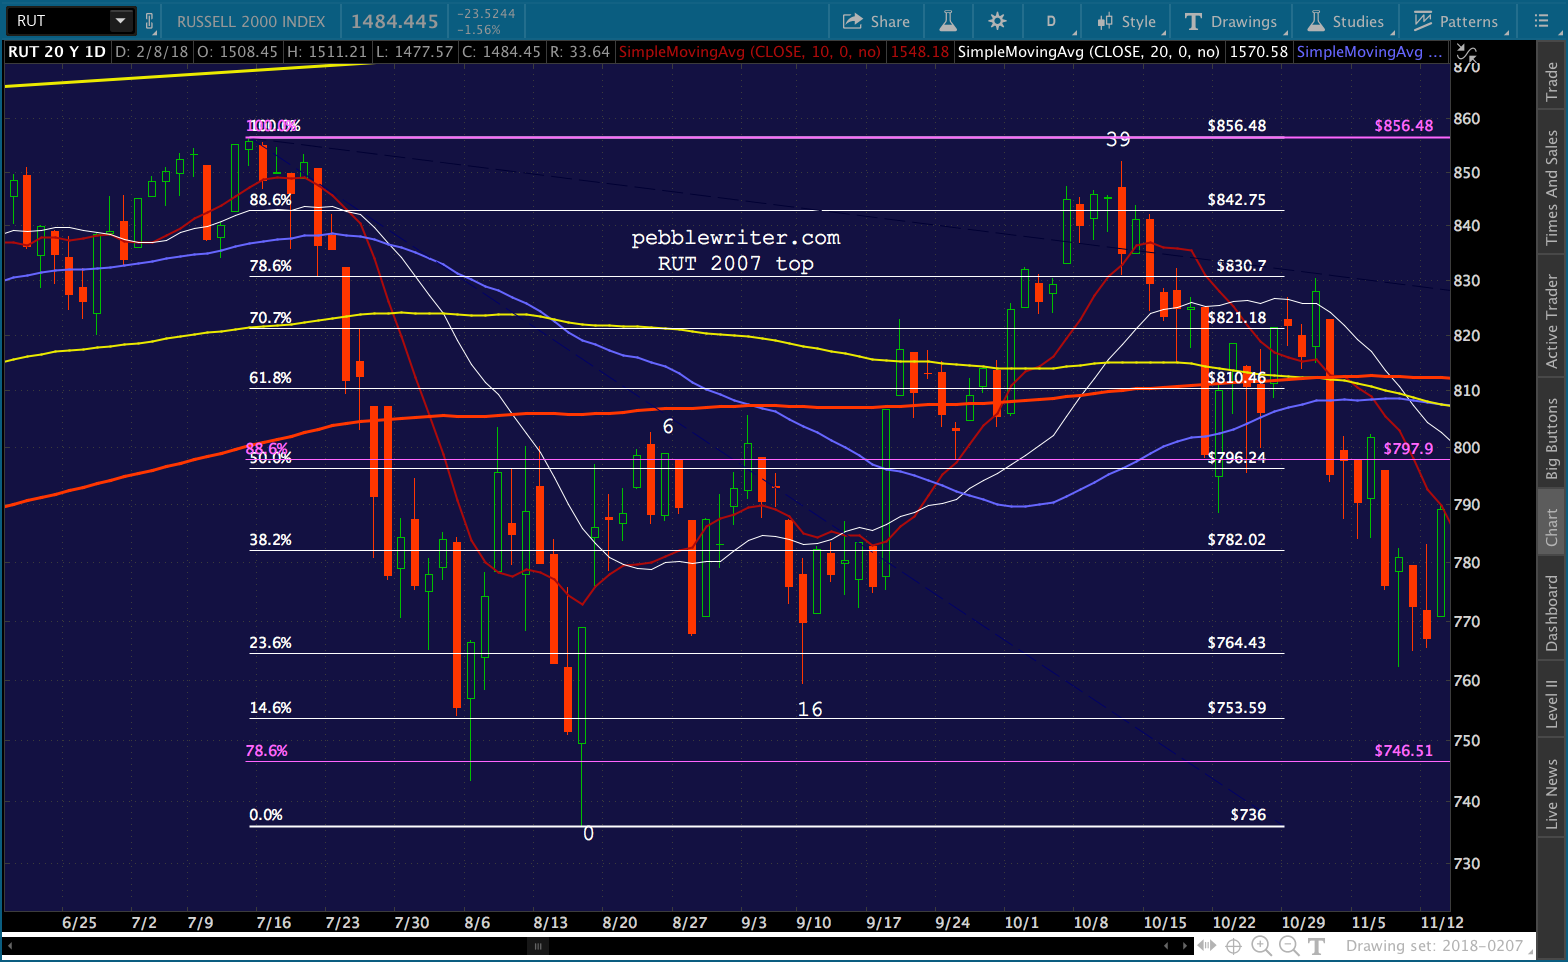 Fully aware of RUT’s tendency to pull off miraculous recoveries, I’ll throw this out there. It would involve a rejoining of the rising white channel and single-minded determination to remain above the two important fib extensions at 1494 and 1514.
UPDATE: 3:27 PM
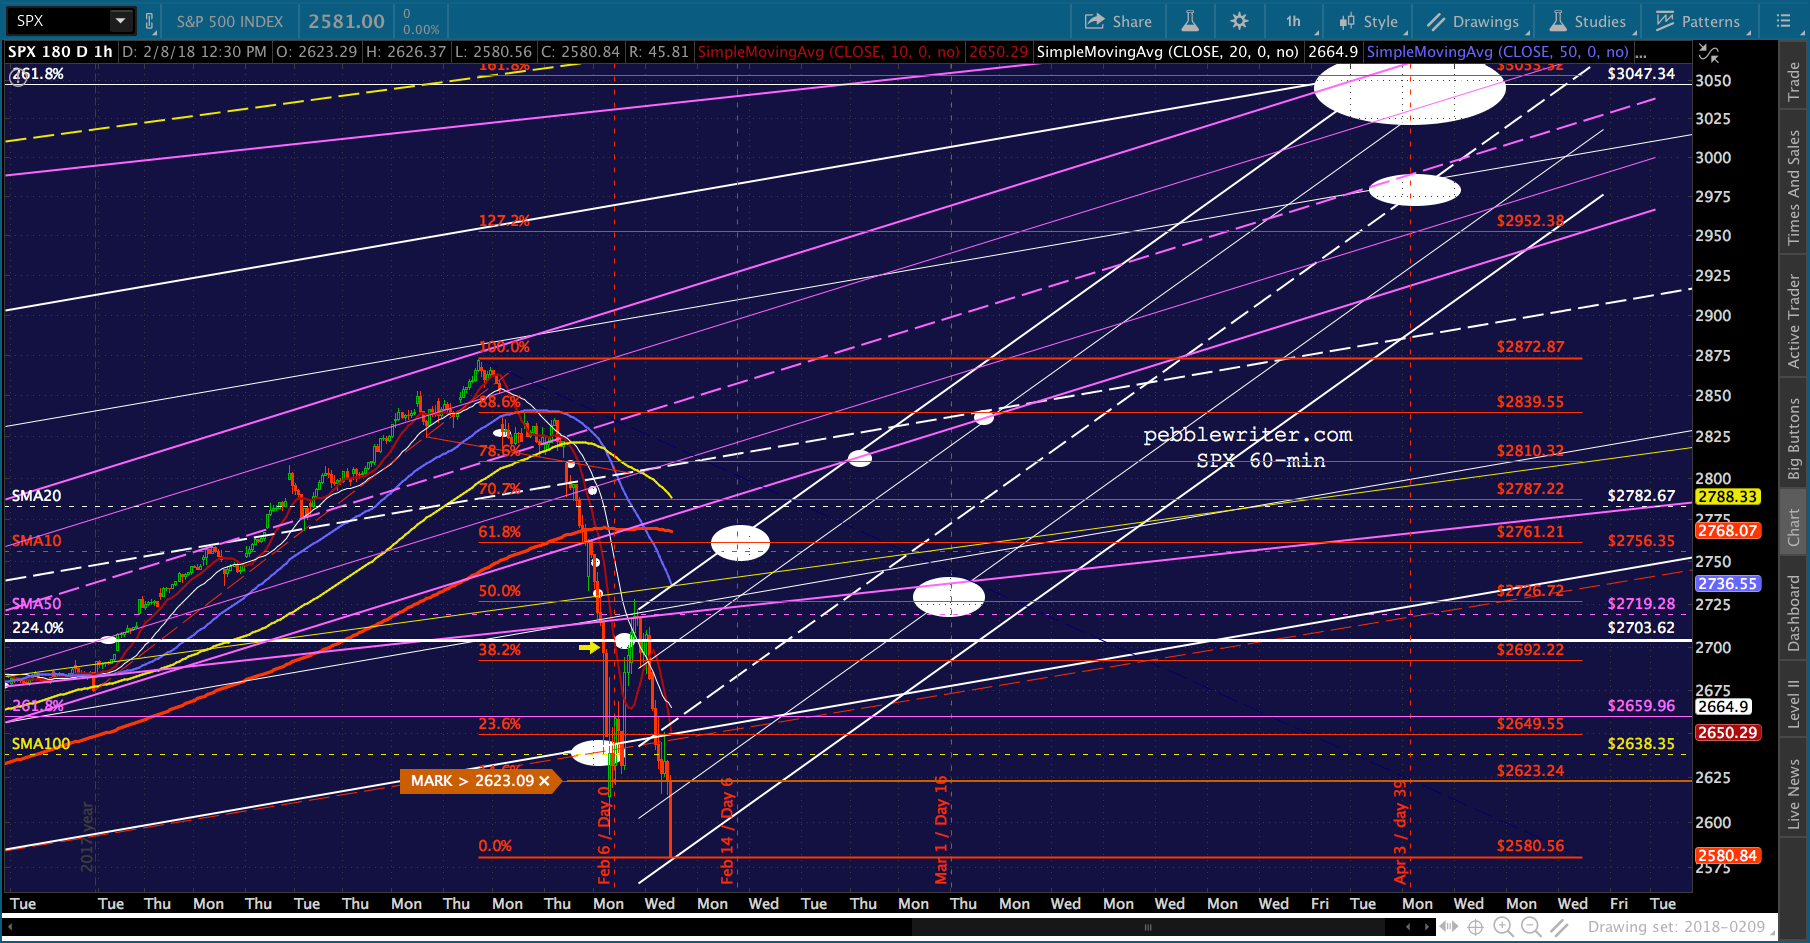
I need to break in real quick just to point out a turning point. SPX and ES are testing their SMA100s and VIX a channel .786 line and .500 Fib. This should be a good time to revert to long from yesterday’s channel top tag and to short VIX for what I believe will be a drop to 19.12 or as low as 14.5 by Feb 14.
As always, use stops. It’s 100 points down to the SMA200, which is the next lower level of major support.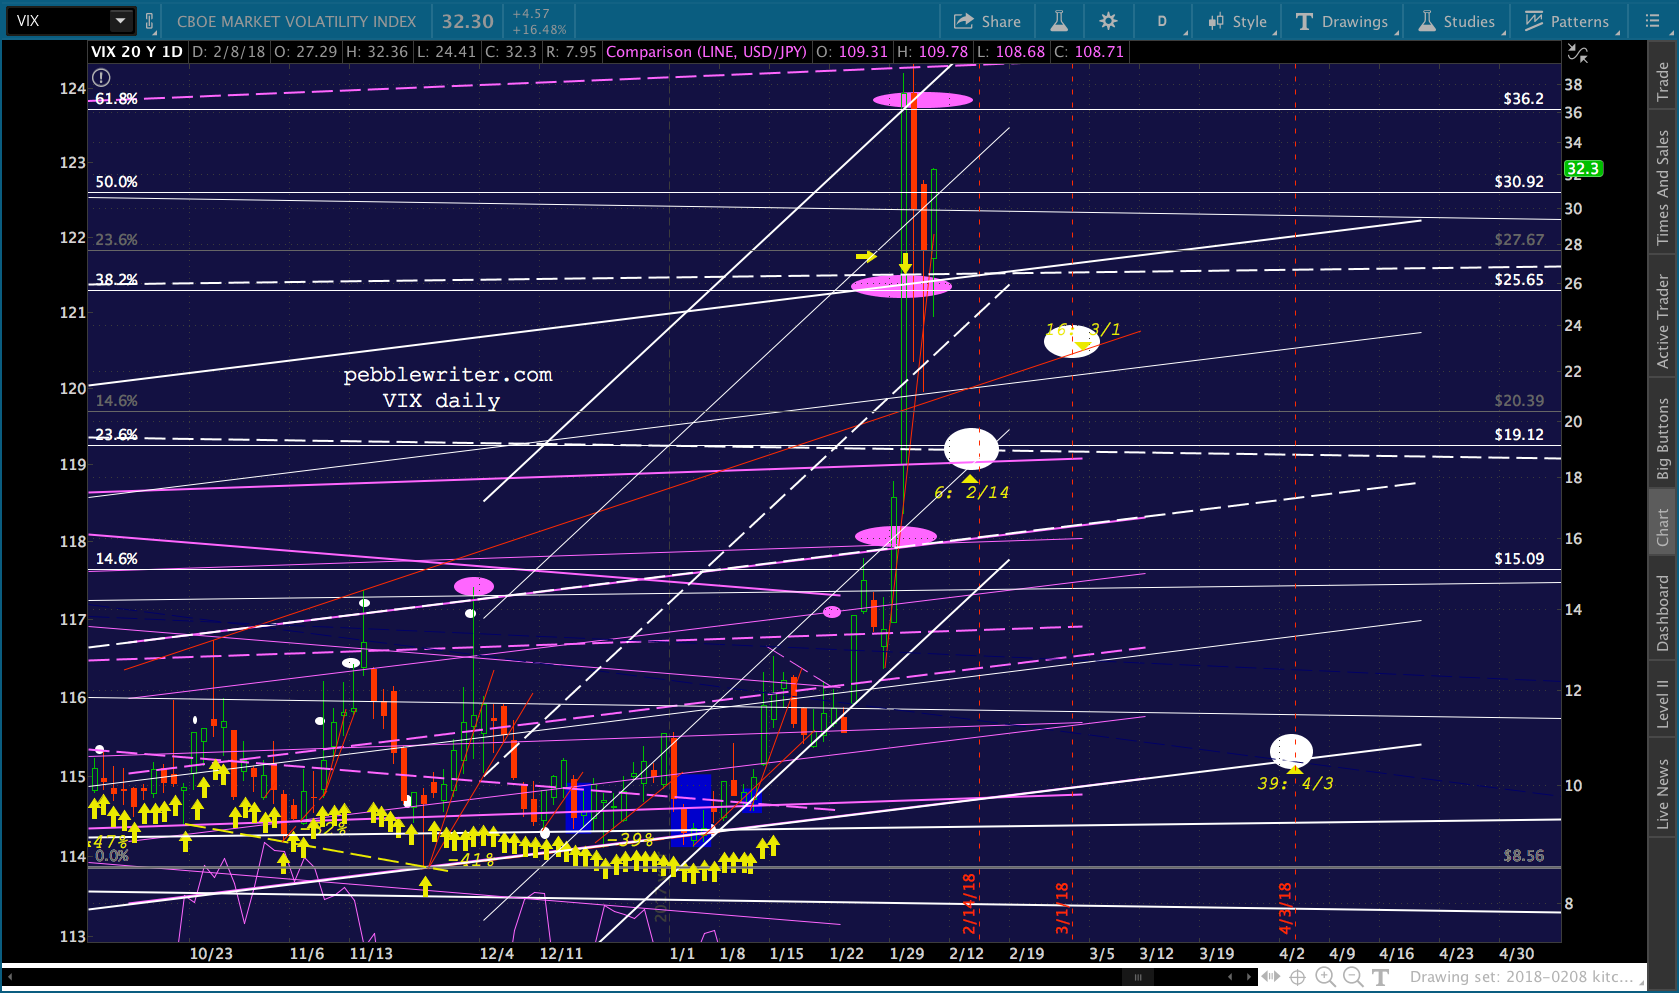
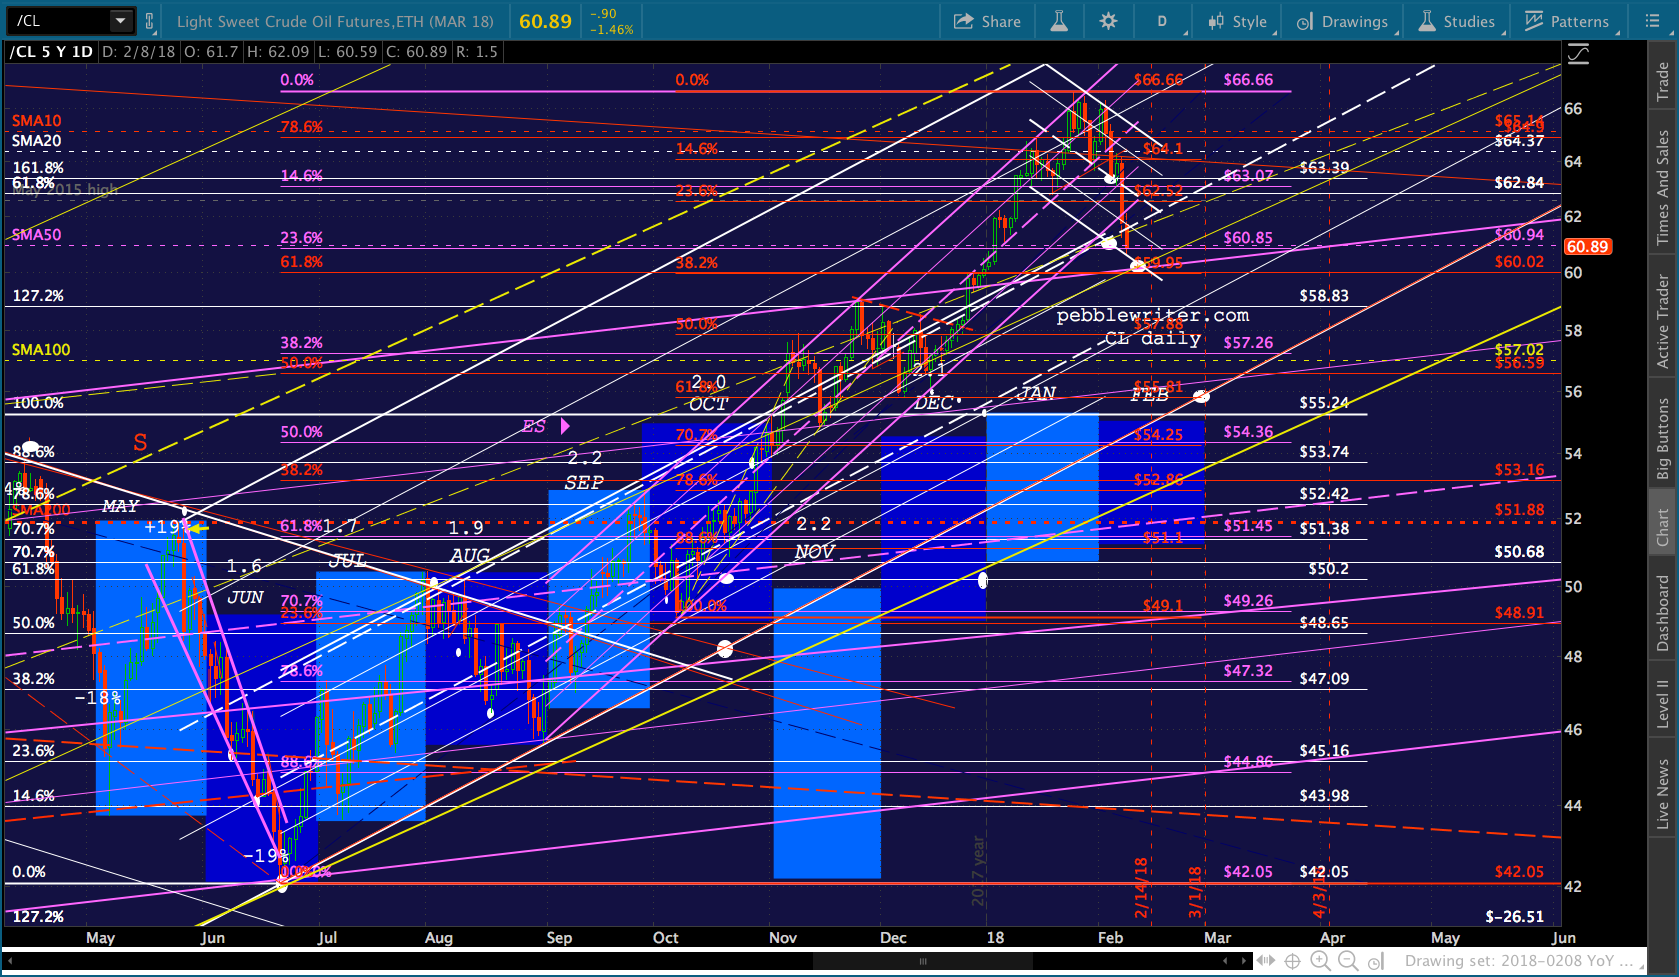
 Besides rising VIX, the problem seems to be RB, CL and USDJPY sliding. EURUSD should be close to bouncing, which means DXY should be able to decline, meaning RB and CL should be ready to bounce. Note that they’re both very close to our next downside targets.
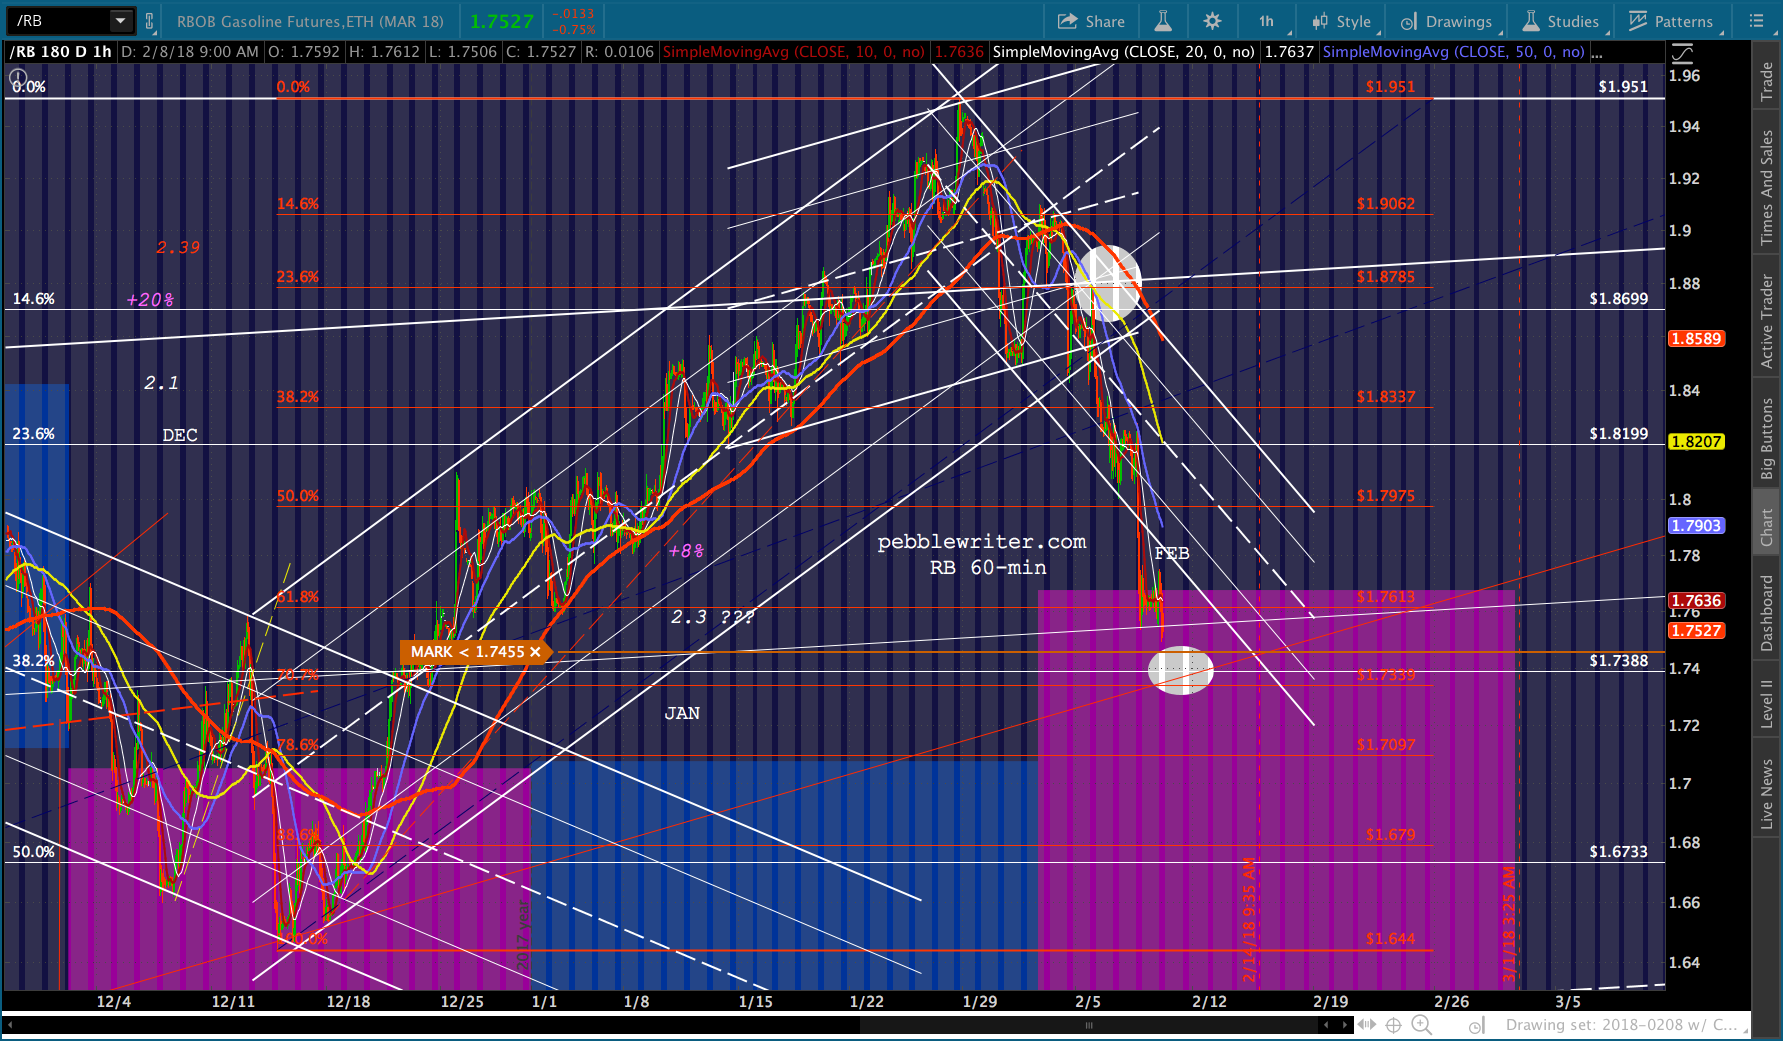
 Update: EOD
Dropped right through the SMA100, so it’s on to the SMA200 at 2537ish.
Comments
6 responses to “Analog Details: Feb 7, 2018”
PW, do you take the consideration of rate hike (or no hike) scenario in March while working on the current analog?
I doubt the new Fed chair wants to take a big risk when the “market” condition is unstable. He could simply delay the rate hike.
Great point. Since rate hikes have been mostly bearish for the USD lately, it’ll be interesting to see where things stand going into that meeting. Since it’ll be Powell’s first press conference as chair, I imagine it’ll be fairly dovish. Coming three weeks before our analog peak, this fits nicely.
With such a strong parabolic move up, it’s hard to believe we can go break to new highs by April, although I’m open to the idea. This move was similar to 1929 from Sept to the first week in Oct. There was heavy selling and margin calls after the markets dropped 13% from the ATH. Then the markets rallied hard 10% for a week before the crash the following week. I believe the bull party is almost over.
Am enjoying your forward play excitement Michael.
Am also enjoying the thought of an imagined sweating going on in the SNB with their share portfolio .
john h
PW, possible typo due to 18 hours work day:
please replace “2047” with “3047” and replace “2948-2045” with “2948-3045”
Thank you!
Thanks! I’m going to go with that excuse, though my wife would say it’s plain old senility.