

I saw an interesting interview on CNBC this morning where the guest observed how important overnight trading was to the market’s overall performance. Andrew Ross Sorkin offered data that if one bought the S&P 500 at the close of each day of trading and sold at the next morning’s open, they would be up 650% since 1993. If, instead, they bought at the open and sold at the close, they would be down 3%.
This observation won’t surprise any of our members, who are well-versed in the market’s increasingly endemic ramp jobs over the past 12 years. So far so good. The problem with the interview came when a rationale for the effect was offered: one should be compensated for taking overnight risk. Mike Santoli then chipped in, adding another explanation: more news happens outside of market hours than during. Ugh. And, it was going so well…
Let’s be clear about one thing: markets are manipulated, and it’s almost always intentional. Sometimes it’s quite obvious and effective, such as the announcement of a enormous new round of QE on March 23. This particular one was ridiculously obvious, as it came at 8am on the day the Dow would complete a 38% crash to test its Nov 9, 2016 lows (the day after the presidential election.)
 The rest of the time, it’s done so discretely that most observers are unaware of the actual machinations. We discuss the whys and wherefores every single day, as understanding the motives and means provides an excellent road map for our forecasts.
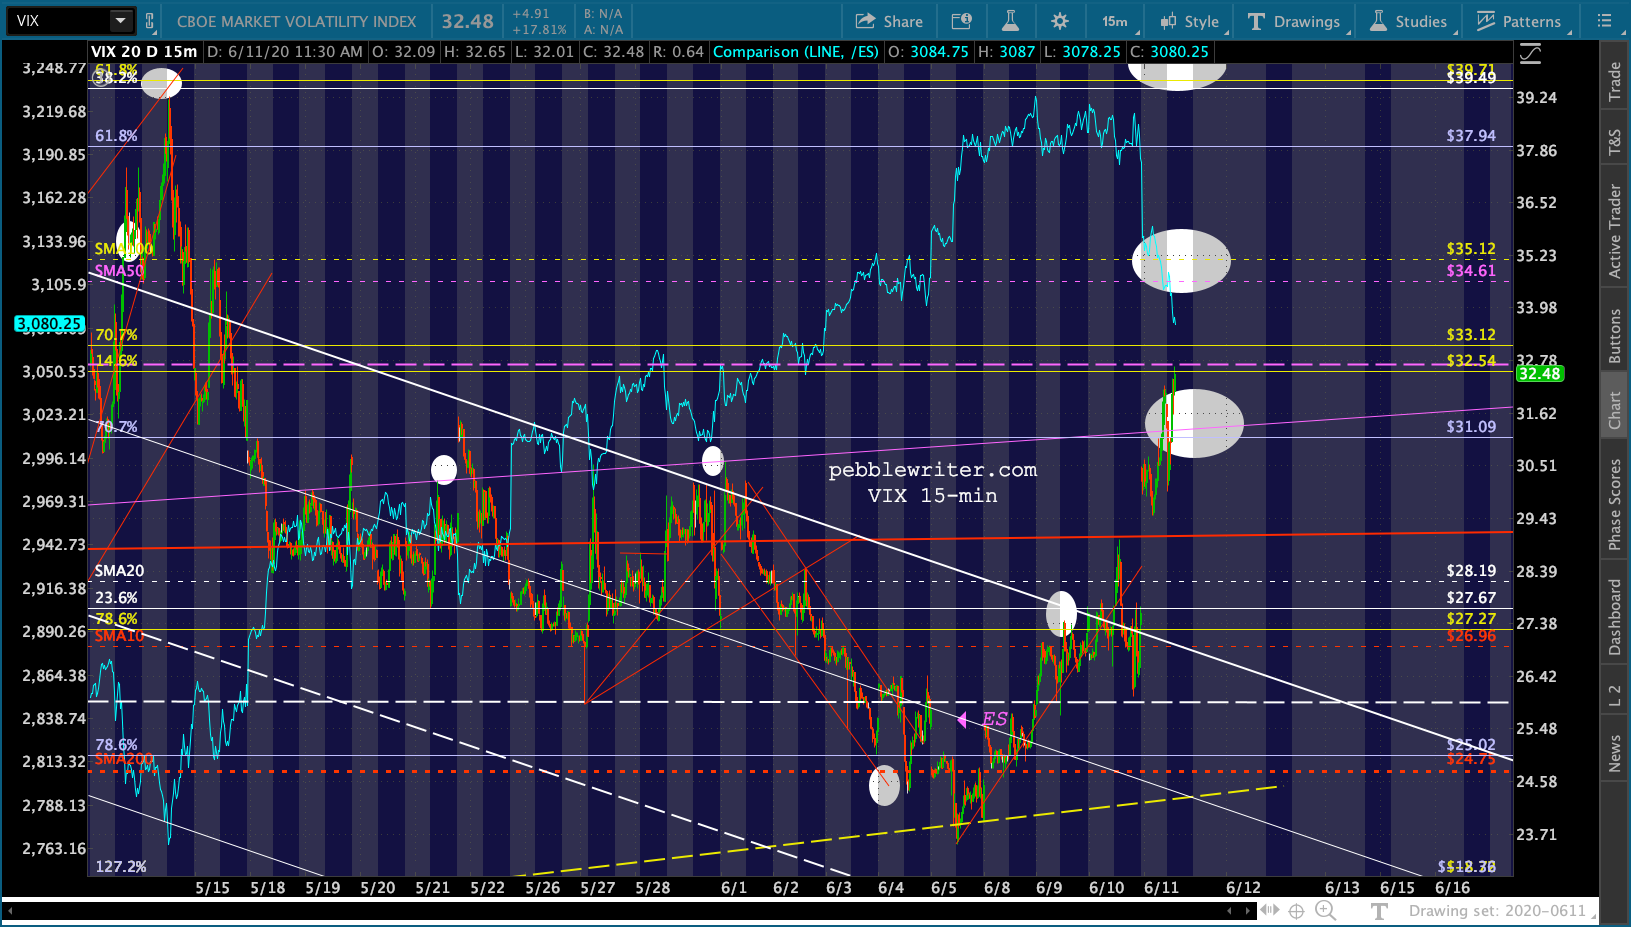
A great example is our VIX chart, which has exhibited an orderly collapse since it reached our Fibonacci .886 target at 80.3 on March 16. The declines most often come in the after-hours, before the cash market opens. This prompts the algos to buy futures, which results in a gap higher on the open as the rest of the machines kick into gear (index funds, ETFs, quants, etc.) The fundamental crowd, which accounts for only 10% of volume, brings up the rear.
It’s notable then that after bouncing at its 200-DMA and a trend line off its 2018 lows, VIX finally departed from this channel (the yellow arrow above) last night.
This allowed our favored scenario to play out as described yesterday.
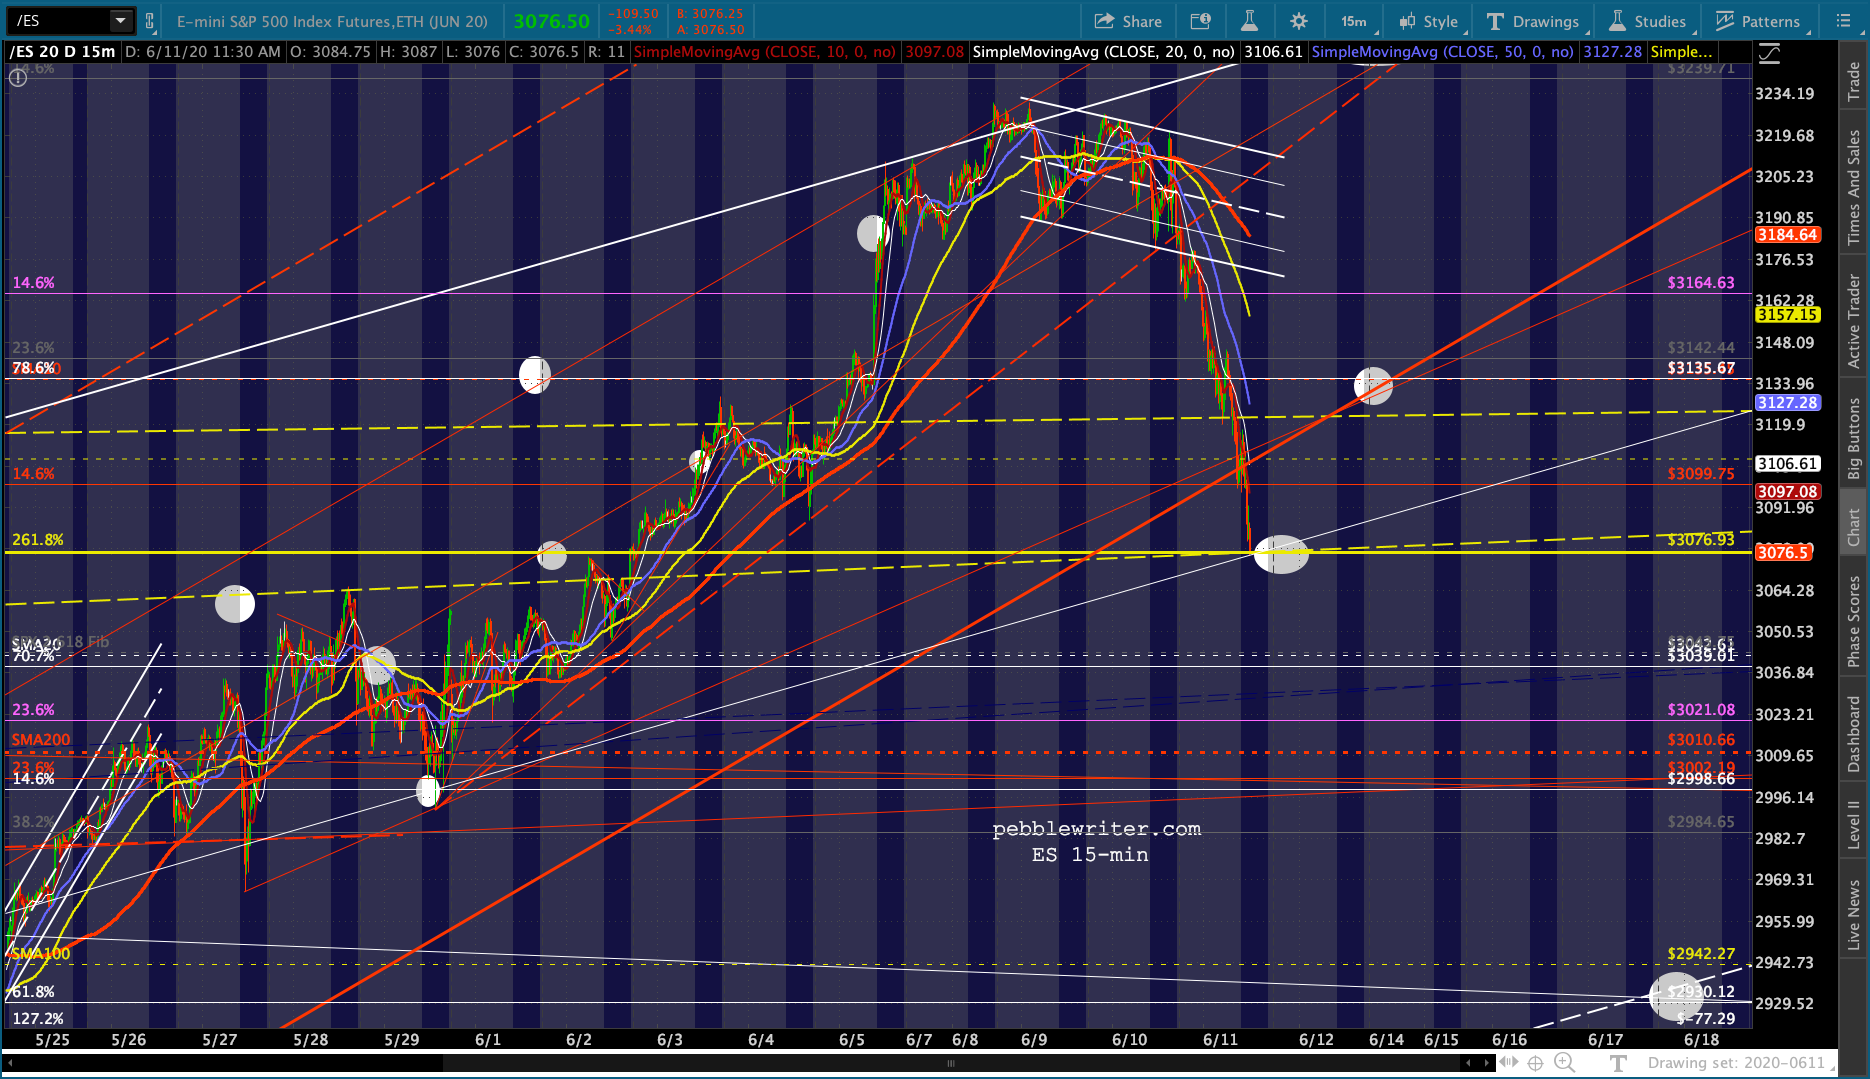
I’m leaning toward a correction beginning today, but am unsure whether the channel bottoms at ES 3076 and 3122-3135 will hold or not. It depends a great deal on what Powell says later today.
Bottom line, Powell’s comments weren’t terribly uplifting as he essentially confirmed that a rebound is not just around the corner. The problem is the fallout from the coronavirus – which the rest of the world is beginning to understand has not gone away — not even with the Fed’s best efforts.
As to the markets… so far, so good. The key, of course, will be what happens if/when it reaches the 2.618 Fib extension at 3076.93.
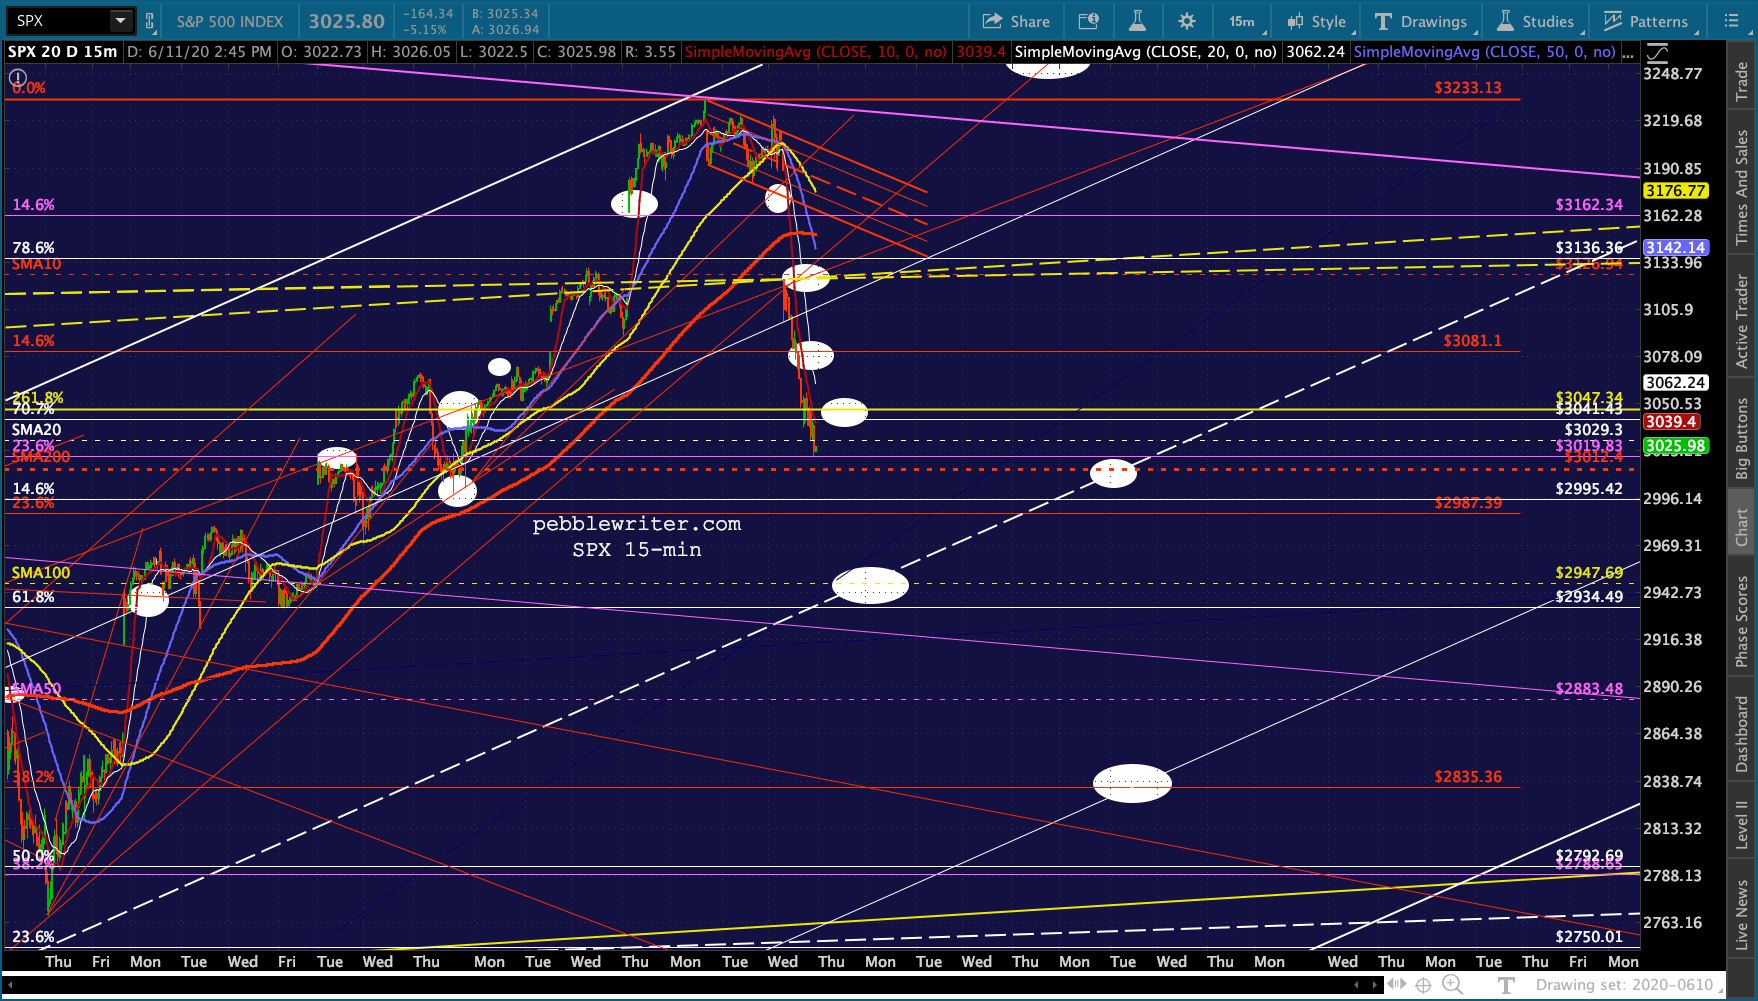
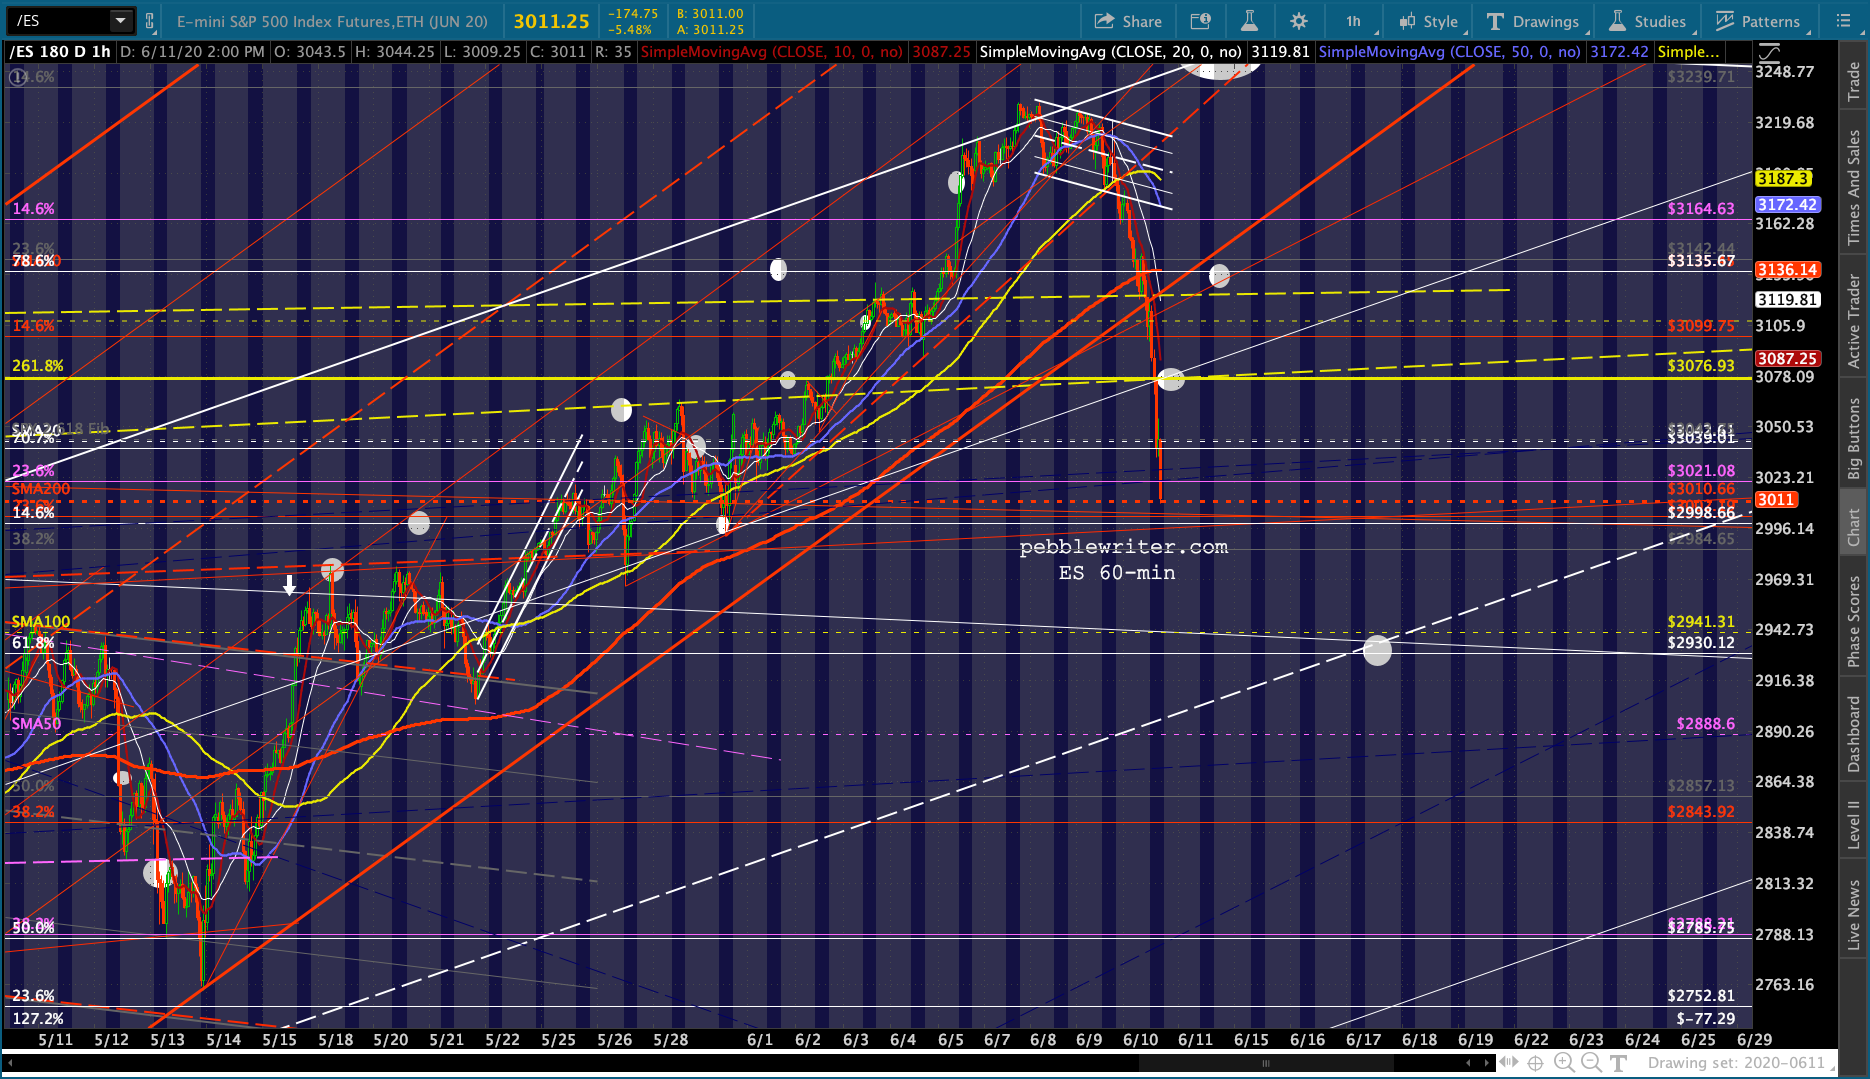
 continued for members…The bigger picture for ES and SPX shows not only their 2.618s ripe for a backtest, but the yellow TLs connecting the 2018-2019 high as well.
 While ES’ TL is at 3123ish…
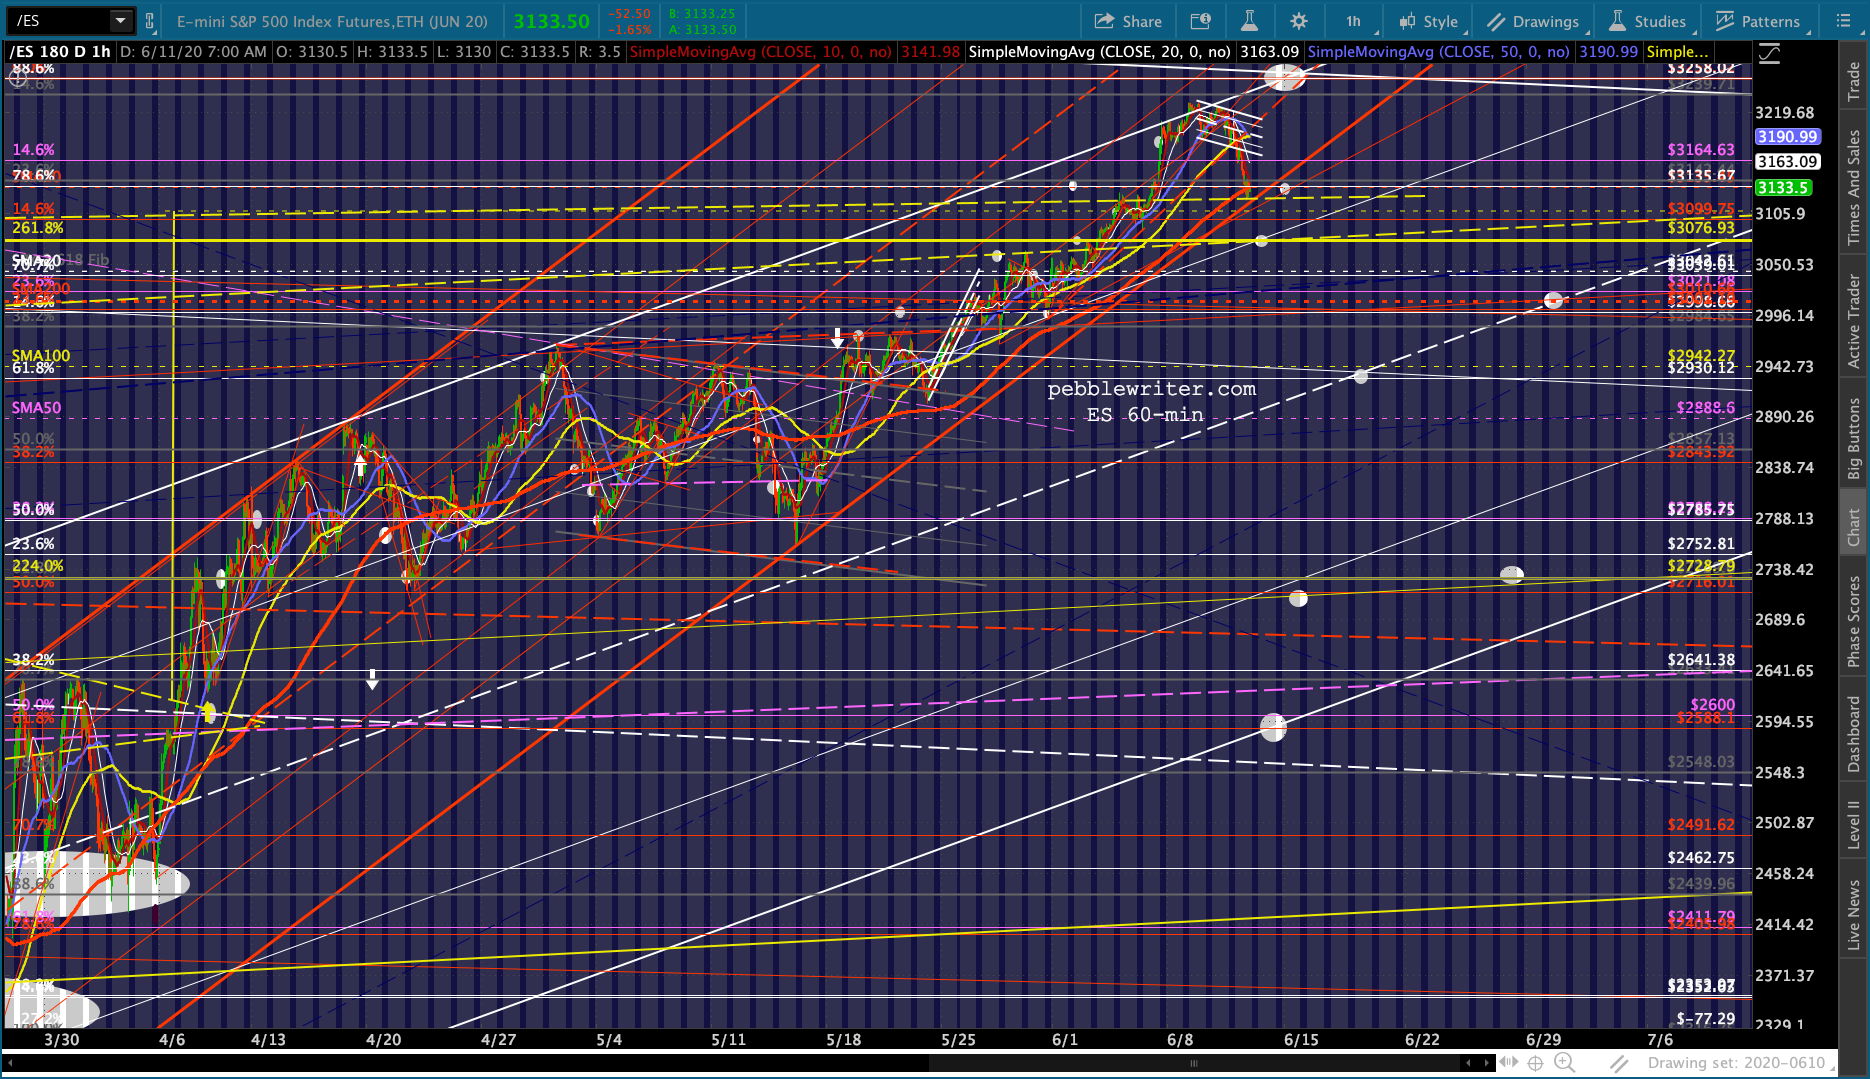 …SPX’s is at about 3125. Remember, SPX’s IH&S target is at 3093.54 (ES 3108), meaning it could get backtested as well. Its 2.618 is well below ES’ at 3047.34.
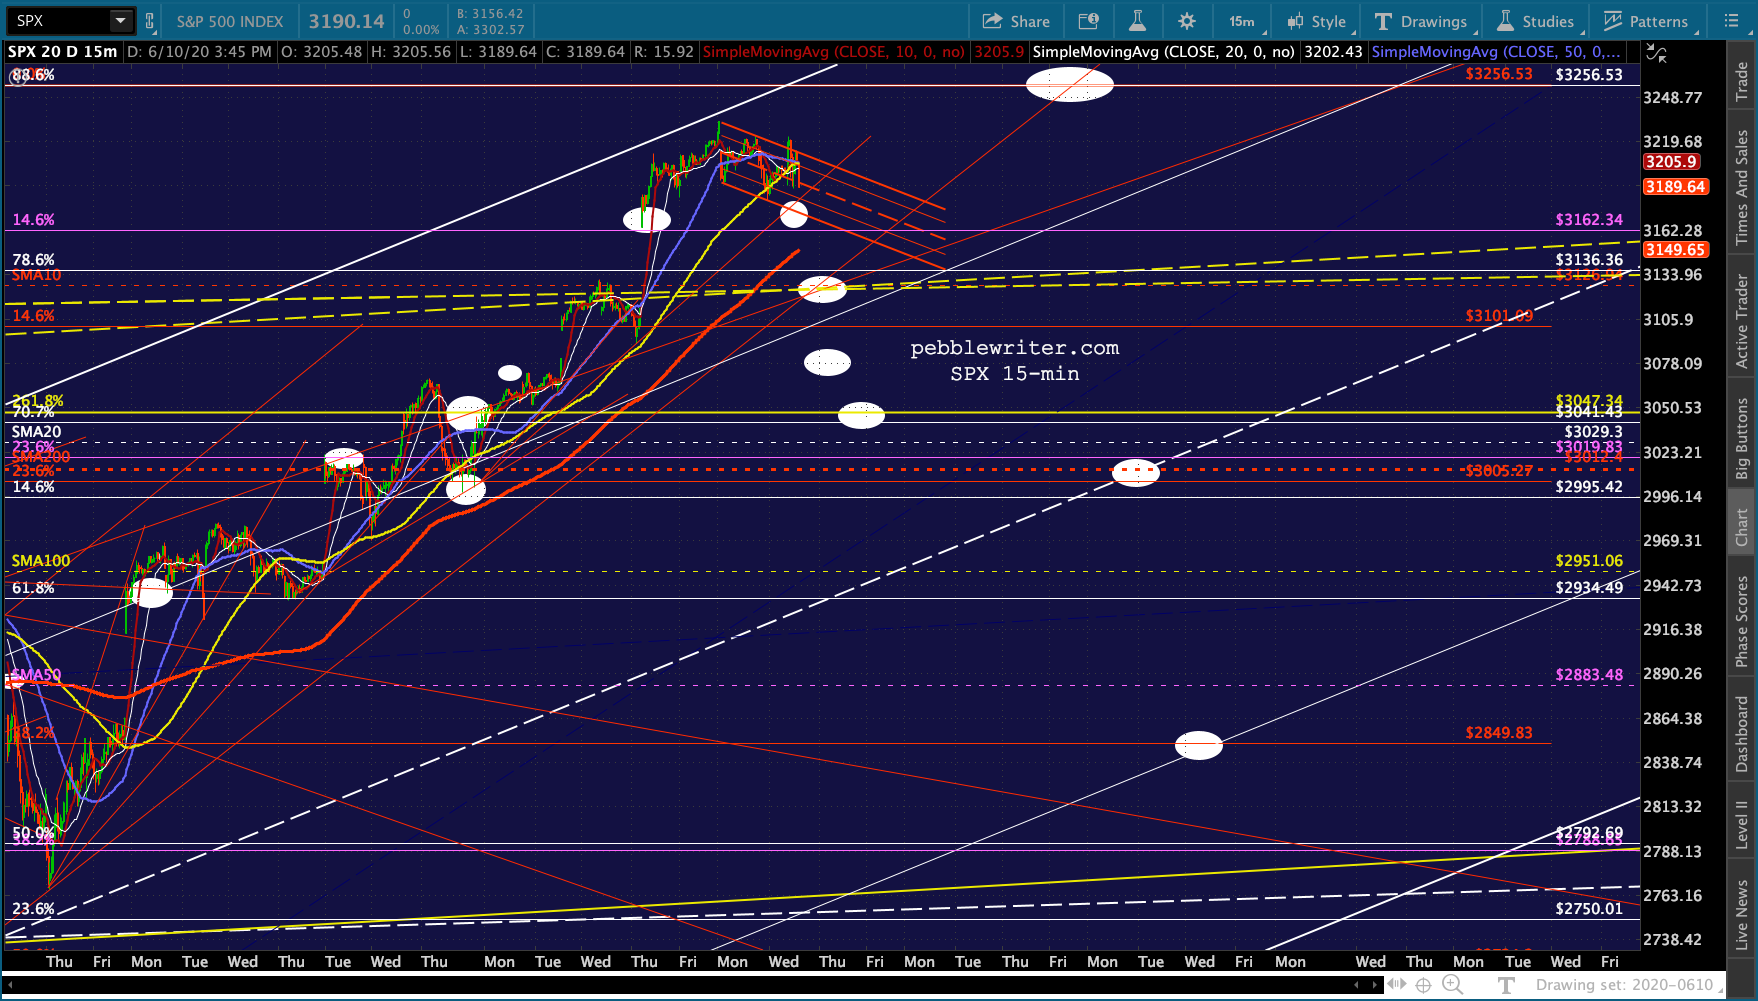
At the end of the day, the most important criteria is whether or not ES’ red channel breaks down. Its bottom is at 3100ish, so a bounce at 3076 back up to 3100, for instance, would leave it in limbo.
If we look carefully, we can see VIX has potential overhead resistance at 32.70ish – the purple channel midline and rising purple TL. 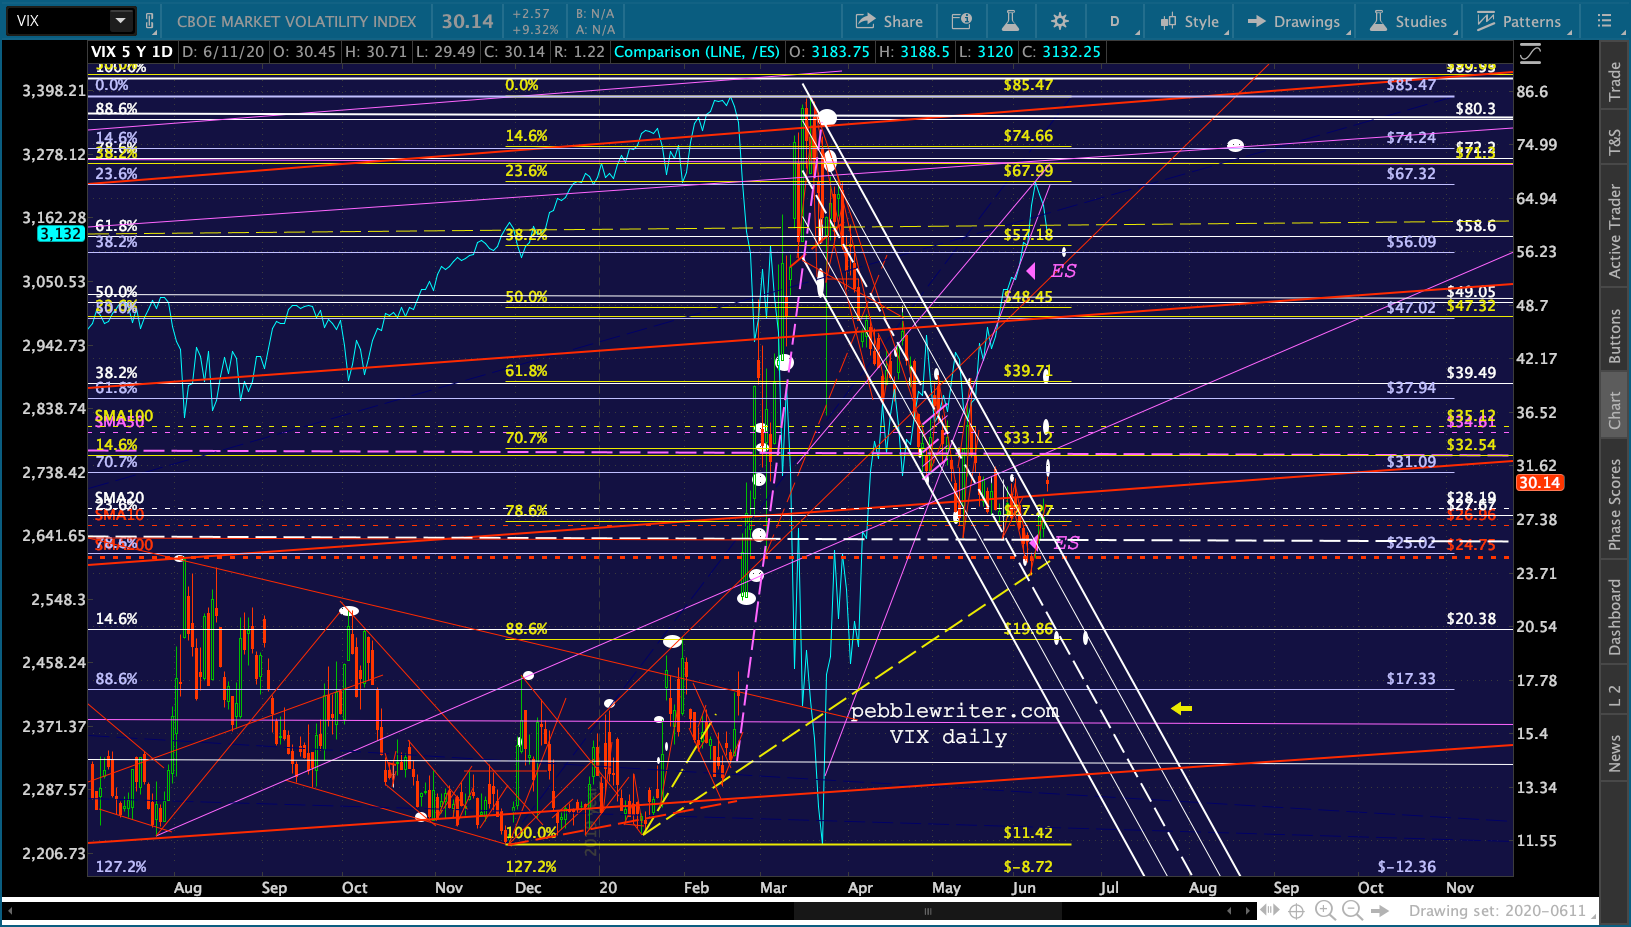 I know these charts are messy, but take my word for it. It’s there.
 BTW, this doesn’t mean a backtest of the yellow trend line, SMA200 and .886 is out of the question. We still have the Q2 and OPEX hurdles to get past. A backtest of the falling white channel could come toward the end of the month.
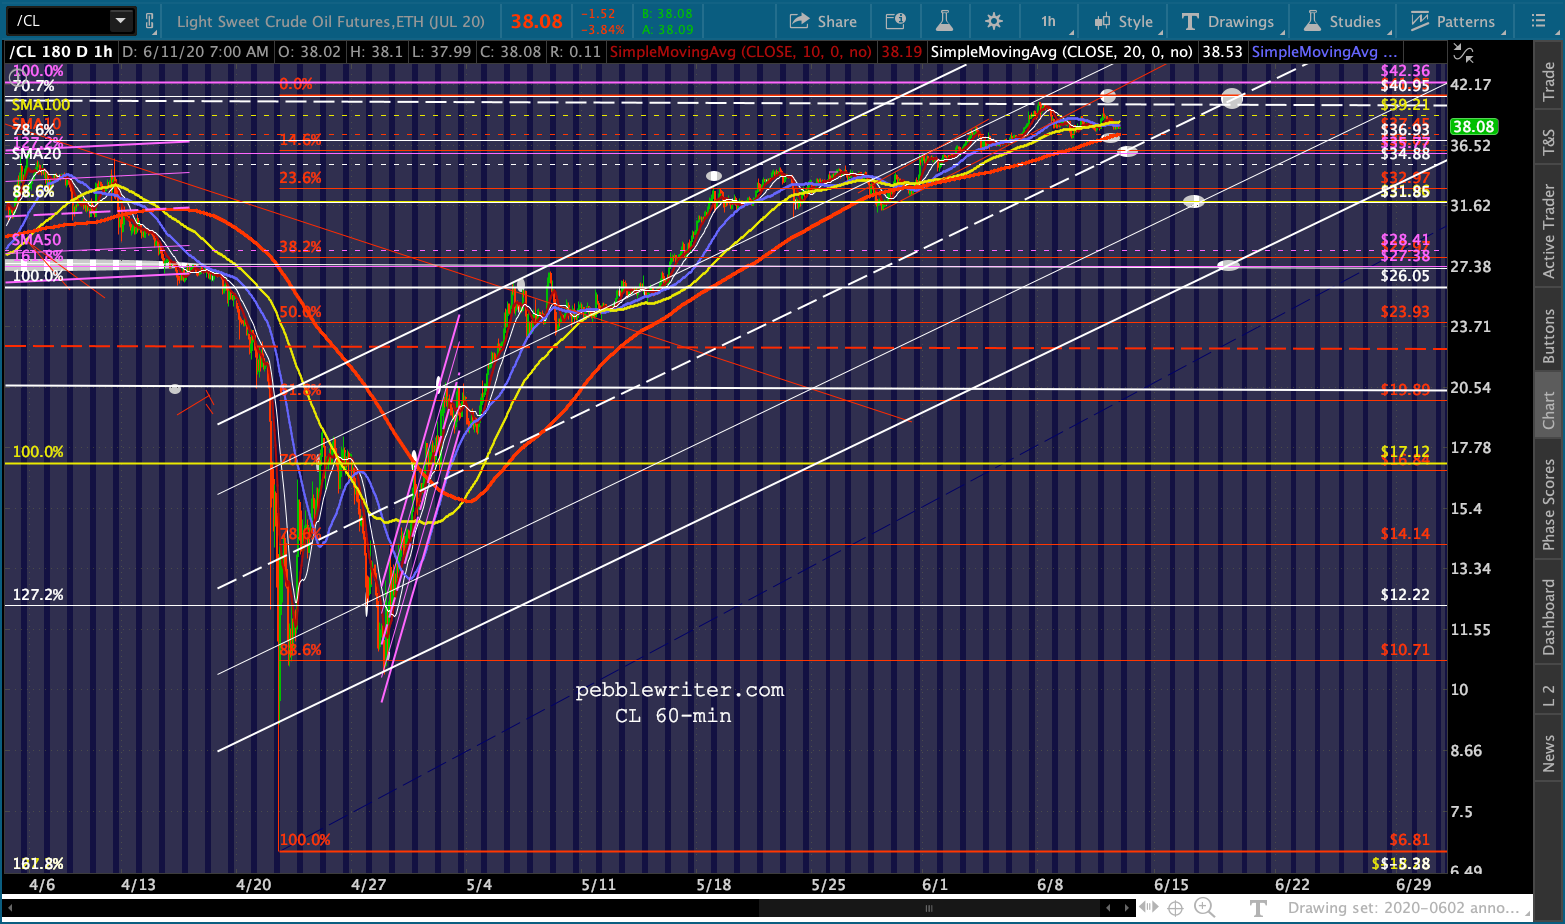
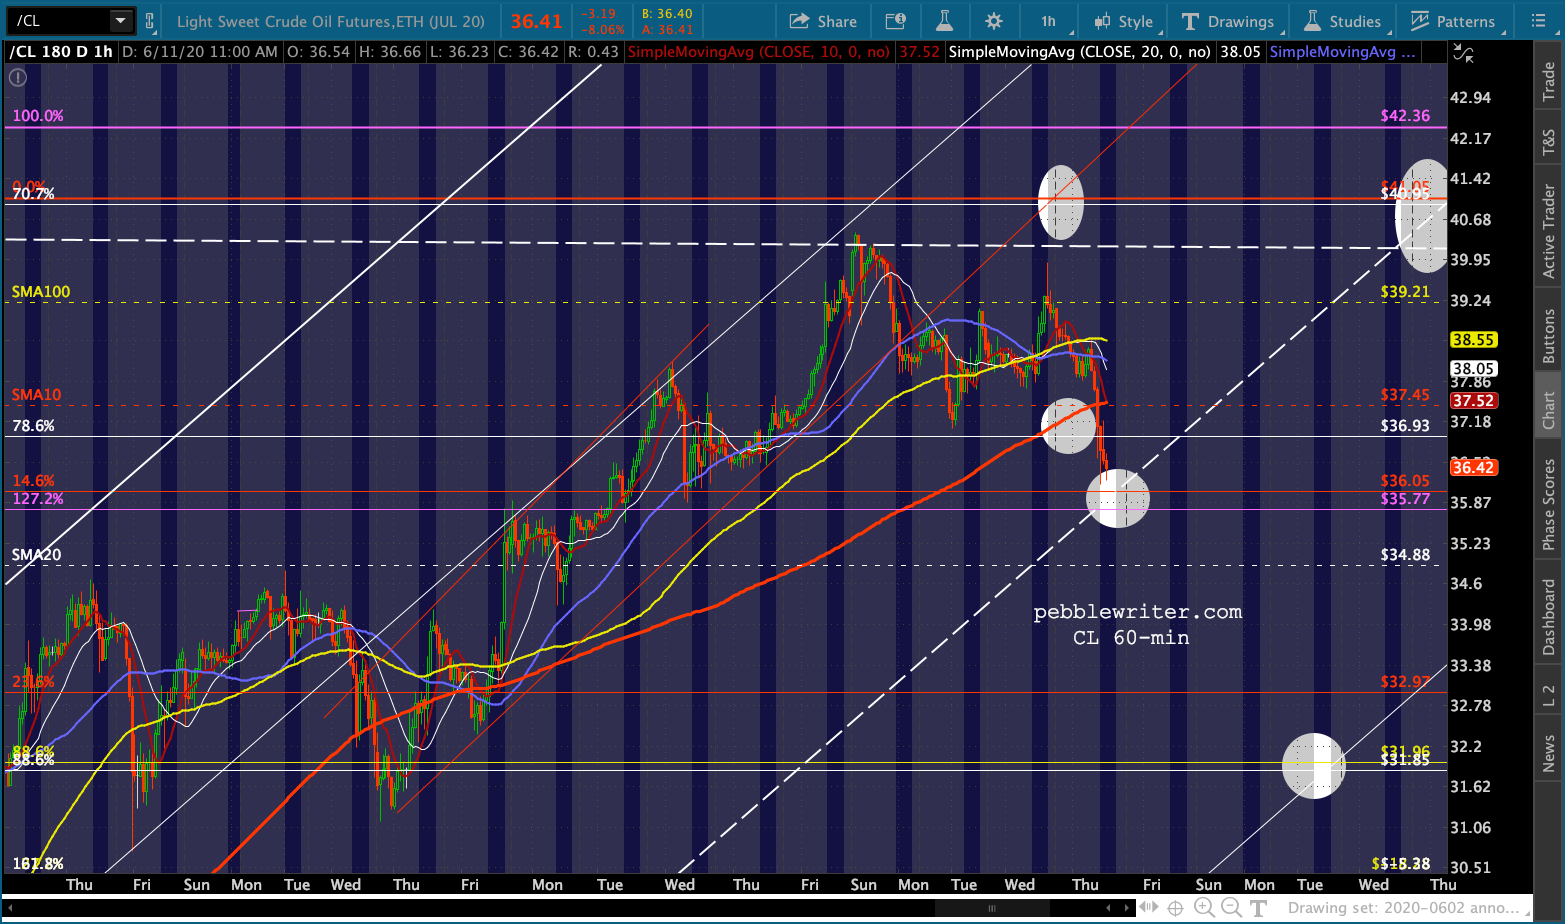
Likewise, we could still see CL take one more stab at our 41.05 gap target. It reached 40.44 on Sunday – close enough for shorting purposes, but the gap didn’t get closed.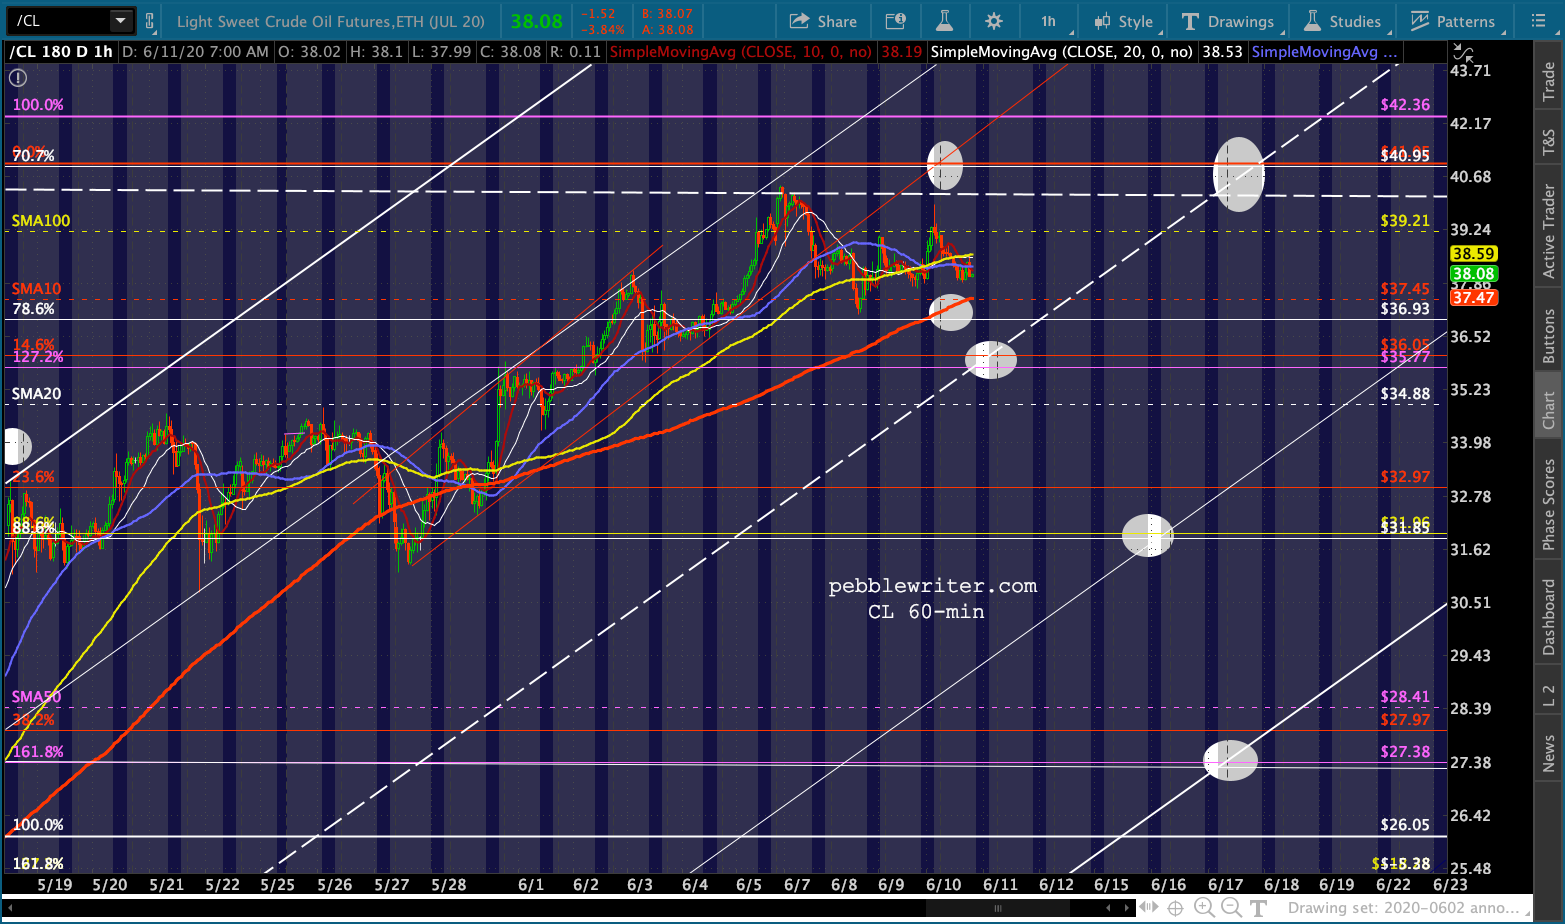
 I don’t expect new highs for RB.
  On the currency front, USDJPY has dropped through our 107 target and is trying to decide whether to honor the falling white channel midline at 106.79.

 This has hastened NKD’s demise and confirmed the reversal at its .886.
 But the dollar weakness it connotes is being offset by the EURUSD’s failure to break any higher.

 TNX has tested the purple channel bottom – as expected, the result of a fear trade.
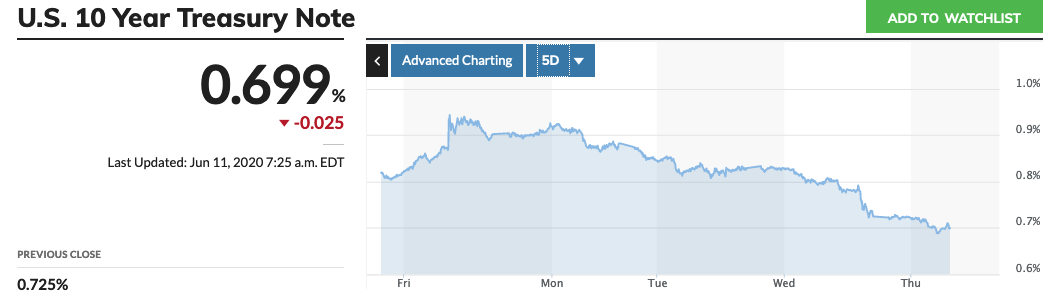 The 2Y, after backtesting 0.22 yesterday, dipped as low as .15 this morning but has bounced back.
 This means more contraction for the 2s10s.
  The yellow TL has broken down, and the white TL is in danger of breaking down.
 Remember, while breakdowns are not as dangerous for stocks as breakouts, they’re still a bearish signal.
UPDATE: 11:41 AM
There’s the official tag. Moment of truth… If ES can’t hold 3076.93, then we start looking for SPX 3047.34.


 UPDATE: 12:42 PM
SPX just came within 1.07 of our next downside target, its 2.618 Fib extension.
 If it doesn’t hold, then we’re looking at SMA200s. ES is at 3010.20 and SPX is at 3012.40.
UPDATE: 2:50 PM
SPX and ES are getting rather close to their SMA200s. At this point, a rebound to the broken red channel looks unlikely. Instead, a drop to the white midline appears to be in the works. But, we’ll take a closer look after the close.
 UPDATE: 2:57 PM
Tags on both. The bulls better hope they get a bounce here. It ought to, even if it’s just for ES or SPX to backtest their 2.618.
But, the more I look at it, the more I like SPX’s white channel midline at 2934-2950 where it intersects with the SMA100 and white .618. Referencing the daily SPX chart above, this would also be the .786 line of the new falling purple channel. Tomorrow would work just fine.
Remember, the 7% circuit breaker can kick in up till 3:25PM. This would equal 2958.79. After 3:25, no circuit breakers.

 BTW, I have a conference call coming up in a few minutes. This will likely be my last post until after the close.
GLTA.