

Inflation drives interest rates. Though the Fed probably wishes it didn’t, it’s an inconvenient truth. There are much tighter correlations, but consider the strong positive correlation between CPI and 10Y notes.
 This matters, of course, because with $22 trillion in debt, the US faces the same problem as the ECB and Japan: High interest rates on rising debt levels (the blue bars below) would lead to insolvency. The slight increase in average interest rates (the black line) between 2018 and 2019, for instance, sent interest expense (the red line) soaring.
 There are only two ways to keep interest expense from consuming untenable slices of the budget: cut back on spending or bring interest rates back down and keep them down. Since the government isn’t likely to cut spending any time soon, this means focusing on interest rates.
Japan and the ECB have coped with runaway debt by manipulating rates below zero — negative interest rates where you pay the government money to borrow from you. Though not there yet, the US is on the same path, seen most notably lately in the repo market through Not-QE.
The government plays lots of games with inflation. There are many different definitions, some of which include or exclude different expenses such as food, gas prices and rent. Although just as flawed as any, I like good old-fashioned CPI as it includes food and gas prices — things that affect the budget of almost every American and is factored into many important calculations such as cost of living increases.
CPI can be influenced in some very predictable ways, some of which are subject to manipulation such as oil and gas prices. Without harping on geopolitical considerations [see: Coincidences and Consequences] all over again, it’s obvious that the Fed’s effort to keep interest rates low is dependent on keeping inflation under control which, in turn, is dependent on keeping the annual change in gas prices under control. How so?
CPI (which, remember, is a measure of the rate of change in prices) has averaged +1.74% through October 2019, while YoY changes in the price of gas have averaged -6.79%. Months such as January and February, when CPI registered 1.55% and 1.52%, corresponded with the largest YoY drops in gas prices: -13.05% and -10.65%. In April, the only positive YoY change in gas prices (+1.58%) produced the highest CPI measure of the year: 2.0%.
The chart below illustrates the relationship so far in 2019 which simple regression analysis reveals is:
CPI = (0.0263 x YoY change in gas prices) + 0.01918.
 In November, the rate of change in gas prices was only -3.16%. All else being equal, this suggests CPI will come in around 1.84% – a modest uptick. However, the first reading in December (unless gas prices fall) would indicate a 9.8% YoY increase in gas prices and a CPI reading of +2.18% or greater.
That, folks, is why the Fed is considering formal changes to the way it evaluates inflation as (not) detailed in the official gobbledygook offered last month. It also explains the various comments made by Fed officials – first suggesting that inflation should target a range rather than a specific level (i.e. 2.0%) and more recently suggesting that inflation should be allowed to “run hot.”
As the Financial Times reported:
The Federal Reserve is considering introducing a rule that would let inflation run above its 2 per cent target, a potentially significant shift in its interest rate policy.
The Fed’s year-long review of its monetary policy tools is due to conclude next year and, according to interviews with current and former policymakers, the central bank is considering a promise that when it misses its inflation target, it will then temporarily raise that target, to make up for lost inflation…
If the Fed adopts this so-called “make-up strategy”, it would mark the biggest shift in how it carries out its interest rate policy since it began to target 2 per cent inflation in 2012.
Most economists would probably suggest that the Fed has been working hard over the years to get inflation up to 2%. I strongly disagree and believe the Fed has used the constant shortfalls as the primary rationale for accommodative monetary policy – the purpose of which is to keep interest rates low and support equity prices.
This latest prevarication is intended to provide cover for the fact that oil and gas prices have been propped up in the lead up to the Aramco IPO. Now that the IPO is in the rear view, we’ll find out whether central banks can really stomach 2.2% CPI or gas prices are about to tumble a good 6-8%.
 If the past is any indication, the Fed won’t take a chance on CPI over 2.0% and we’ll see oil and gas prices drop substantially over the next couple of weeks. The White House wouldn’t complain, especially if it helps keep interest rates low.
If I’m wrong, and inflation heads back above 2% (remember, the next tariff is scheduled to arrive on Monday) then we face bigger problems in January (when December CPI is reported.) I’ll post oil and gas price targets below the break.
Meanwhile, it’s Tuesday and futures were off substantially overnight, so of course there’s news on the trade front – particularly in light of the impeachment goings on. S&P futures have spiked 25 points off their overnight lows, but have yet to break out of the falling white channel that leads to a 3.5% correction.
 continued for members…The bigger picture shows things lining up nicely for a Dec 16 drop to SPX 3047. SPX closed at the bottom of the rejoined red channel. But, note that the 1.272 extension of the red grid points to 3048 – right on top of the 2.618 at 3047.34. The C=A target lines up at 3044.
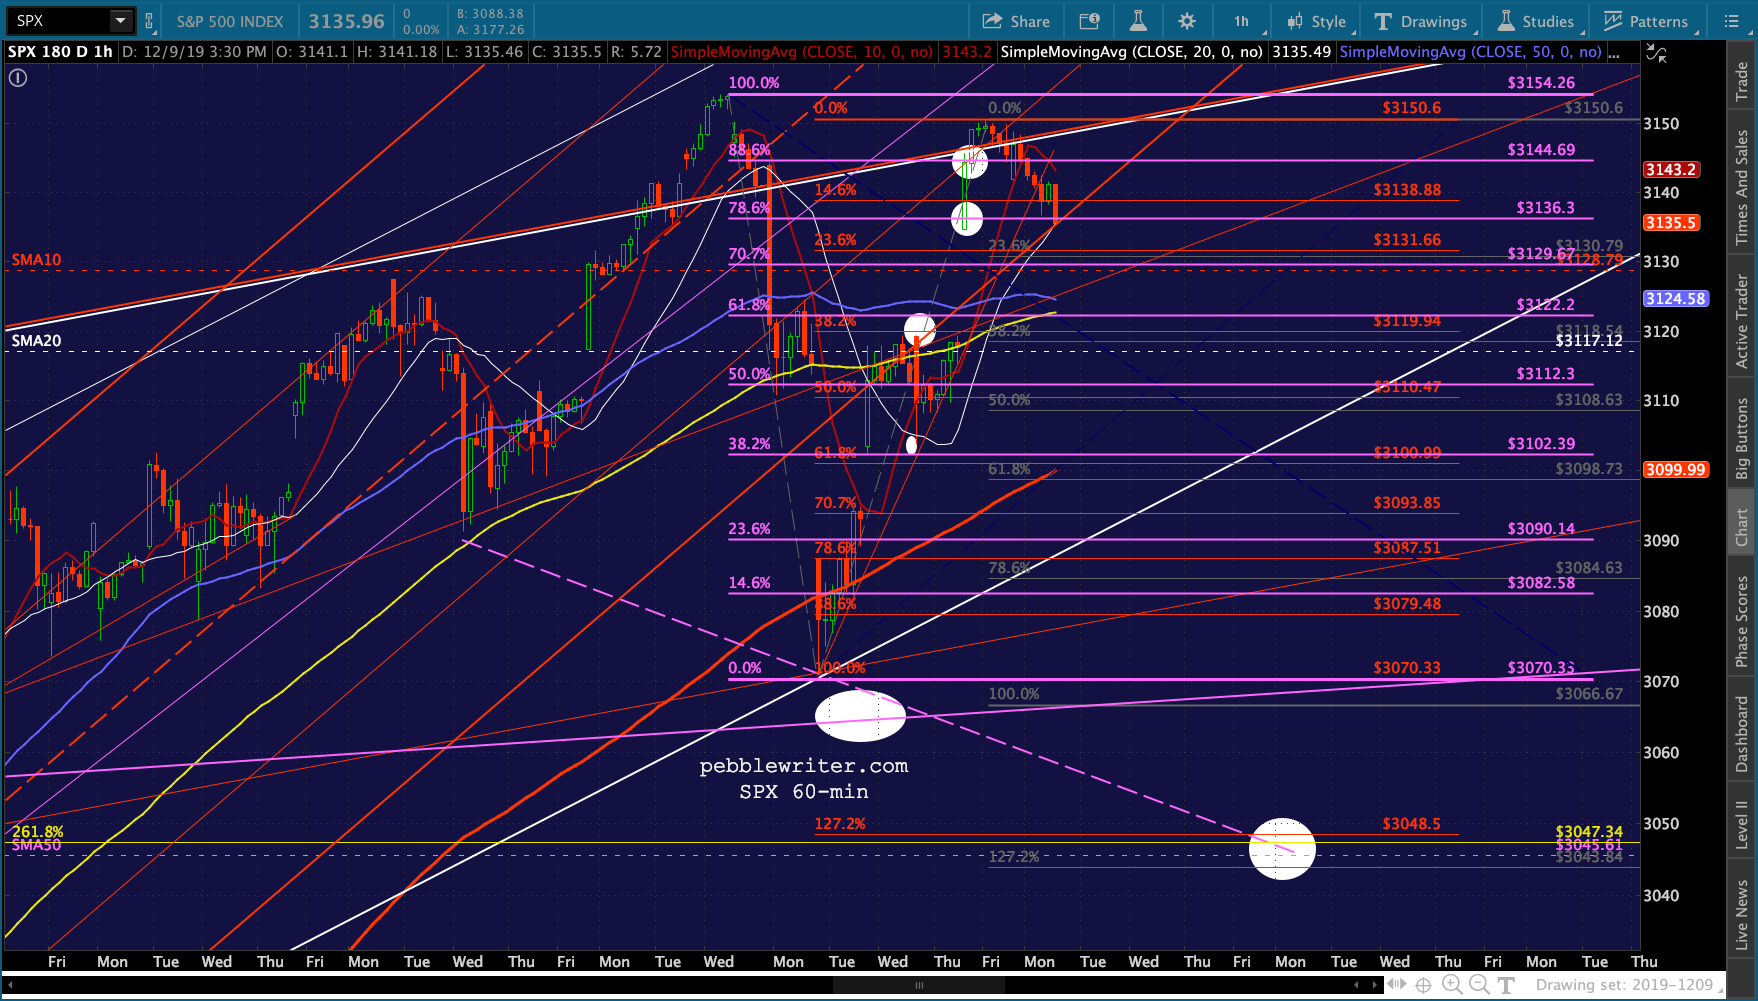 The same pattern is in place for ES – a good argument for SPX 3047.
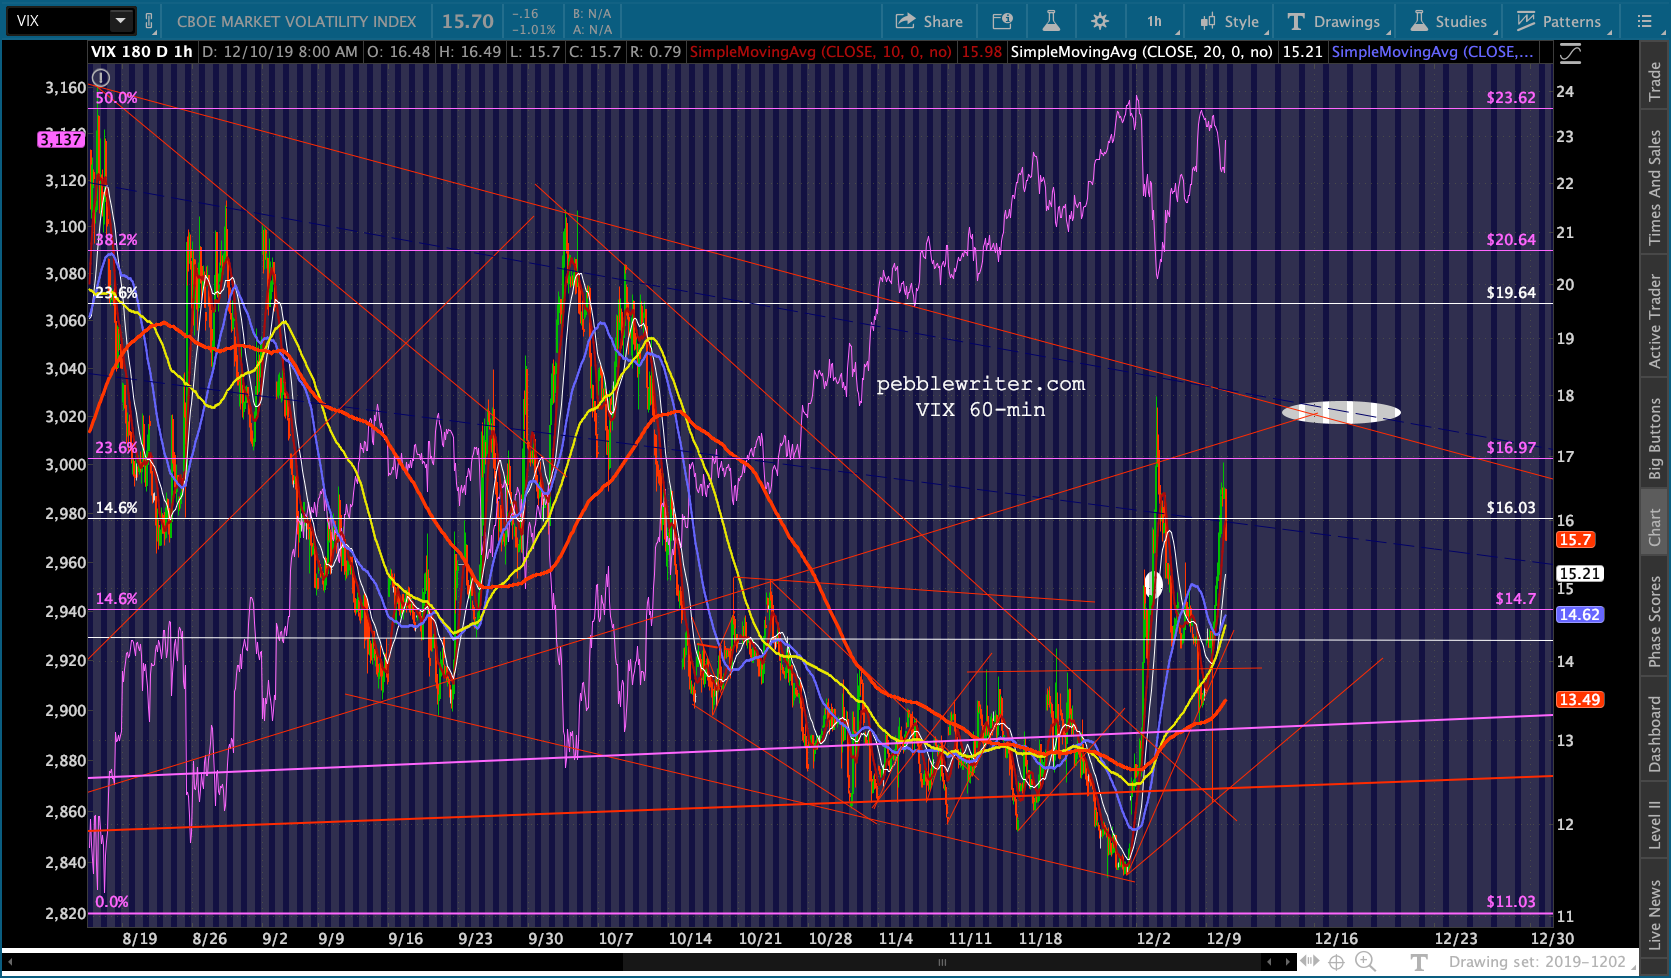
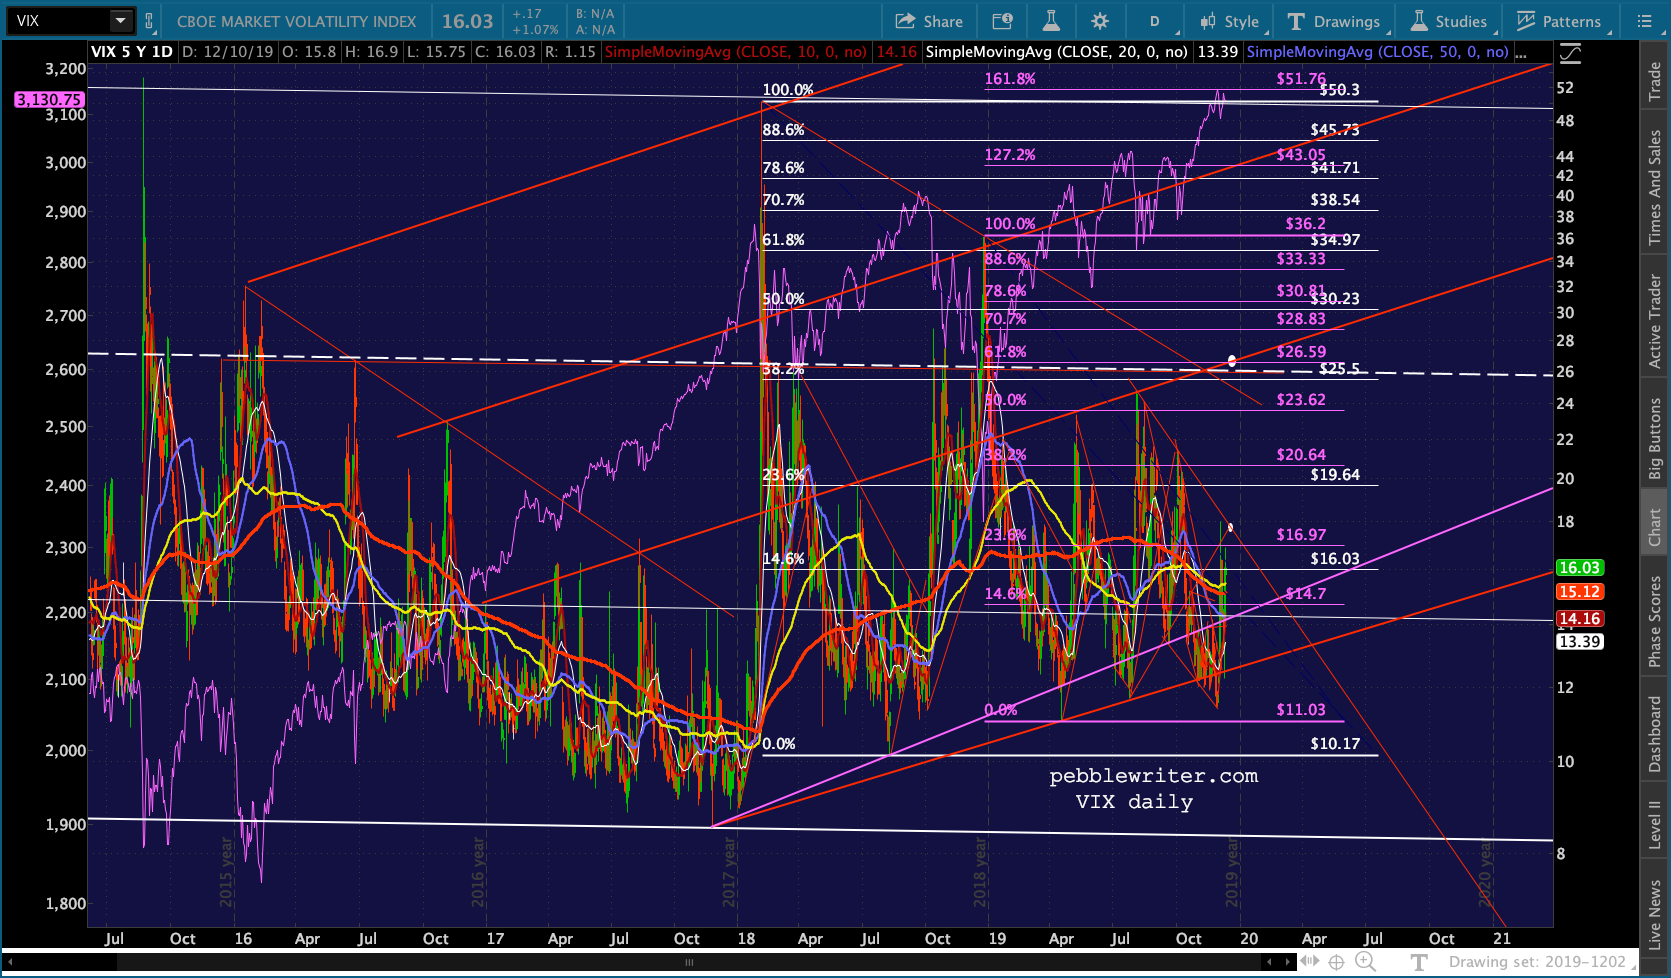
 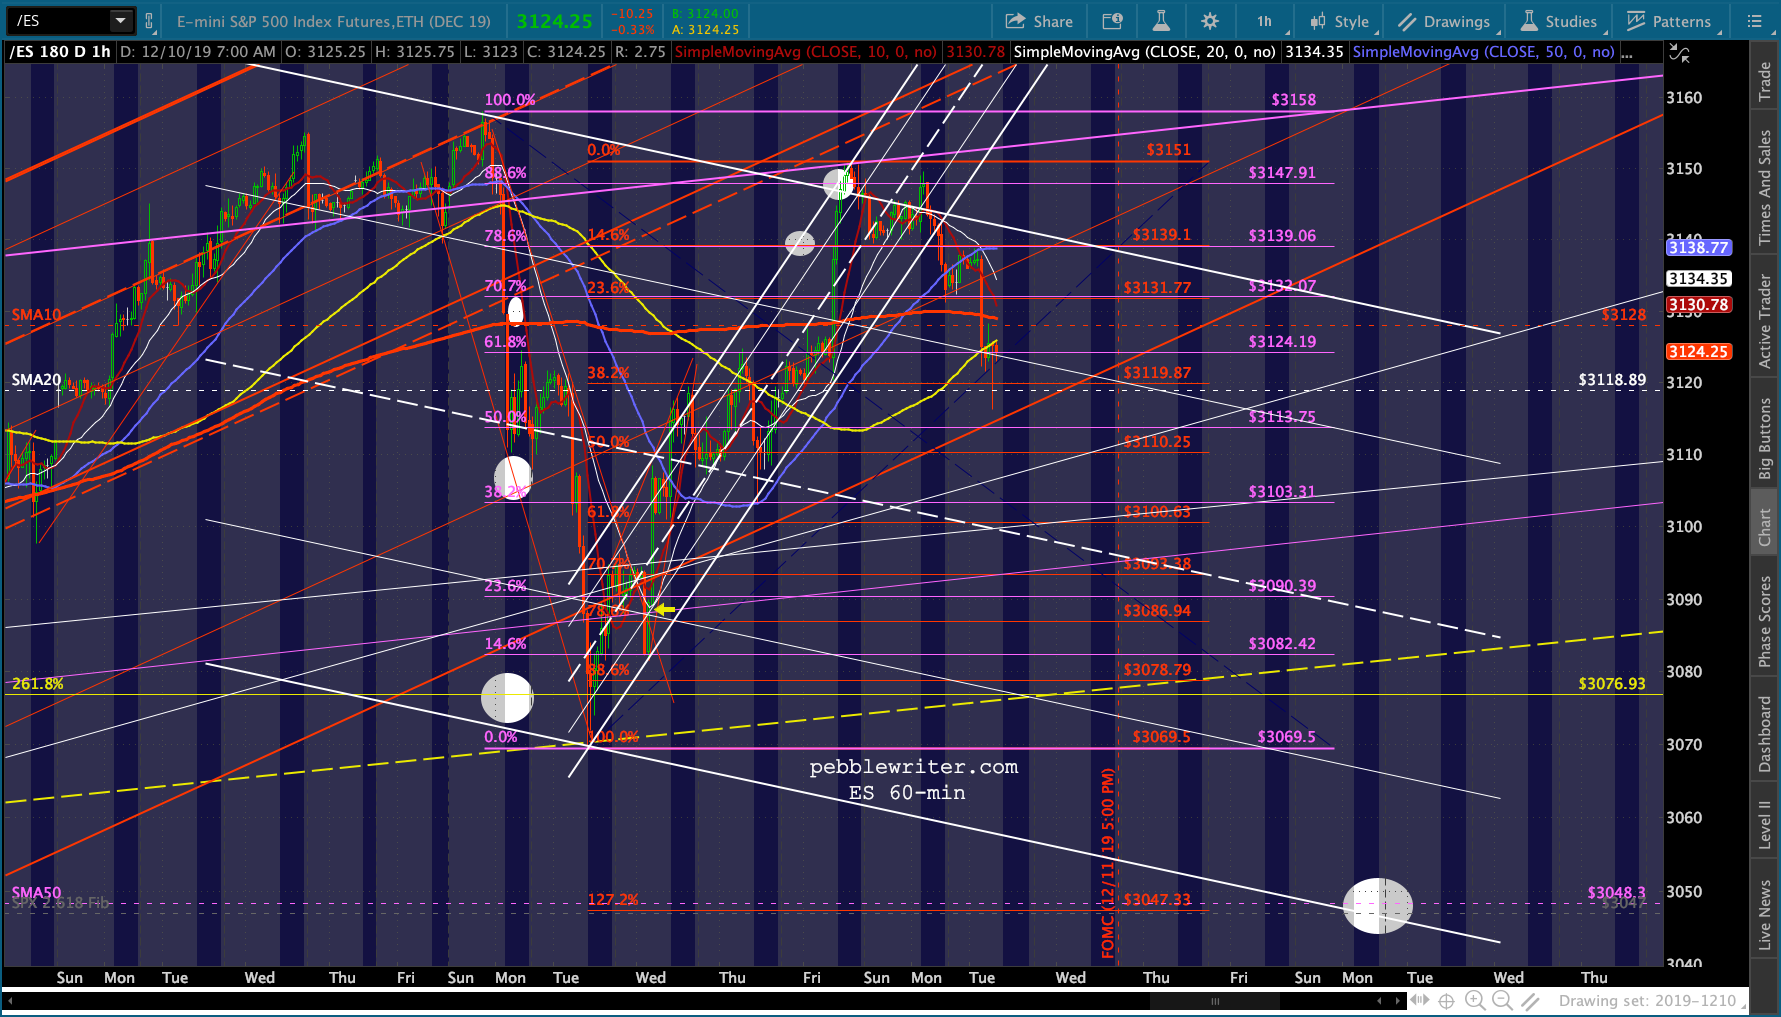 This scenario is still supported by VIX…
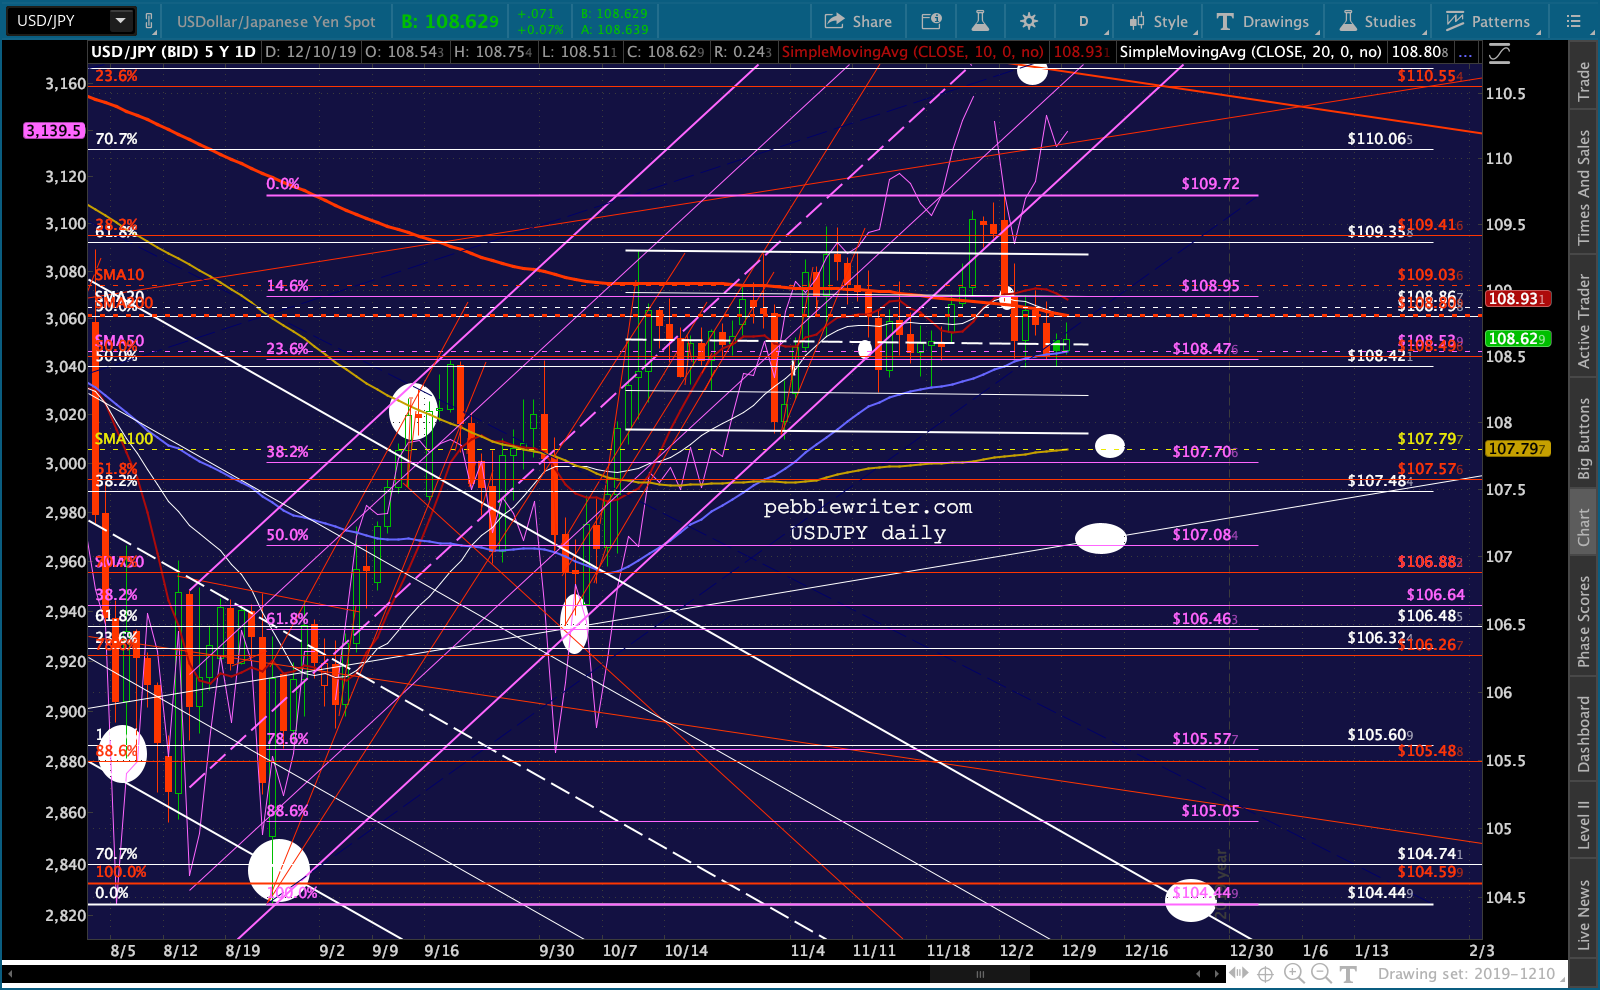
 …and USDJPY…
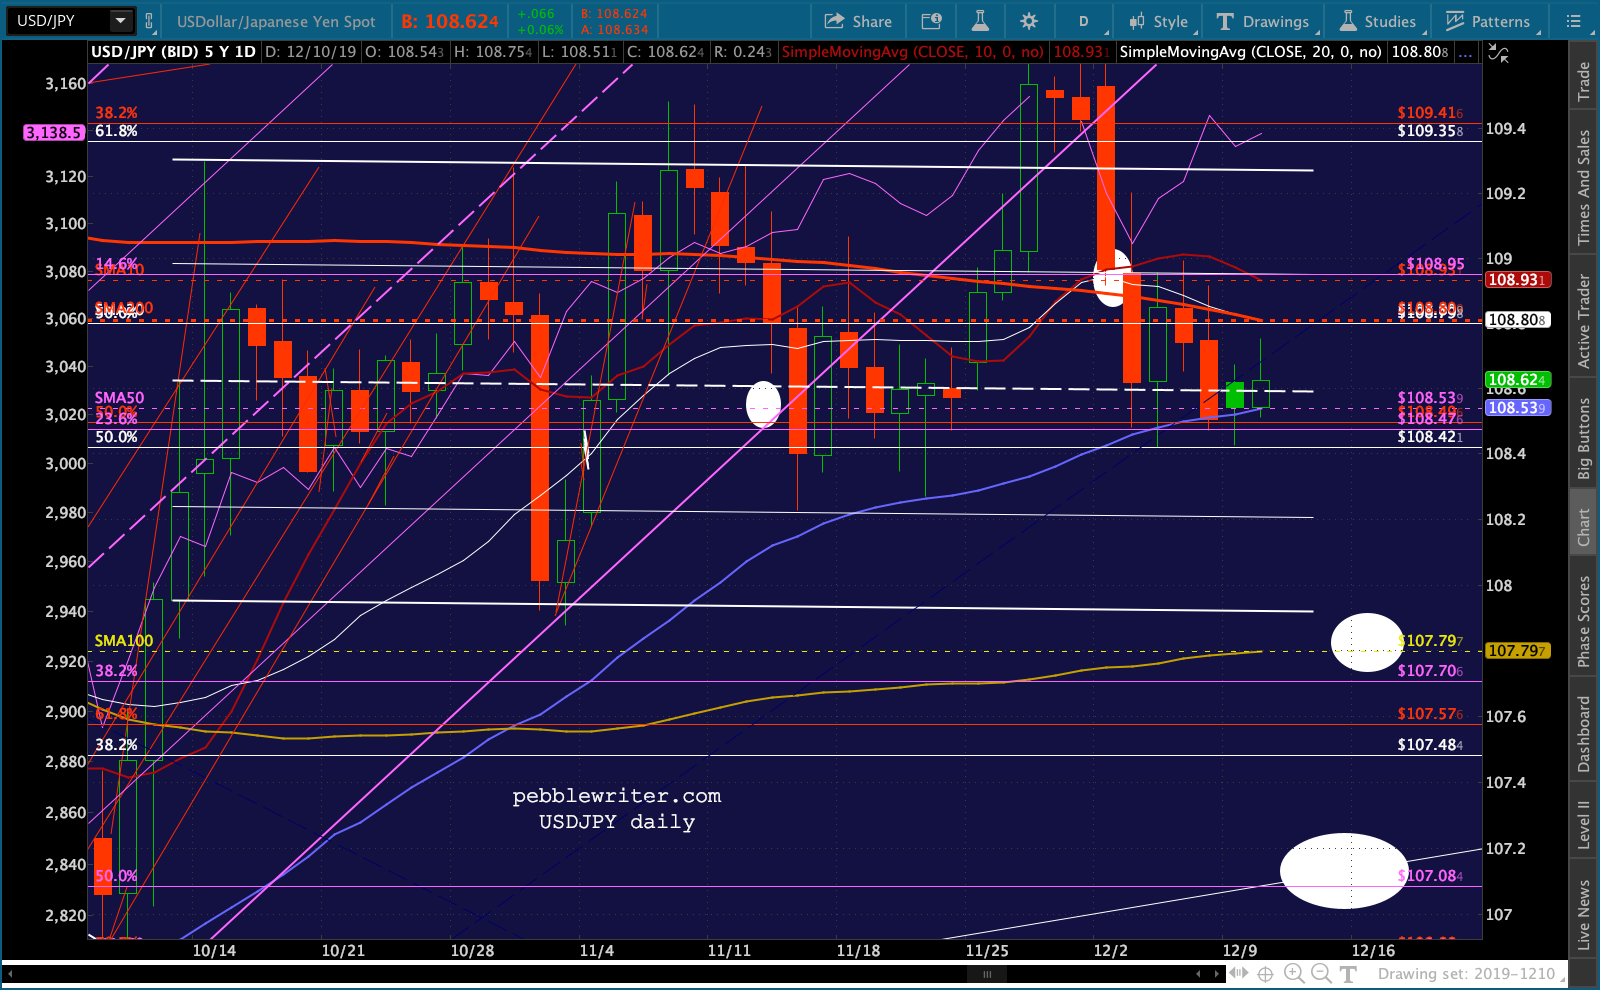
 …and CL.
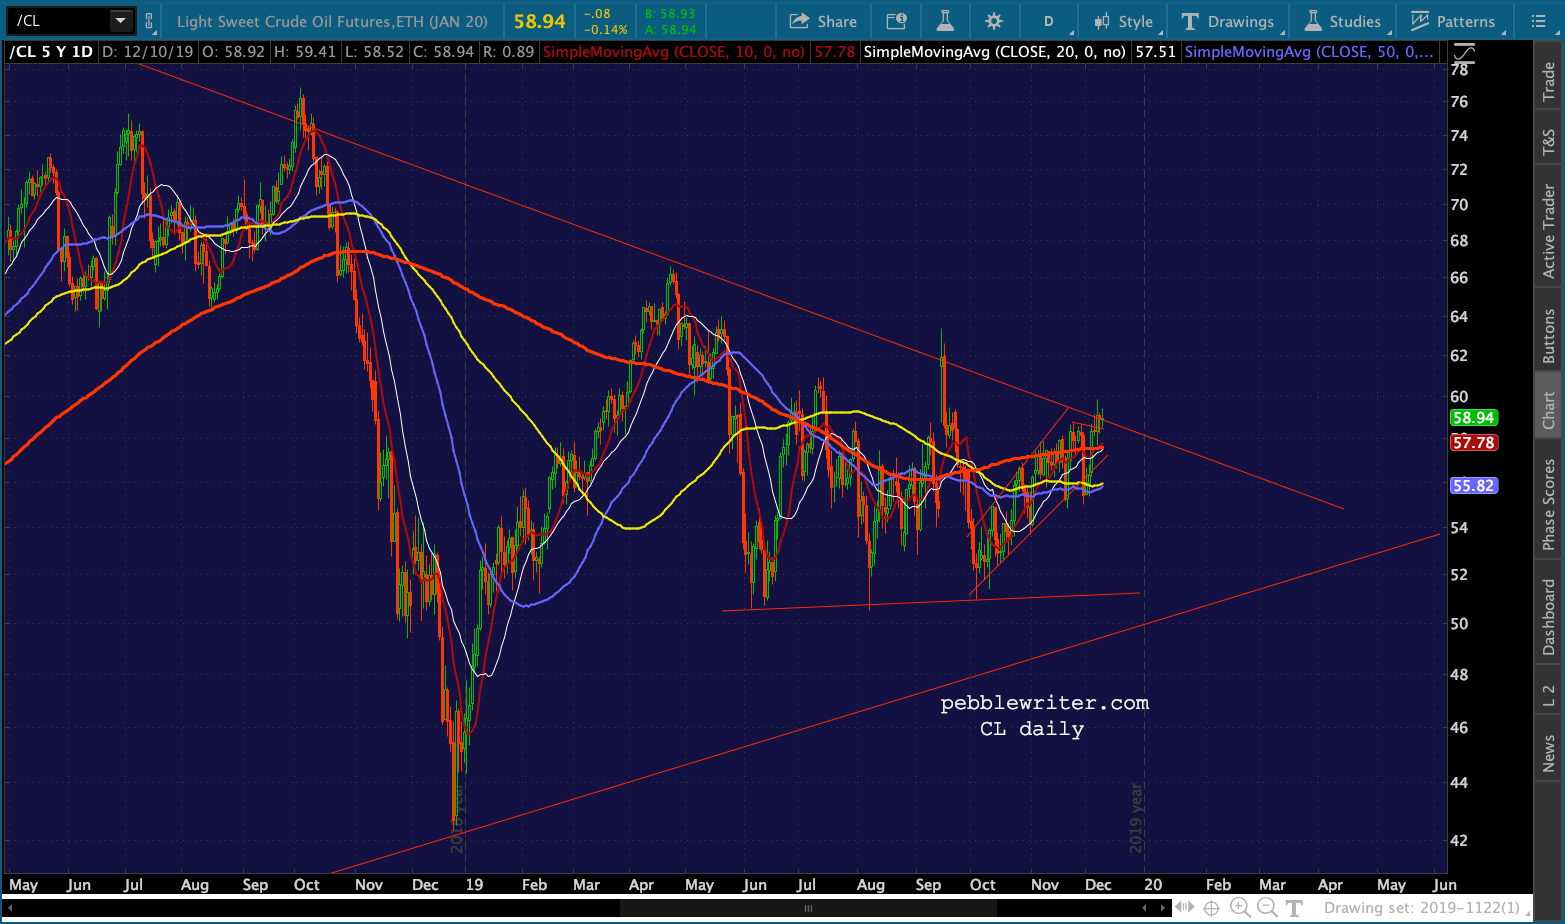 I believe the Fed will try and hold CPI to as close to 2% as possible. All else being equal, CPI would come in at exactly 2% if December gas prices average 2.335. This is conventional unleaded regular gas which is currently about 2.485 (the November average was 2.48.) So, we’d be looking at a 6.03% decline. Translated to RB, that would equal a drop from 1.66 to 1.56. But, that wouldn’t be an apples to apples comparison.
Using EIA’s data, gas dropped from a high of 2.725 in April to a low of 2.45 in Sept — 1 10.1% decline. Over the same period, RBOB dropped from a high of 2.1559 to a low of 1.4475 – a 32.9% decline.
A more legitimate approach might be to look at where RBOB was when EIA reported prices near 2.335. The best example would be early December 2018, when EIA reported weekly data of 2.35 and 2.325 (the last two weeks dropped to 2.268 and 2.216.) As we can see from the chart below, early December in RB ranged from 1.37 to 1.52.
Applied to Dec 2019, this would align fairly closely with a range from the purple .886/white .786 at 1.35ish to the purple .707 at 1.51. 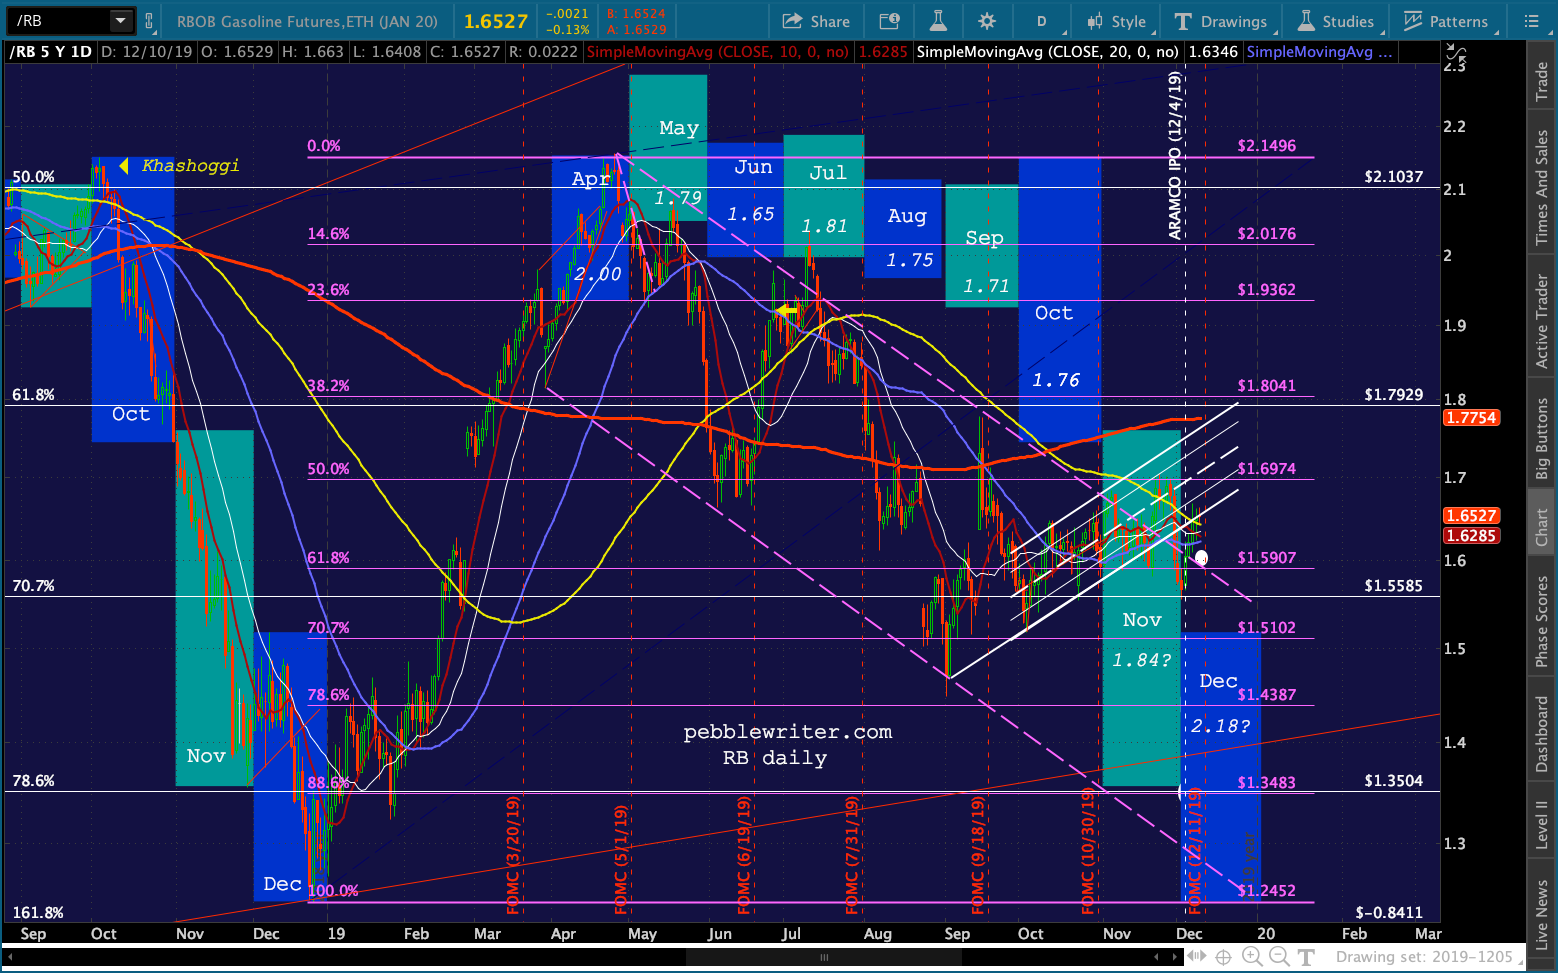 Remember, this is if TPTB wish to keep CPI at or below 2.0%. Keeping inflation steady at 1.84% in December would imply gas prices around 2.19, which in turn would imply RB of 1.37 to 1.51. A return to CPI of 1.71% would mean 2.09 gas and 1.27-1.40 RB (not since 2016.) And, of course, this exercise assumes all else is equal – which will almost certainly not be the case.
So, what is likely? I think the sweet spot is 1.8 – 2.0% — about 2.16-2.33 in gas and 1.37-1.52 to 1.37-1.48. Combine them and you get an average gas price of 2.145 and RB of 1.40. Since we’re talking averages, this would comfortably allow RB to decline as far as 1.35, which is the purple .886 and white .786. Any drop through this level would run into the yellow .707 at 1.30, the former low at 1.25 and the yellow .786 at 1.19.
From 1.66 to 1.35 would be a 18.7% in RB futures — not huge, but very decent for a 1-3 week trade. We’ll know for sure the move is happening when the purple TL in the chart belowo breaks down.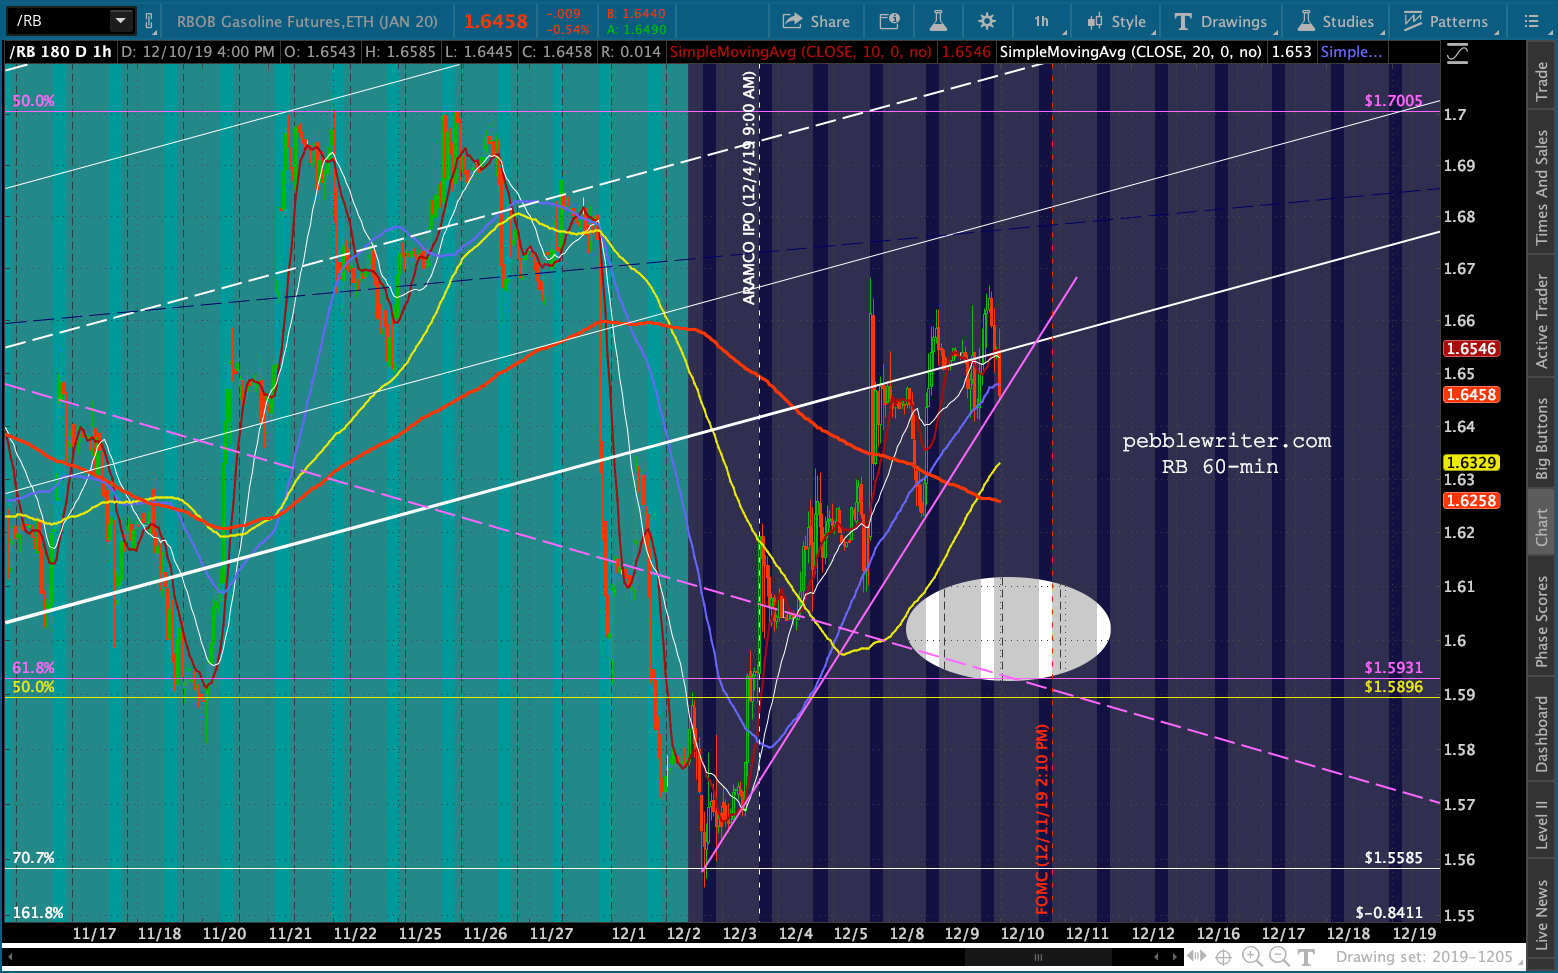 CL is a slightly different animal. Though, it’s safe to assume that a 19% drop in RB would equate to 47.55 – 49.46 in CL. However, there is a chart pattern that I’ve been studying for the past several months which promises much bigger moves in a longer time frame. More on that tomorrow.