

I’m not a gold bug. I’ve always thought the price is pretty heavily manipulated (long before it hit the headlines) and I guess I’ve avoided it on principle. Looking back at my forecasts over the past year or so, that was probably a mistake.
Since our December 14, 2015 forecast, GC has gained about 19% — not shabby. However, if one heeded the forecasts offered with each subsequent update, the net return would have been over 80%.
I’ve said many times, lately, that forecasting stocks has become a lot tougher than forecasting the various drivers of stock prices. In the case of gold, it is obviously affected by the value of the US dollar, which is an important component of USDJPY — a key driver of equity algos.
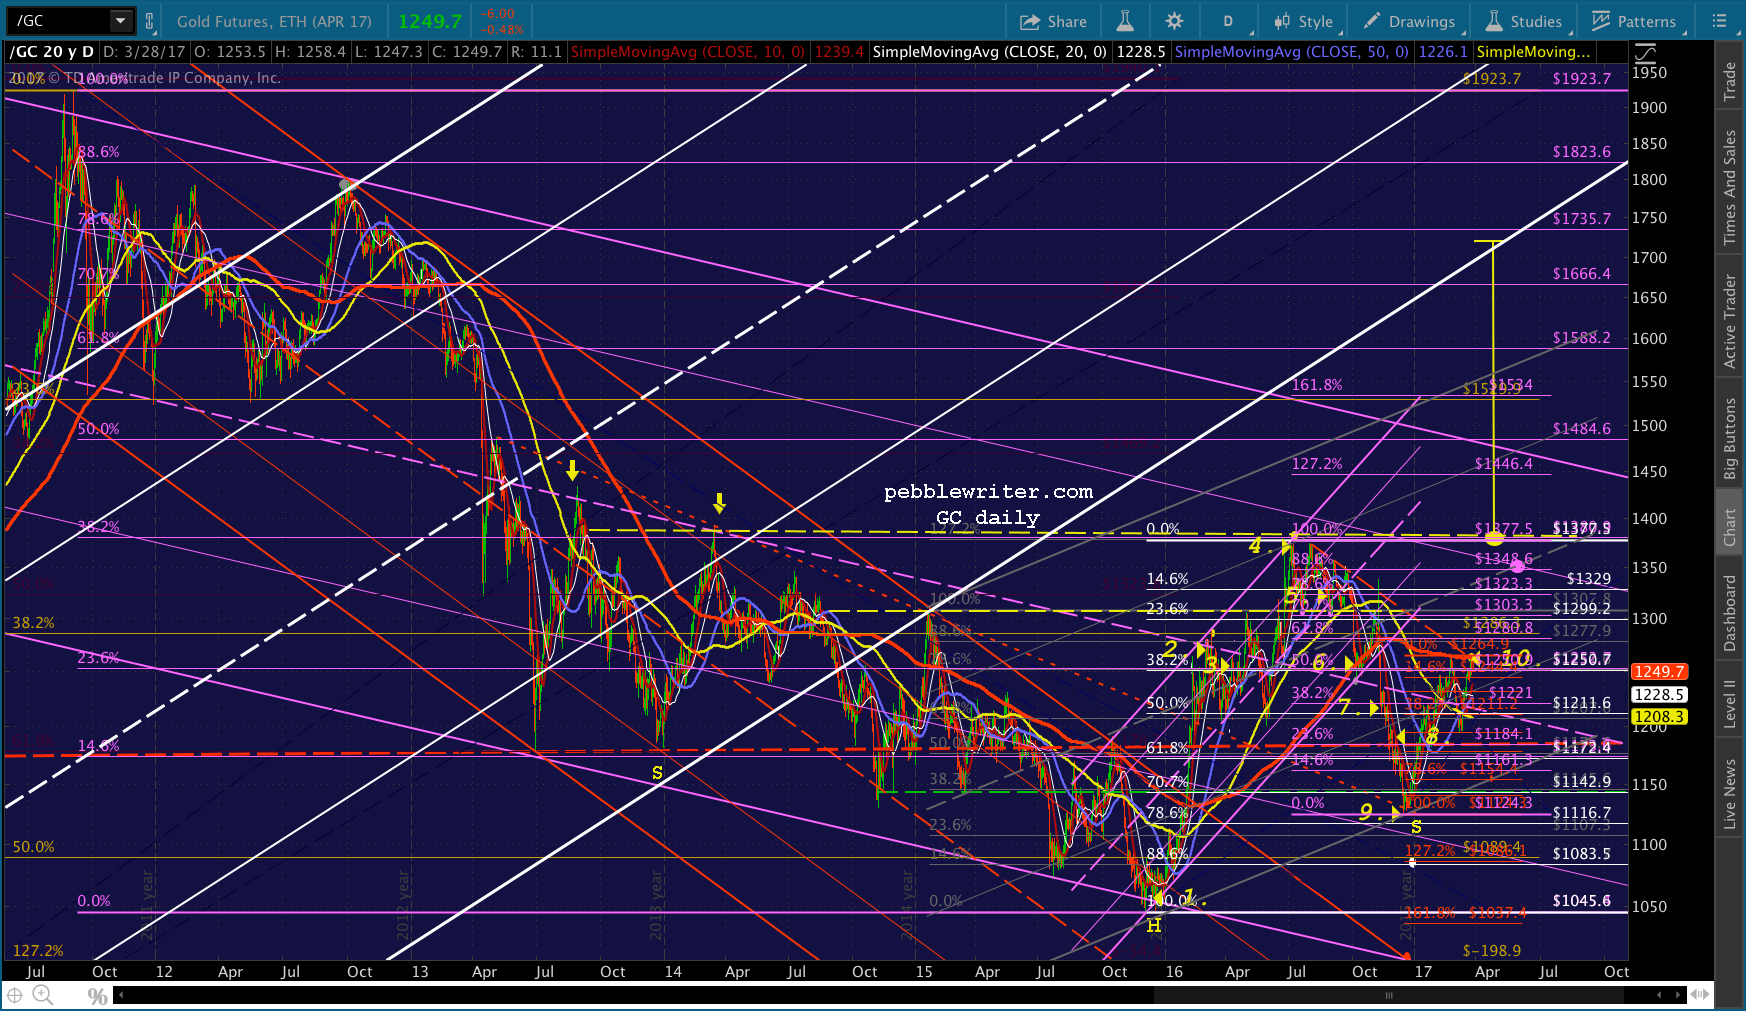
Thus, GC — like USDJPY, WTI and VIX — is one of those things that’s been relatively easy to forecast even though I’ve devoted only the occasional hour or two to its study. Before we touch on today’s forecast, let’s take a look at the past year’s periodic forecasts. The numbers in the above chart correspond to the posts below.
- Dec 14, 2015 (GC: 1060):
“If DX plunges further, as I expect it will, GC’s 4th bounce could be a doozy: 1150-1180 for starters, and 1286 after that.” GC reached 1180 by Feb 8, topped out at 1287.80 on Mar 11.
- Mar 4, 2016 (GC: 1280):
“I’d be very cautious in chasing GC at this point…acts like it’s reversing between here and 1286…take the gains…it could easily backtest the .618 at 1207.60.” GC reached 1286 the next week, then reversed to backtest 1206. - April 8, 2016 (GC: 1240):
“If [gold] breaks above the purple midline [at 1270] then 1379-1380 is the next logical target…” Gold reached 1377.50 three months later. - July 7, 2016 (GC: 1361):
“Our target range from April 8 was 1379-1380. Yesterday’s 1377.50 was probably close enough. If it can’t make new highs today, the next stop is the neckline at 1307..” GC, which peaked at 1377.50 on Jul 6, dropped 5% to 1310 over the next 2 weeks.
- Aug 26, 2016 (GC: 1324):
“…[there’s a] huge IH&S Pattern, the neckline of which is the former high at 1307ish. If TPTB are serious about discrediting GC anytime soon it’ll involve getting it back below that [1307] support.” GC tumbled to 1307, testing it three times before breaking down to 1243 on Oct 7. - Oct 7, 2016 (GC: 1254): “…GC tagged its SMA200 and the bottom of a pretty good looking channel earlier — usually good for a bounce.” GC bottomed the next day at 1243, bounced for a month, reached 1339 on Nov 9.
- Nov 14, 2016 (GC: 1227): …GC’s channel finally broke down two days ago and has potential to 1083 — a 12% drop from here. What better way to finish the year out? GC plunged 103 (8.4%) over the next month.
- Dec 5, 2016 (GC: 1175): If the .618 [1172.40] breaks down, then the next support isn’t until the red TL at 1130, followed by the .886 at 1083.50… GC reached 1130 on Dec 15.
- Dec 15, 2016 (GC: 1129): “GC is currently testing an important internal TL of support… a potentially important test…that could produce a bounce to the purple midline [at 1230] or the SMA200 — currently at 1278.” GC reached the SMA200 at 1264.60 on Feb 27.
After tagging its 200-day average in February, gold tumbled about 67, back below a key channel midline. But, it is right back in the swing of things, having nearly reached the SMA200 a second time just yesterday.
With all the discussion about what the Fed will or won’t do for the rest of the year, what’s next?
continued for members…
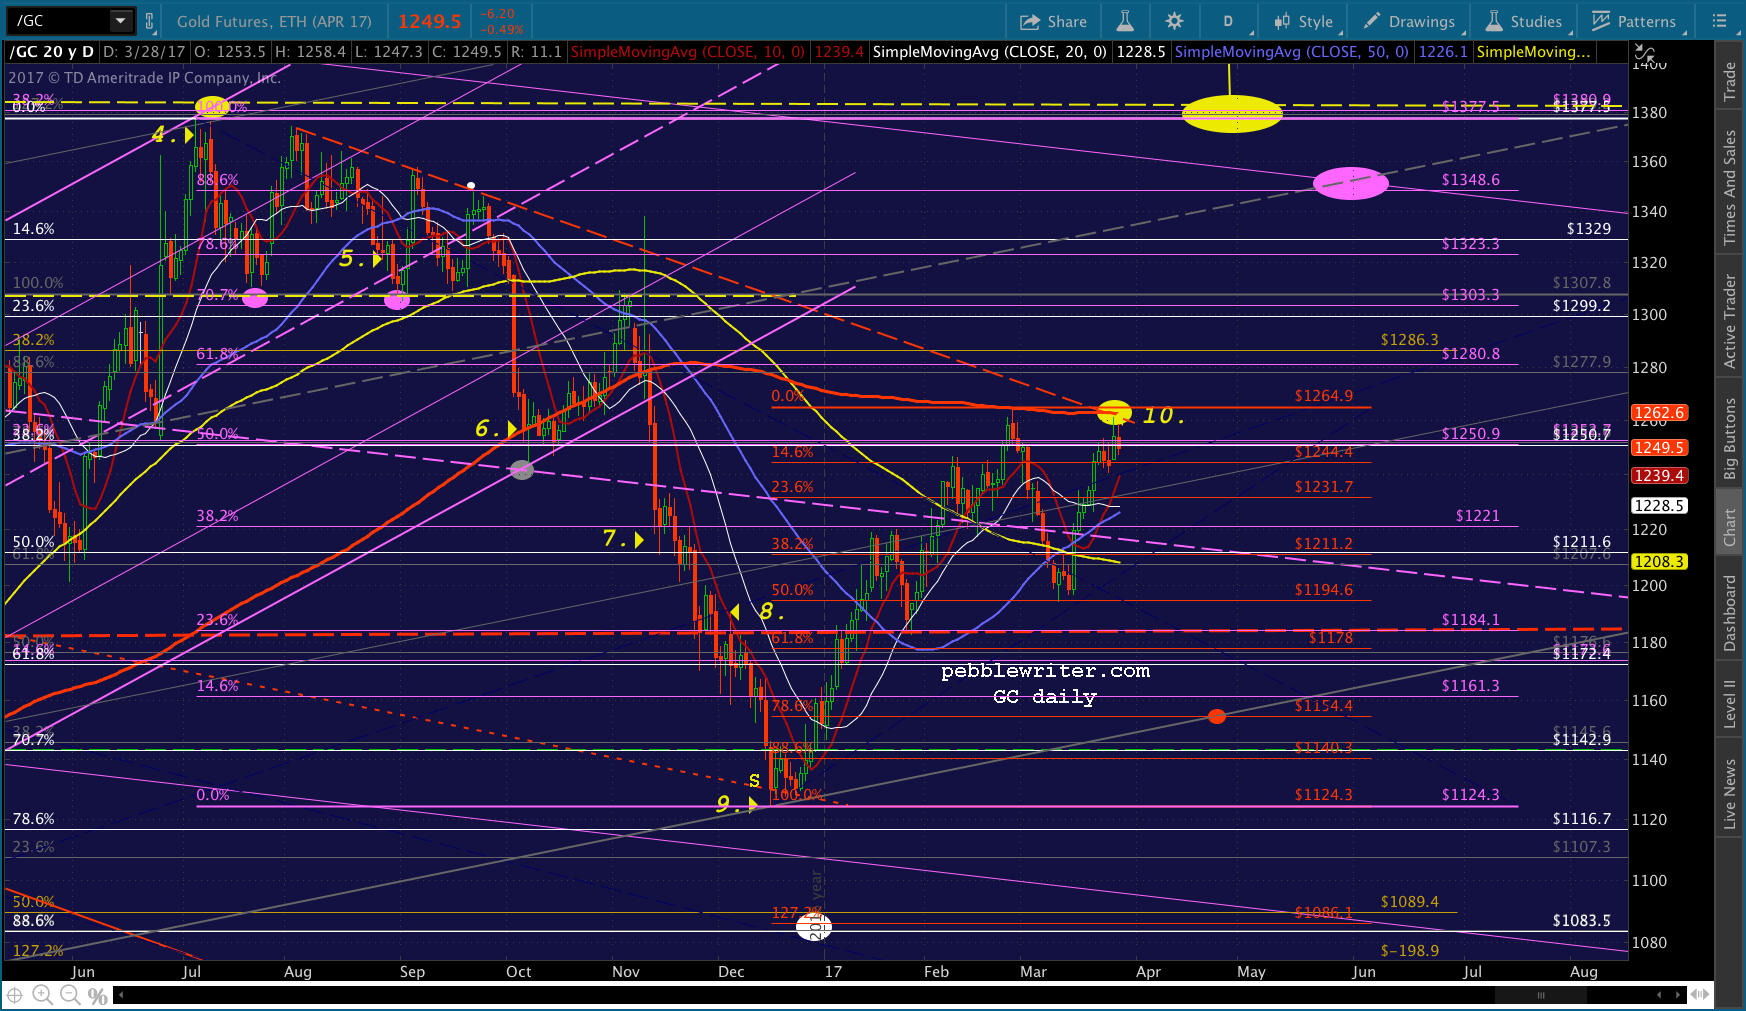
The falling red channel has long since been out of the picture. The breakdown from the rising white channel presented a backtest opportunity, but GC nixed that idea when it rose to and above the purple channel midline. We’ll look at the upside and the downside cases.
Upside: By nearly reaching the purple .786 line and dropping nearly back to the .236 line, it suggests that the purple channel top is in play. Of course, that would mean the large IH&S has completed and GC has broken out past 1380 — the neckline as well as the purple .382.
There’s a purple 1.272 there at 1446, which could fit nicely with a breakout of the current pattern if it waited until, say, October. If it moved very quickly, it could line up with the purple .500 at 1484. But, it seems that ship has probably sailed. It would have to move 18% in the next few days. Very unlikely.
 Note that the IH&S target of 1720ish lines up fairly well with the purple .786 and a backtest of the broken white channel around June 9. Obviously, that’s an even bigger move that would require a breakout very soon and a 39% move over 9-10 weeks. Not impossible, but aggressive.
It might make sense given the sharp rise we’ve seen in inflation over the past few months courtesy of oil. We have been waiting for CL to settle lower to moderate the impact on CPI — but , at least recently, the FOMC has acted rather complacent regarding inflation.
The upside targets, then, if GC breaks out past the SMA200 are the .618 at 1280.80, the .886 at 1348.60 and the yellow neckline at 1380.
Downside: This one is a lot easier. It would start with a retreat from the SMA200 and follow the red Fib grid instead. The most likely target would be the .786 at 1154.40. But, we had a previous reversal at the red .500, meaning that the .886 at 1140.30 is technically more likely.
If 1140 didn’t hold, then we’d be looking at the red 1.272/white .886/ purple channel .236 line at 1083-1086. No question this is where the Fed would like to see gold. The fact that it has done as well as it has must be a sharp stick in their eyes.
 In either case, keep an eye on DX — which tagged very clear support yesterday, but might have some more to go. It got a nice bounce off the yellow TL and the .618 today. But, TLs are made to be broken. And, the international trade picture isn’t what it used to be.
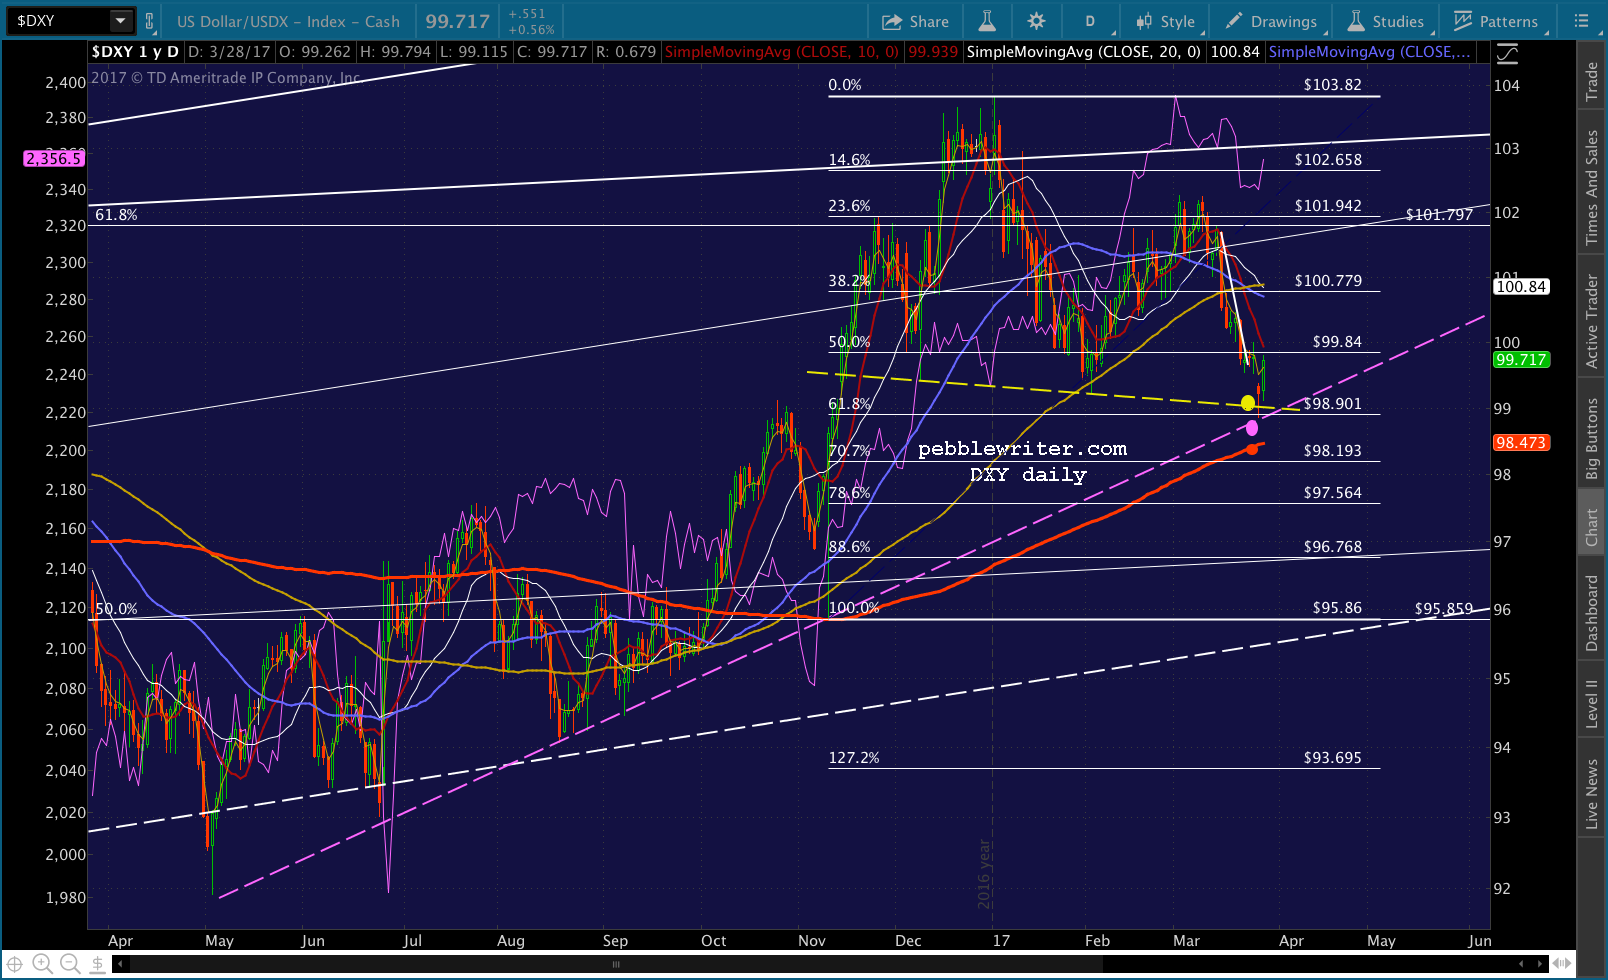 If I had to take one side or the other, my gut tells me that inflation will be reported higher on Apr 14, which will drive GC up past the SMA200 and on to its higher Fib targets: 1280, followed by 1323 and 1348. But, by the time it approaches the yellow neckline, TPTB will have found a way to grossly understate CPI, which will prevent GC from breaking out.
Much of this revolves around the prices of oil and gas — which have been even more heavily manipulated and much more difficult to forecast.
GLTA.