

In our last Big Picture post on Oct 26, we focused on two key drivers of equity values.
The problem, as noted in Welcome to Peak Oil, is inflation…. CL peaked [October 9, 2015] at 50.92 and plunged to 26.05 over the next four months. If it doesn’t do the same thing now, we’ll get year-over-year inflation. Since this past Feb, CL has been the primary factor in stocks moving higher. If it can’t maintain that role, then TPTB will need to find another algo engine — or stocks will fall.
The yen carry trade worked from 2011 – 2015, but can it be resurrected? USDJPY has certainly changed its tune since CL’s top first became a problem. Note that it broke out of a very well-formed falling channel dating back to Oct 2015 at the very moment that CL was testing its yellow neckline.
Oil has now fallen 18% since our Oct 10 top call [see: Welcome to Peak Oil], and USDJPY, has risen a spectacular 6.9% since last Tuesday night’s election lows. That’s all well and good. But, the big surprise in preparing this post was that the analog [what’s this?] I first advanced 3 1/2 months ago [see: A New Analog: Aug 3, 2016] continues to play out relatively well.
continued for members…
I pulled up the original chart and calculations to see how badly it had stumbled, and was surprised to see that, aside from interference by moving averages that were absent in 2007, it has held up nicely.
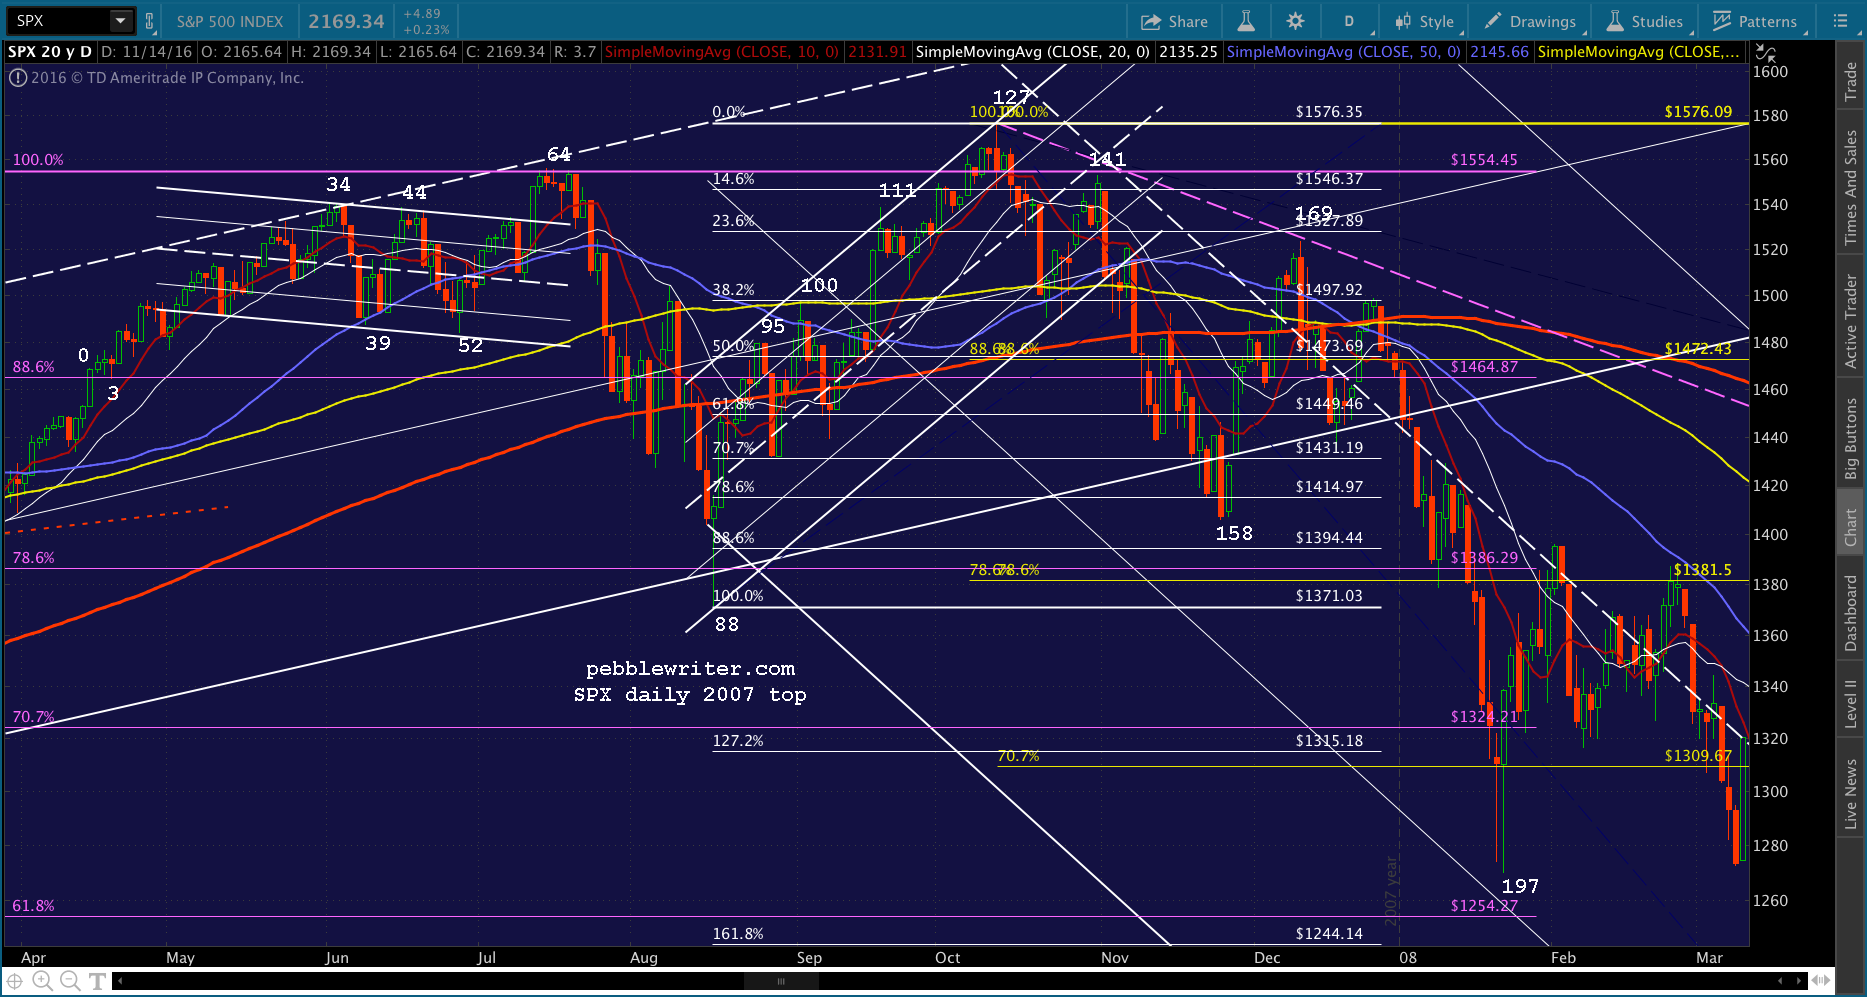
Here’s the original chart, with the first indicated path indicated in yellow and the modified path (to take the rising purple channel into account) indicated in purple. I expected TPTB would hold the line at 2138 rather than let it continually plunge below it. 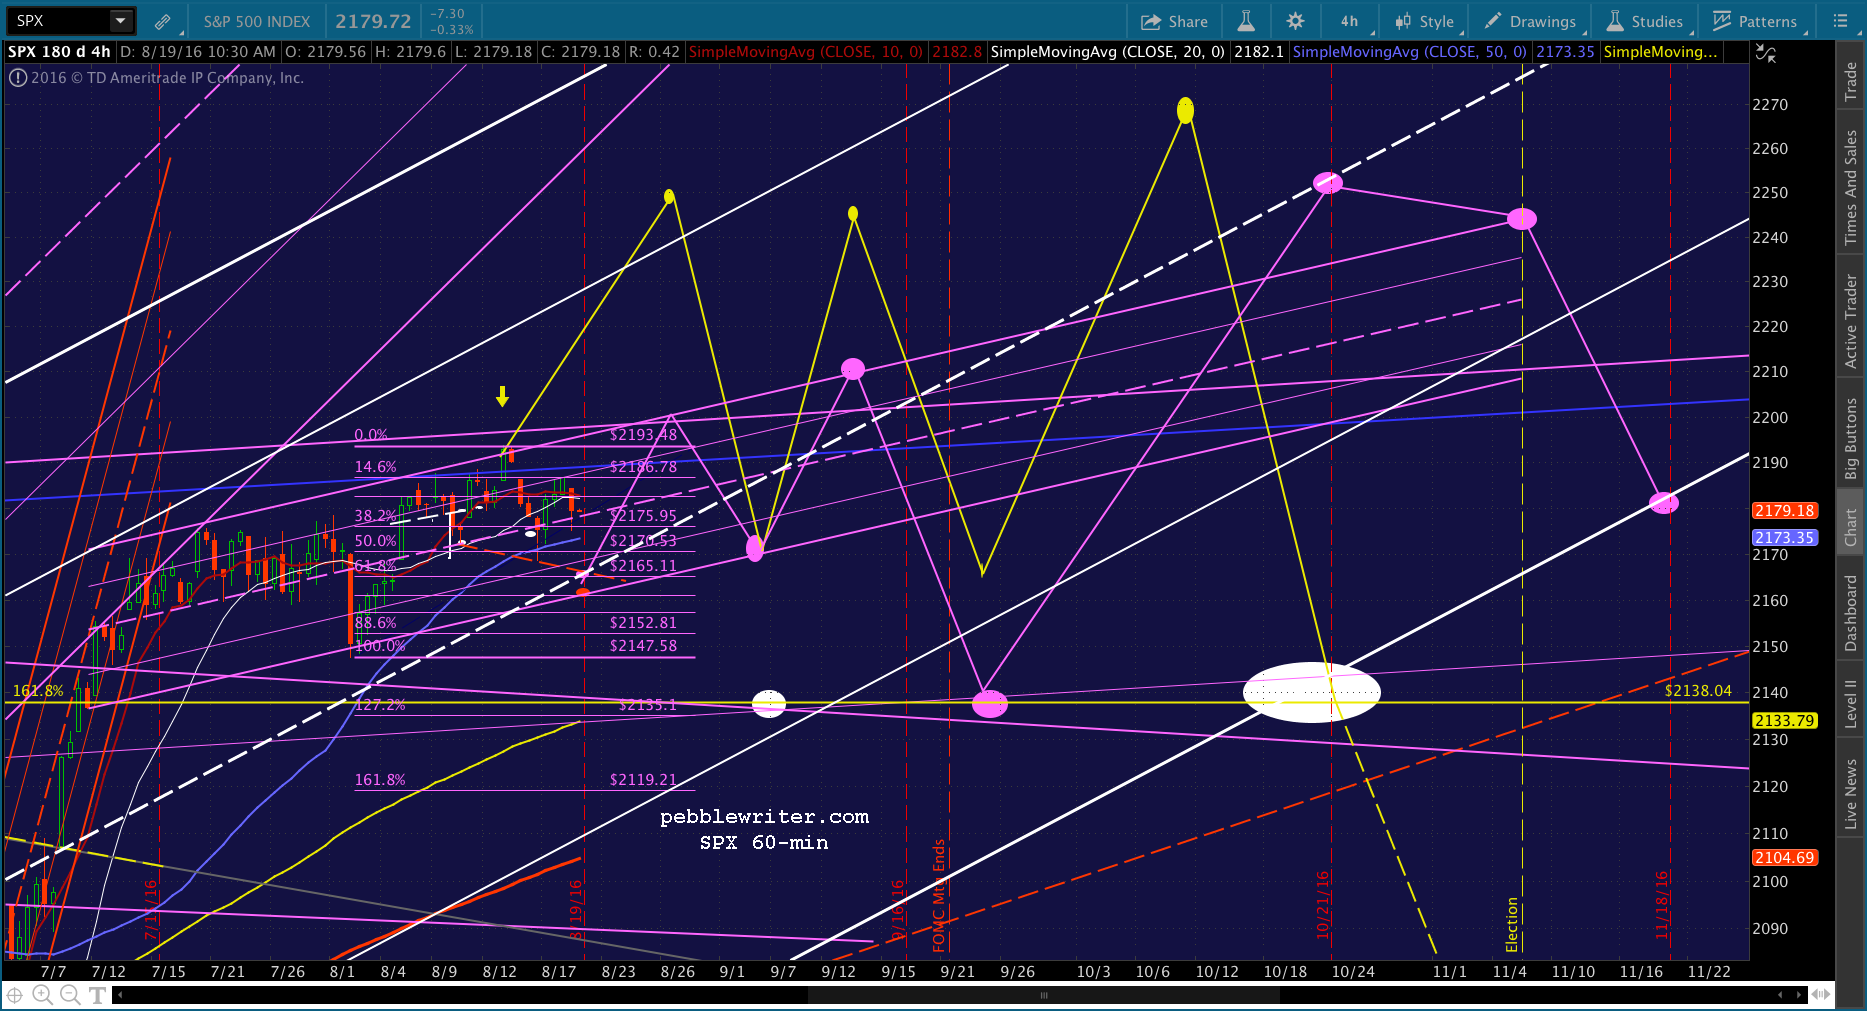 Here’s the actual 2007 top, annotated with the number of sessions past the initial rise past the purple .88 on Apr 16, 2007.
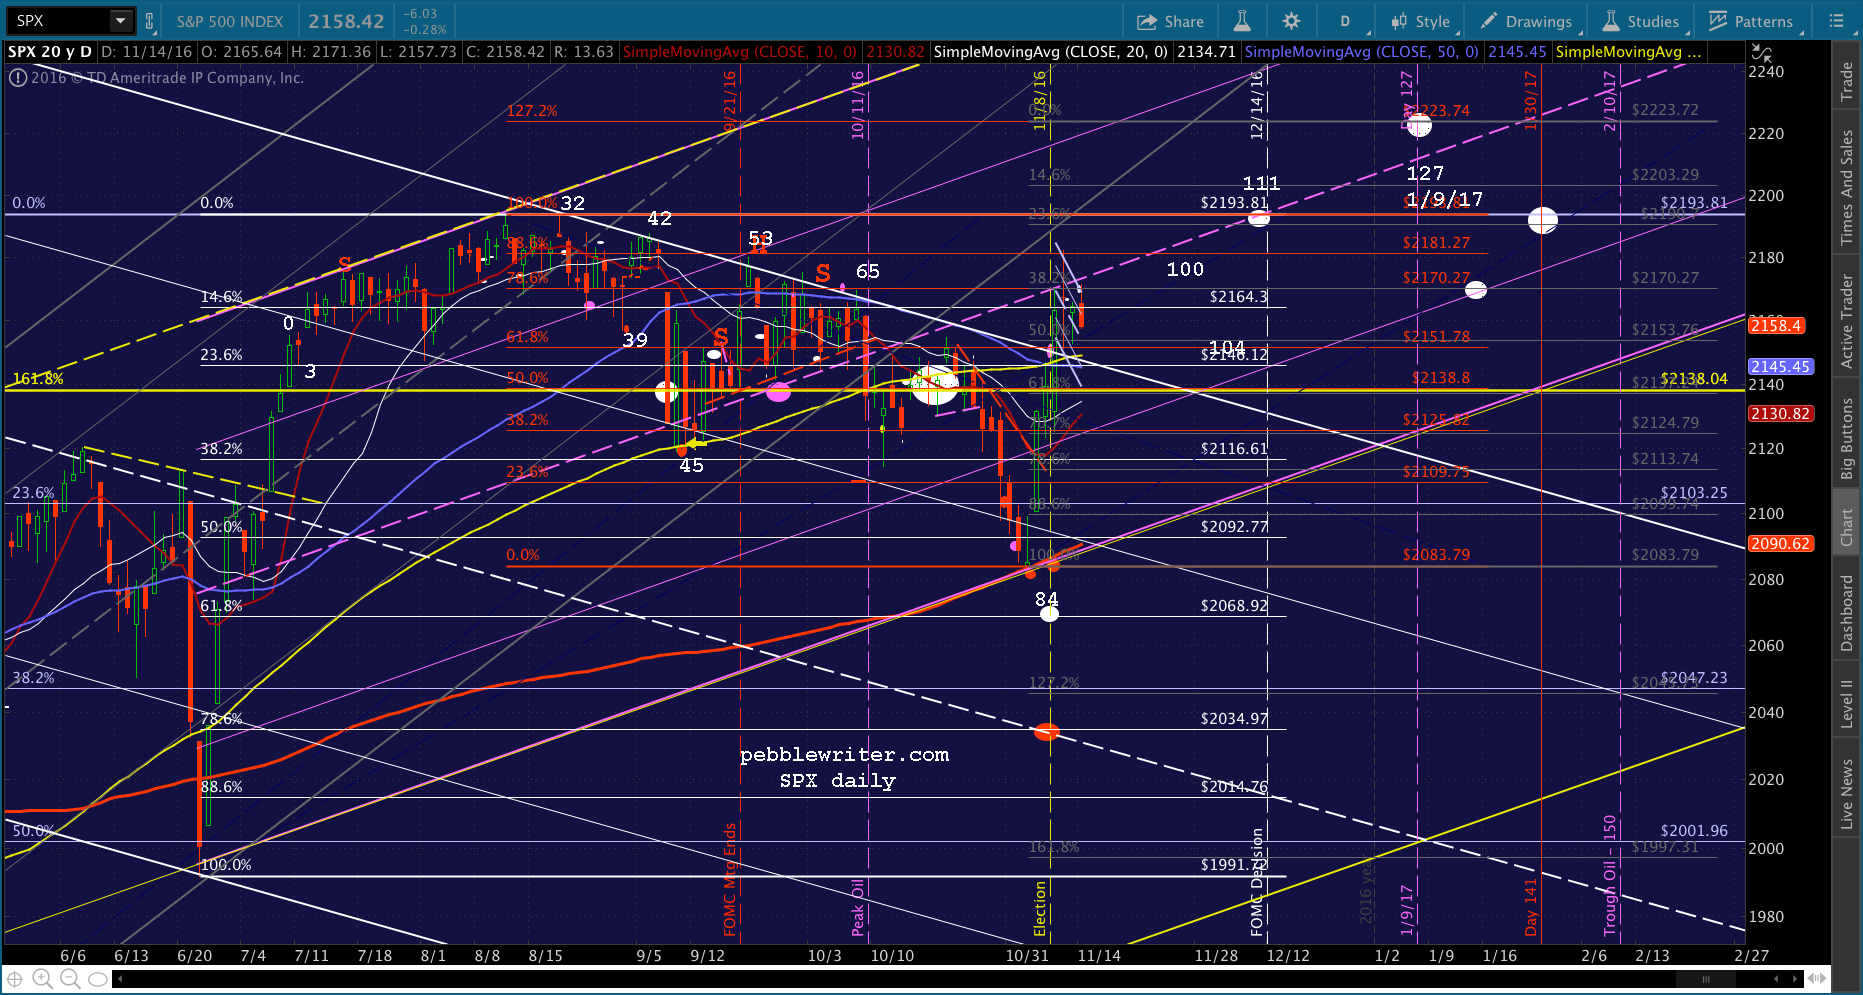
 And, here’s the equivalent period today. The three tests of 2138 (the white dots on Sep 9 and Oct 21, and the purple dot on 9/27) were pretty darned accurate. The biggest difference was the failure of the current chart to push higher into day 64 as occurred back in 2007. But, consider what happened this year.
 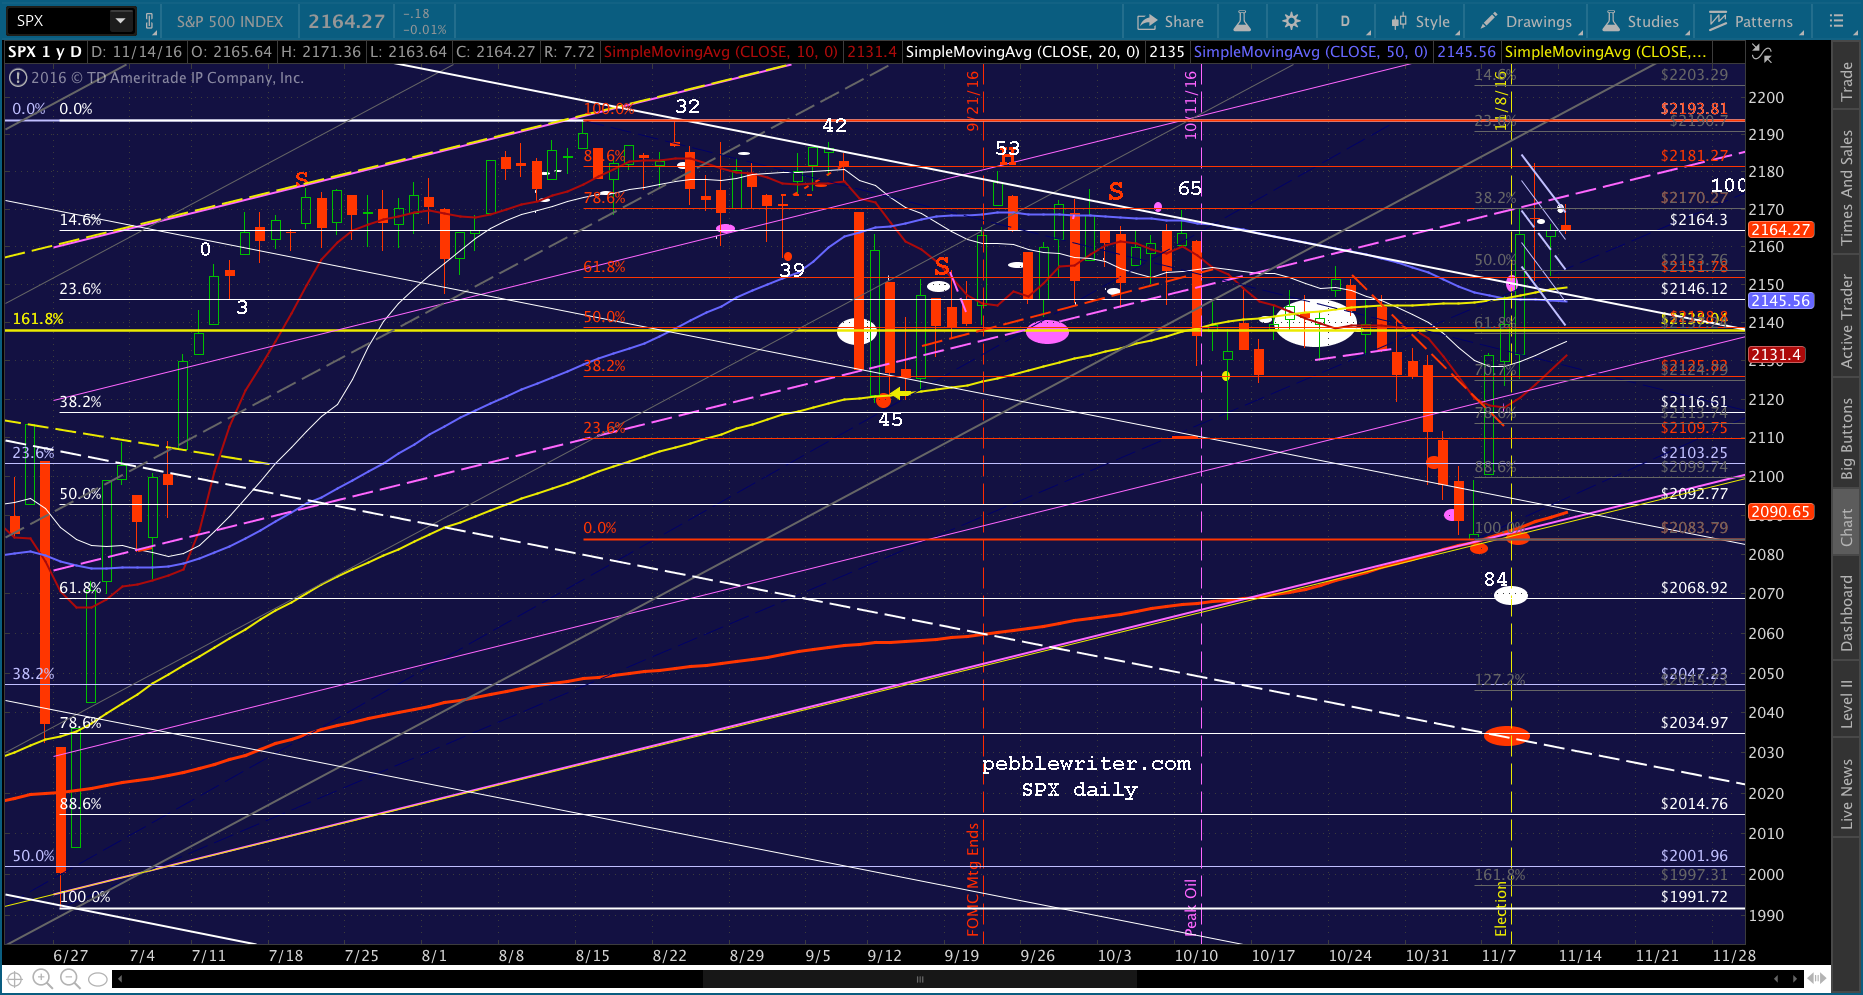 Day 42, which lined up reasonably well with day 44 in 2007, was followed by a disappointing ECB announcement and elevated talk of a FOMC rate hike that sent SPX gapping lower [see: Psyops and the FOMC.] It was a risk TPTB probably felt they had to take.
CL had recently reached important overhead resistance — the yellow dot at the yellow IH&S neckline — and it was time for USDJPY to take over as CL prepared to roll over.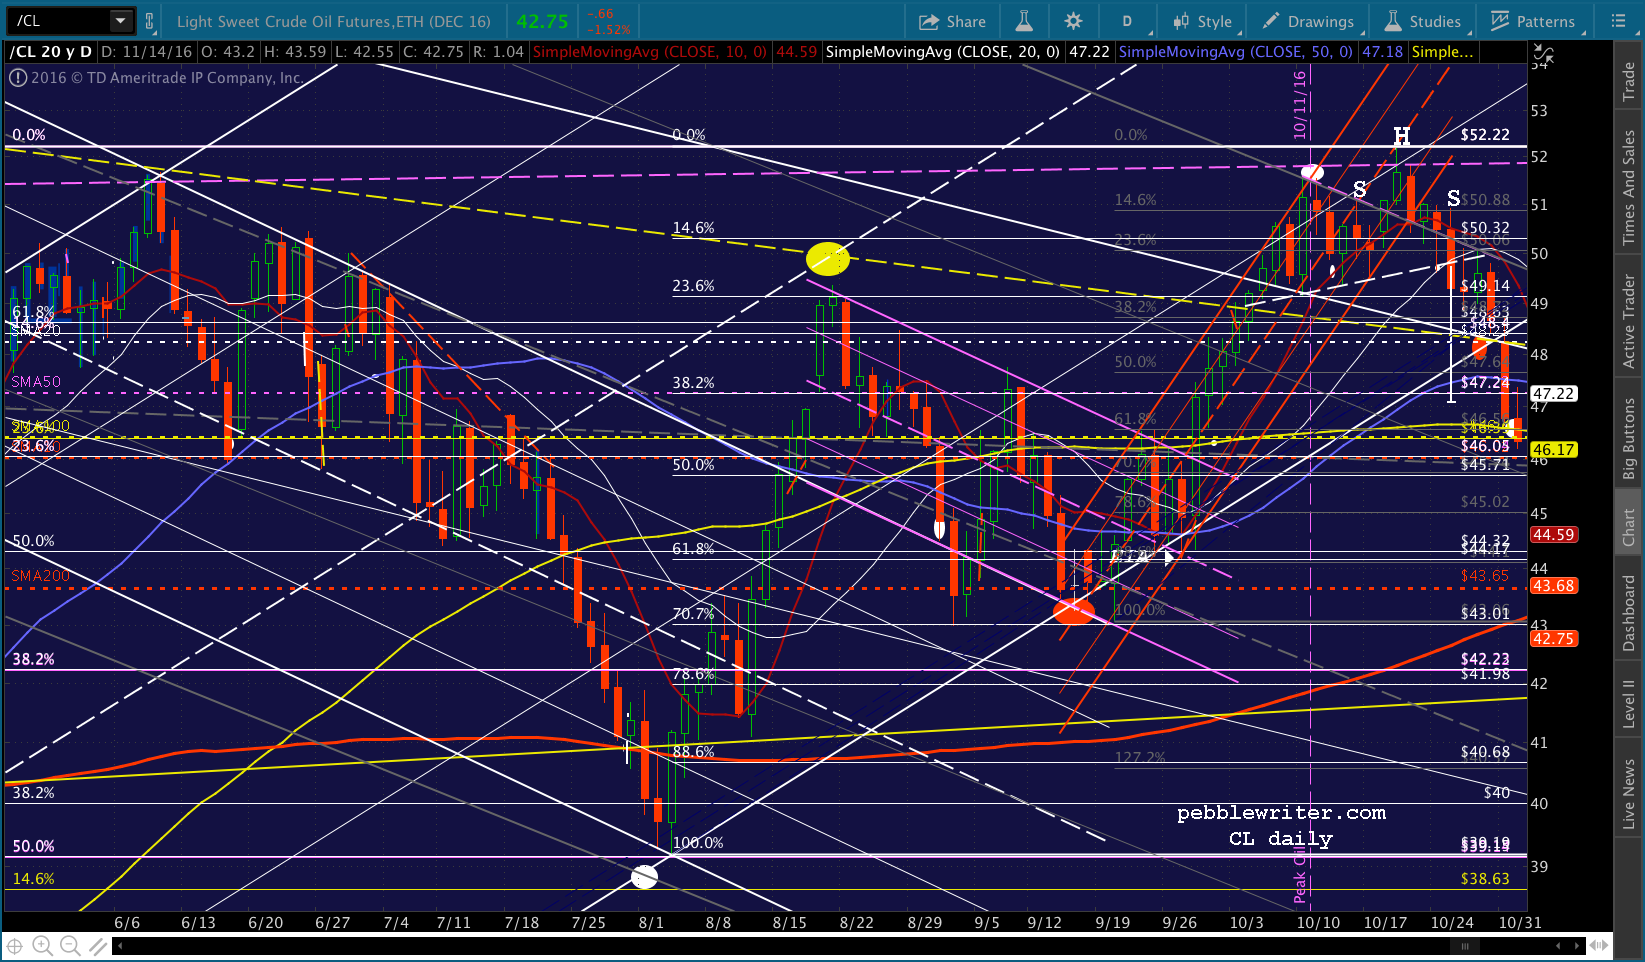 But, on Sep 6, USDJPY fell back through its SMA10 and was heading back toward the bottom of its Flag Pattern established in the wake of Brexit. As I recall, we had numerous Fed presidents giving interviews indicating they were highly likely to raise rates on Sep 21.
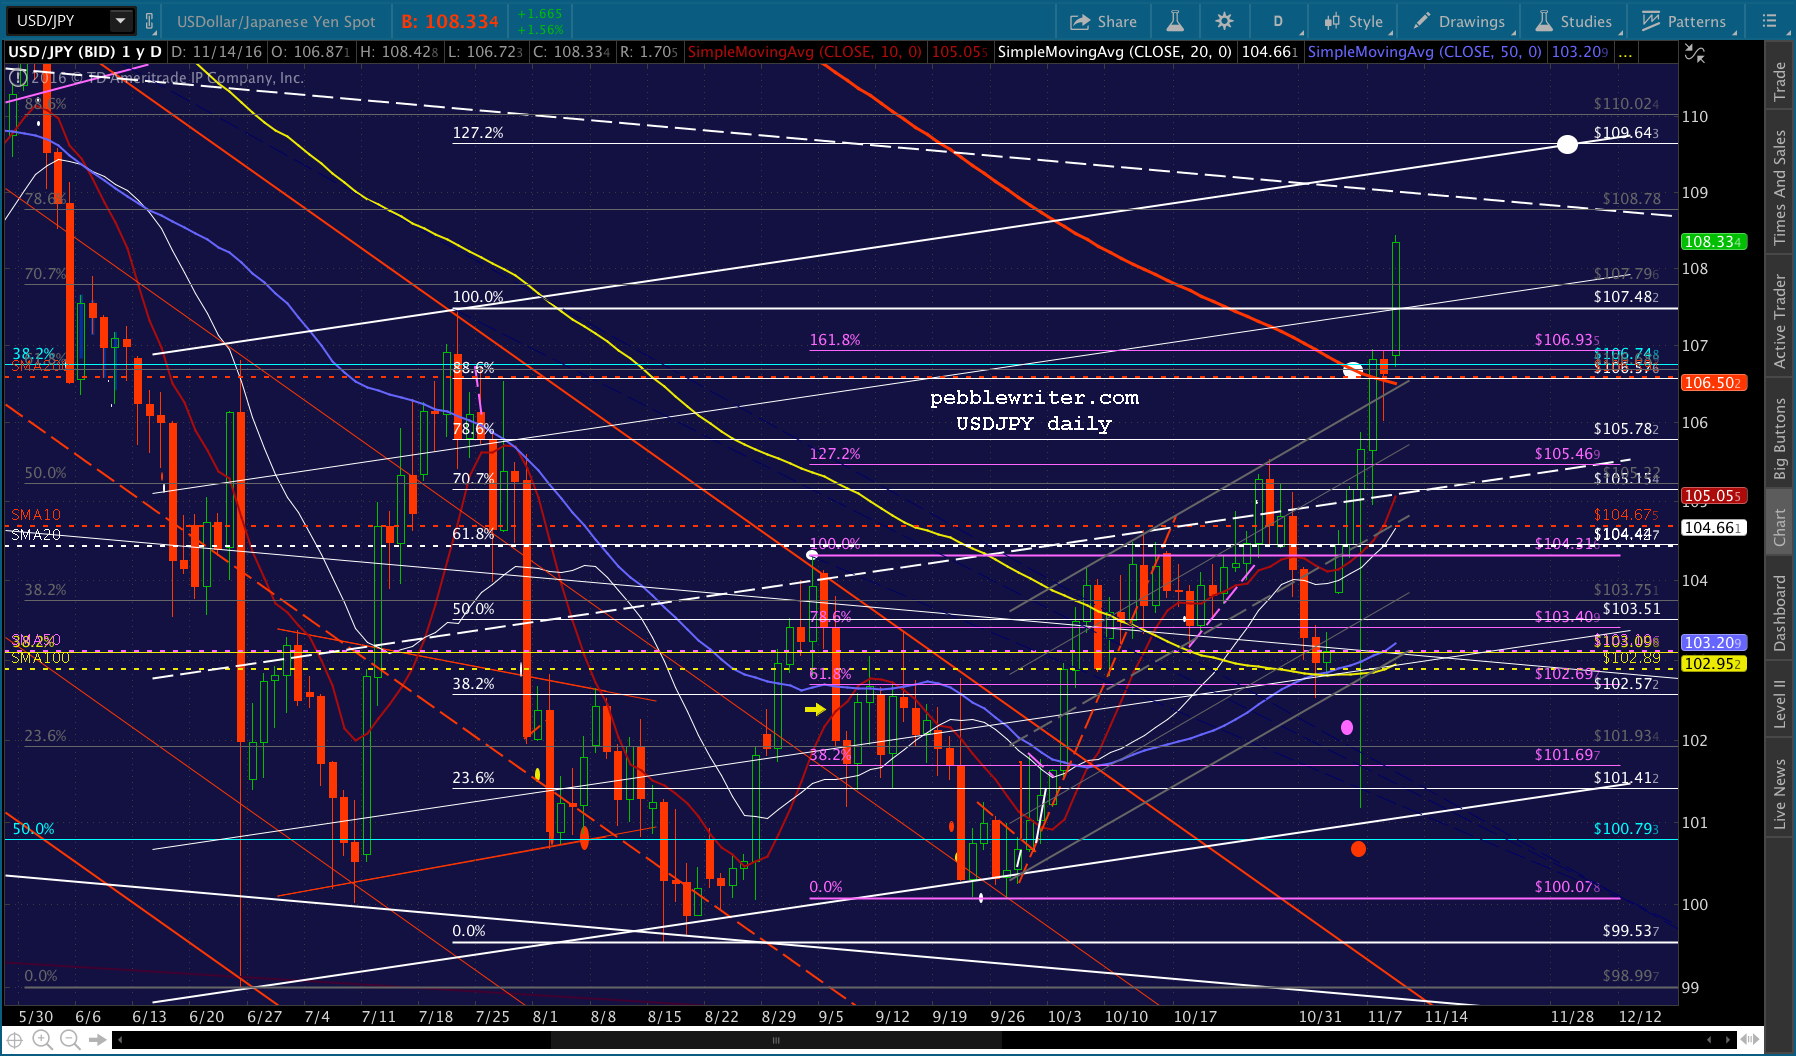 They didn’t of course. But, by then, USDJPY had reached and found support at the Flag Pattern bottom, the bounce from which was enough to help DX break out and the yen carry trade to avert further drops for stocks.
We can see the same phenomenon playing out today, as USDJPY is soaring to compensate for CL dropping through its SMA200 (in line with our forecast) — all in an effort to keep SPX in the green.
After all was said and done, day 42 and day 44 lined up pretty well in terms of their influence on what was to come except for the fact that in 2016, day 65 didn’t have a chance to push higher — not with the prospect of higher interest rates which feeding the yen carry trade required.
After that, things went pretty much according to plan. Day 88 in 2007 lined up nicely with day 84 in 2016. I think it’s fair to say SPX might have dropped a little further over the next few days if it hadn’t been stick-saved at its SMA200 (which is never actually reached, BTW.) The stick save came courtesy of USDJPY’s gap higher on Nov 7, in advance of the elections.
And, of course, that’s the other divergence between 2007 and 2016: the election. On Nov 7, SPX advance nearly 50 points from the previous day’s lows on widespread anticipation of Clinton’s victory. It advance another 14 points the following day on the eve of the election and 24 more points on election day. All in all, it was a stunning 87-pt rally because Hillary was certain to win. We all know what happened next. Hillary didn’t win, and ES plummeted 115 points off the Nov 7 highs. Had ES held those losses overnight, this would have put SPX at 2031 — 3 points away from the red target at 2034.97 — the falling white channel midline and the .786 retracement of the post-Brexit ramp job. It would have happened on Nov 9 — also known as day 87, which would have been one day off from the 2007 pattern.
But, of course, ES didn’t hold those losses. Taking a page from the post-Brexit playbook, USDJPY — which had plummeted to 101.18 after Trump was named victor — suddenly soared to 105.88. Fundamental analysts scrambled to come up with a reason why a Trump presidency was suddenly bullish. But, to anyone with eyes in their head, it was all driven by the USDJPY.
We have to go all the way back to Aug 2015 to see USDJPY make a similar move. After plunging through the 120.11 Fib level to 116.14, it rebounded 4.24 the next day. It precipitated a 265-pt drop in SPX that was only brought under control by USDJPY recovering to the 120.11 Fib and spending the next 4 1/2 months at or above it.
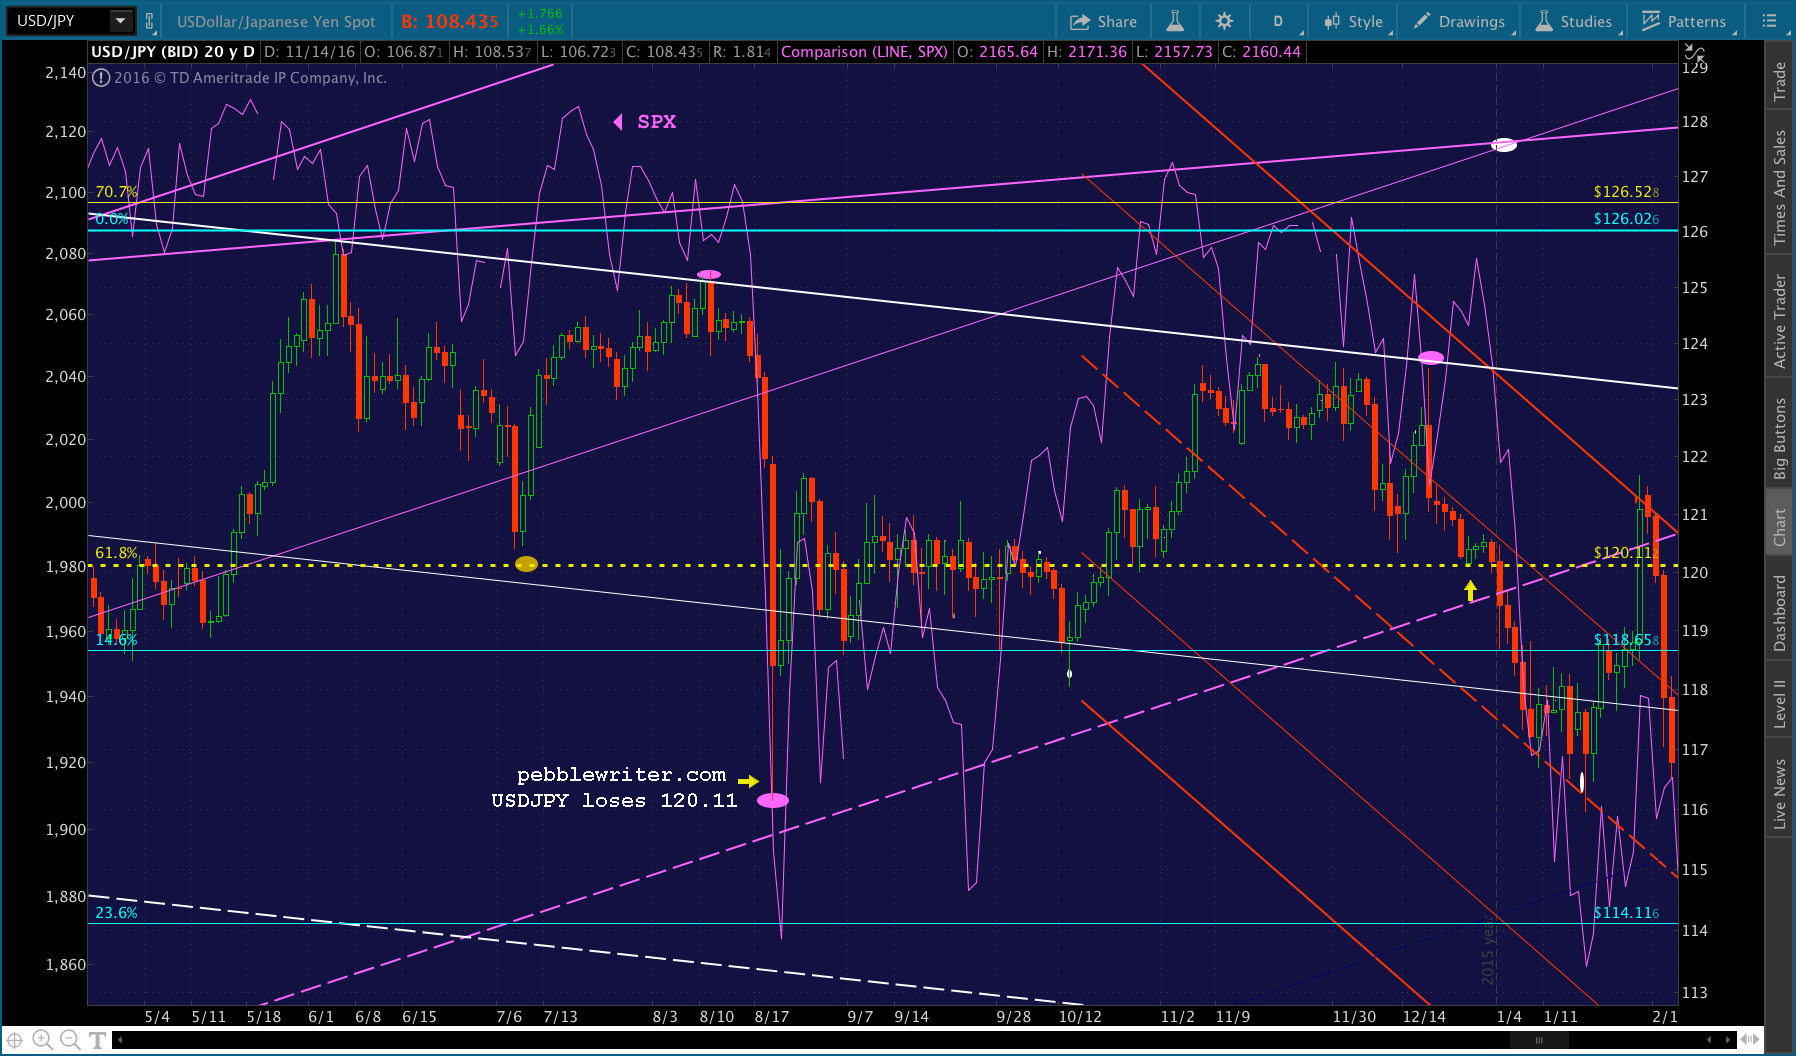 Note that the falling red channel which began taking shape on Oct 15, 2015 in the above chart is the very same one that USDJPY finally broke out of on Oct 4, 2016. It was the very same time that SPX was struggling to break out of its falling white channel and establish a higher high as it did on Day 64 in 2007.
Okay, enough creepy charts that go bump in the night. Hopefully by now, everyone realizes that TPTB have been propping up stocks by elevating either USDJPY or CL (and frequently hammering VIX at key inflection points.)
We’re at one of those inflection points right now. The election prop job was so intense that SPX broke out of the falling white channel. Rule #1 in TPTB Playbook is Defend New Highs at All Costs (no matter how ridiculous the circumstances were that achieved them.) And, that’s what we’ve seen so far.
USDJPY has continued to rally, topping the July 21 highs earlier this morning. Between the yen’s and the euro’s weakness, DX is closing in on its Dec 3, 2015 highs.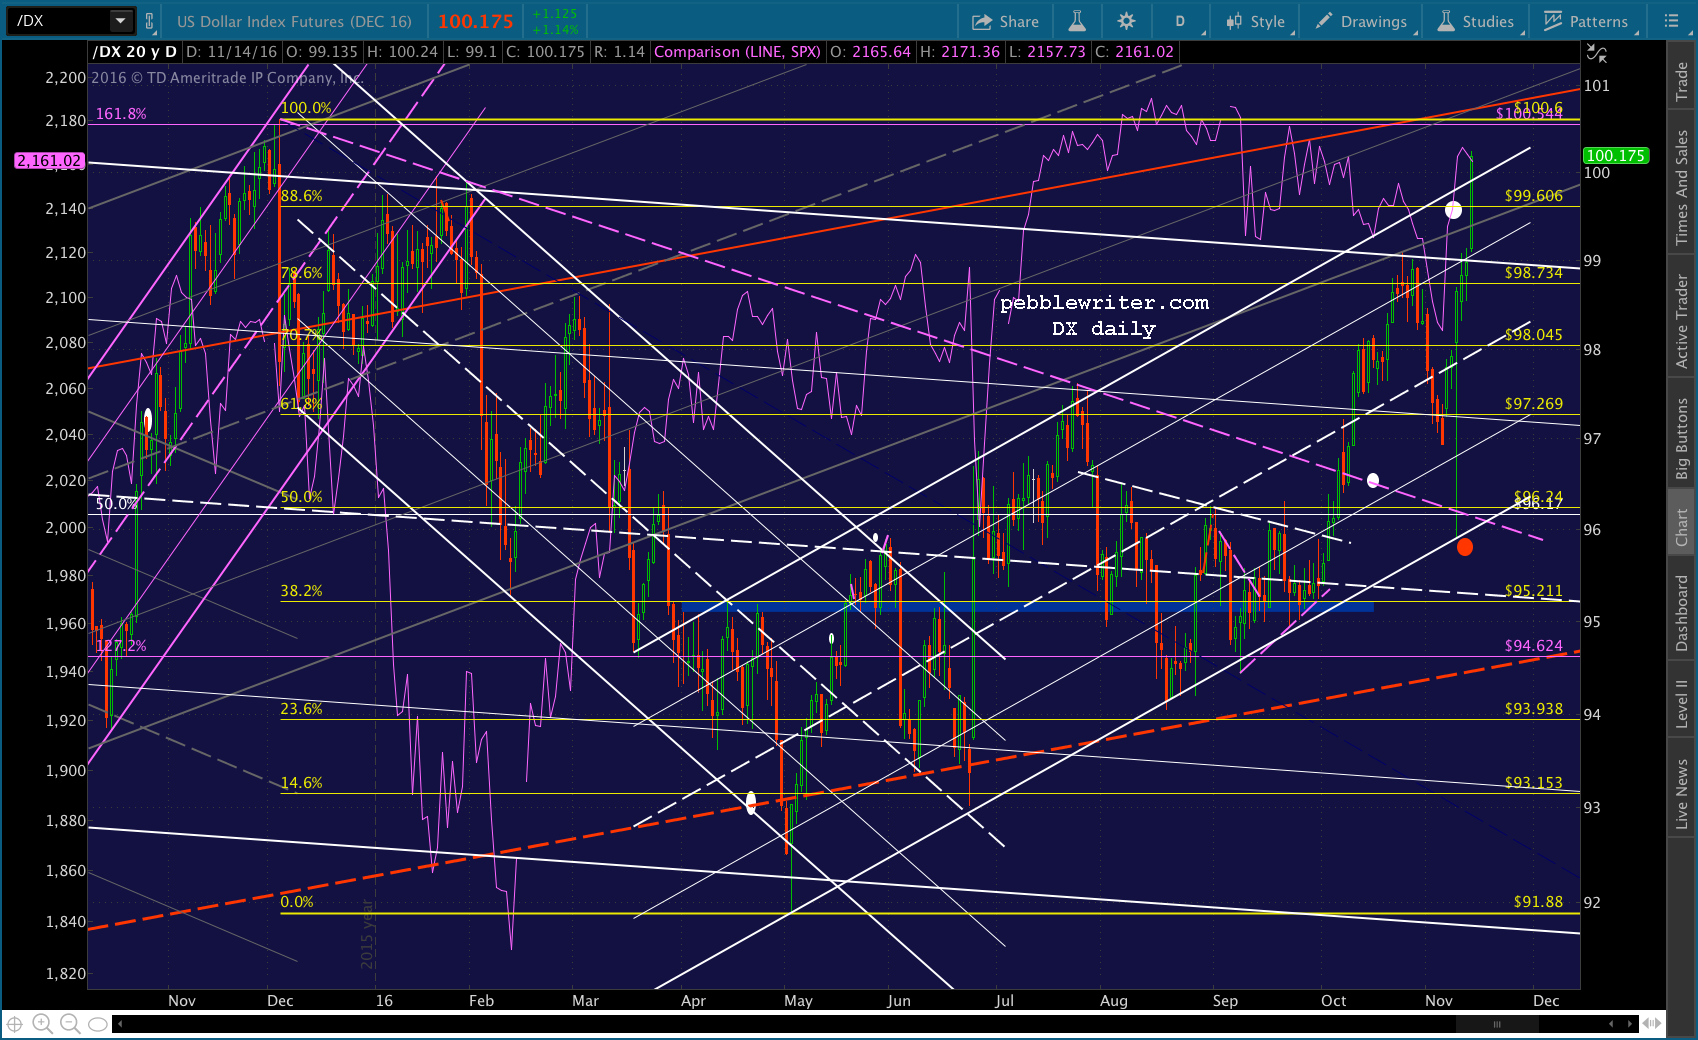 Remember, those highs themselves came very close to topping the Mar 13, 2015 highs…
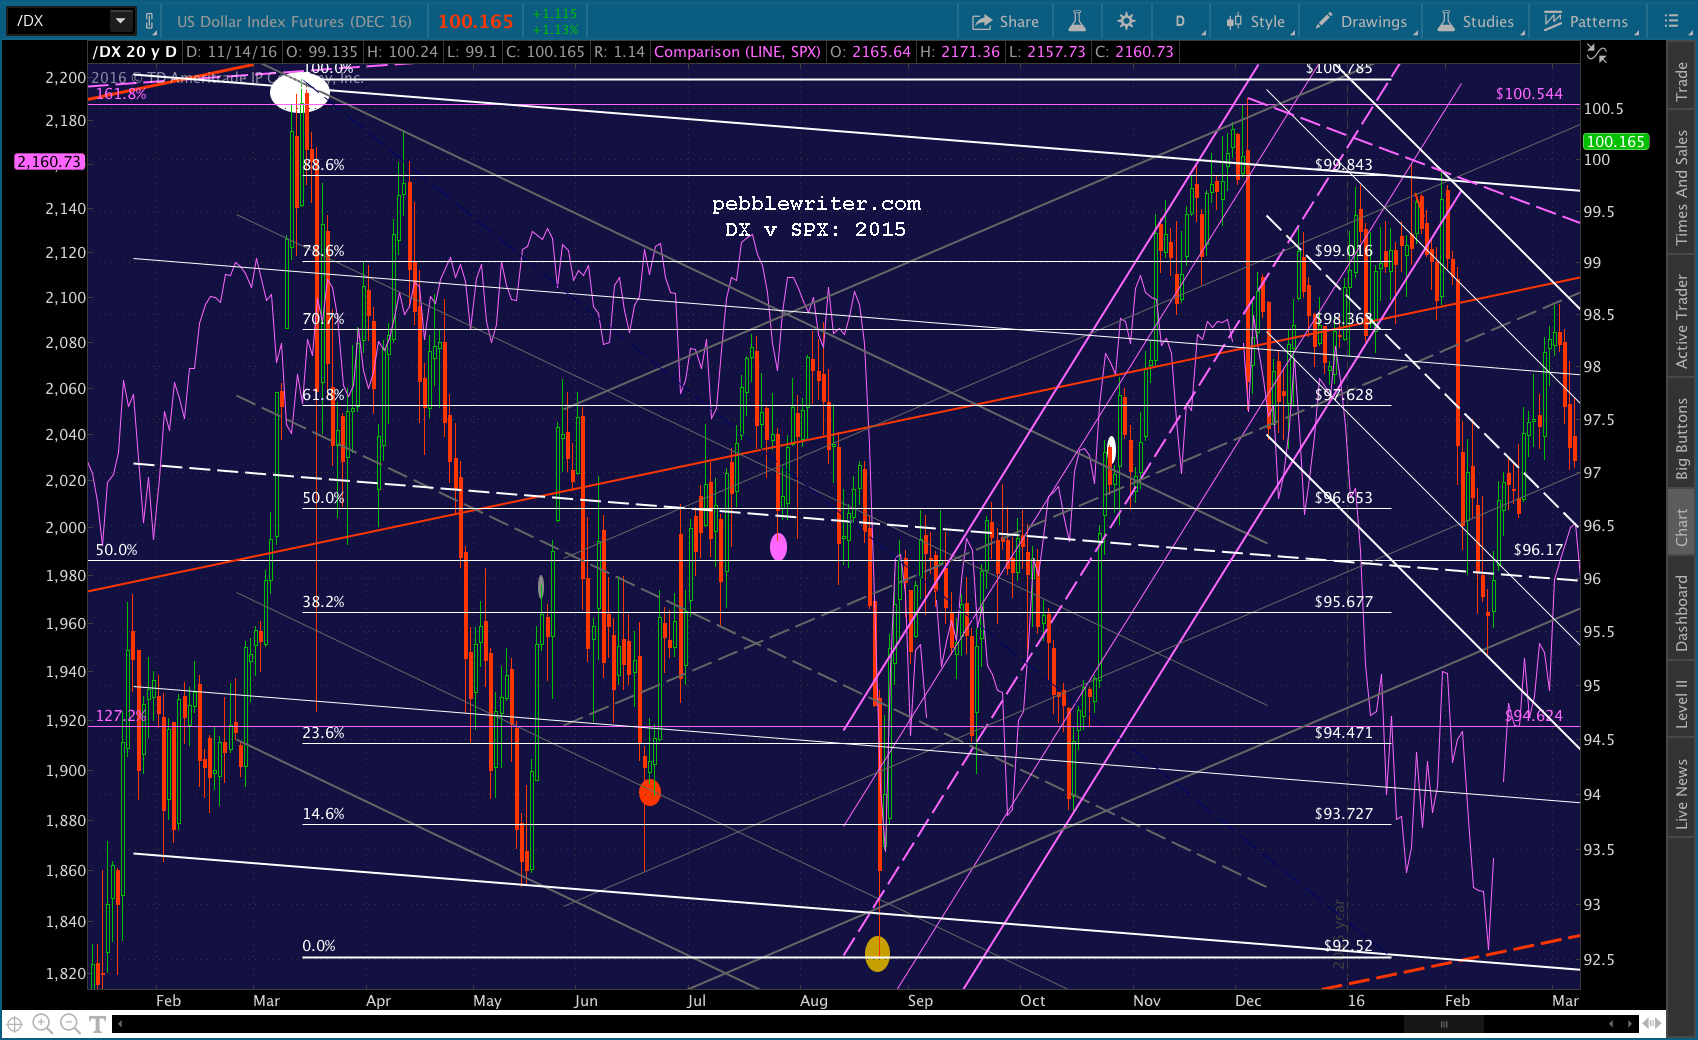 …and, as such, were instrumental in propping up SPX through the end of 2015 (the falling white channel between Oct-Dec.) On Oct 23, the same day that DX broke out of its falling gray channel, SPX was able to pop back above its SMA200. It didn’t make new highs, but it delayed the 250-pt drop until January 2016 when it wouldn’t affect the headline 2015 “market” performance.
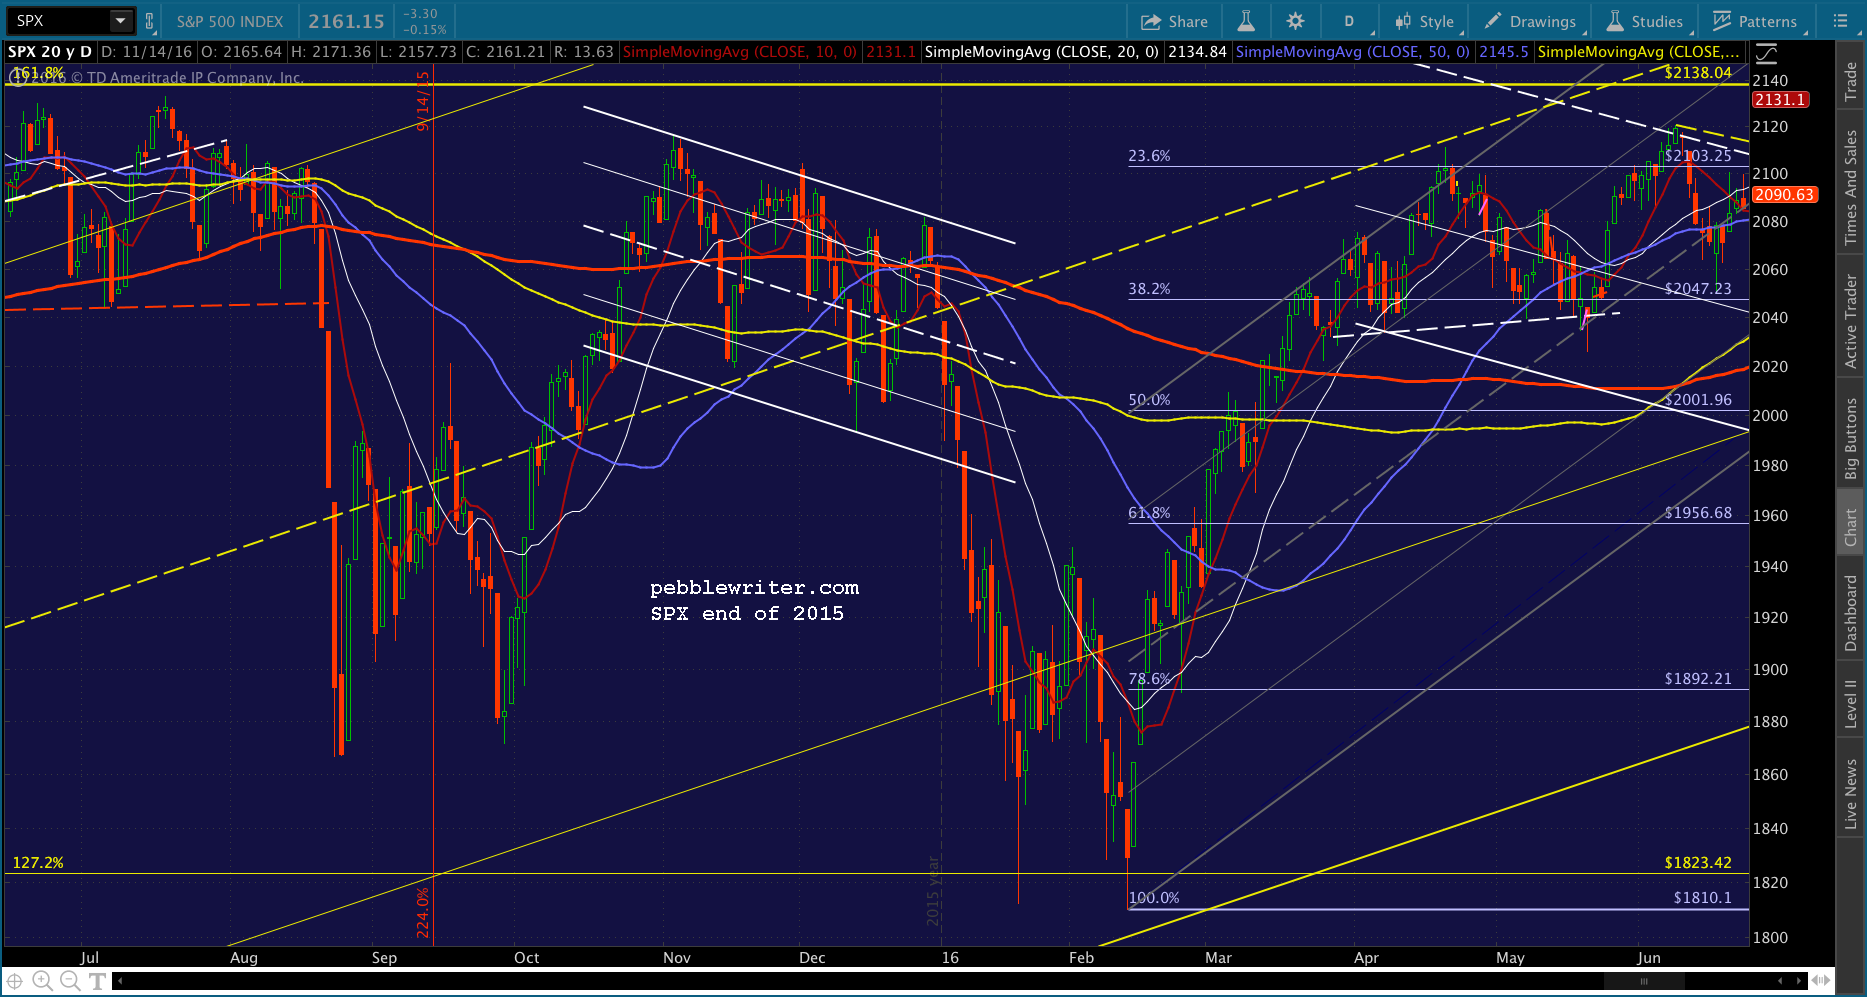 It enabled SPX to turn in a 36-pt (1.7%) loss for 2015 instead of the 257-pt (12.4%) loss which would have occurred had SPX been allowed to fall to 1823 in December instead of January. When you toss in dividends, 2015 was actually slightly positive — which was what mattered to TPTB who rely on positive returns to prevent the house of cards from toppling.
We can expect they feel the same a year later. SPX ended 2015 at 2043.94, and it currently sits at 2160ish — a 5.7% gain. Dec 30 would be Day 121 in our count — just a few days shy of the Day 127 peak in 2007. A return to the Aug 15 high of 2193.81 would result in a 7.3% price gain for the year. A climb to the red 1.272 at 2223.74 would yield an 8.8% gain.
 We continue to need a solid backtest on the falling white channel — which is probably going to happen today or tomorrow at 2146-2148. But, if the analog is to play out well, it would continue dropping to 2138-2142 until Nov 22 and then start edging higher. Something like this:
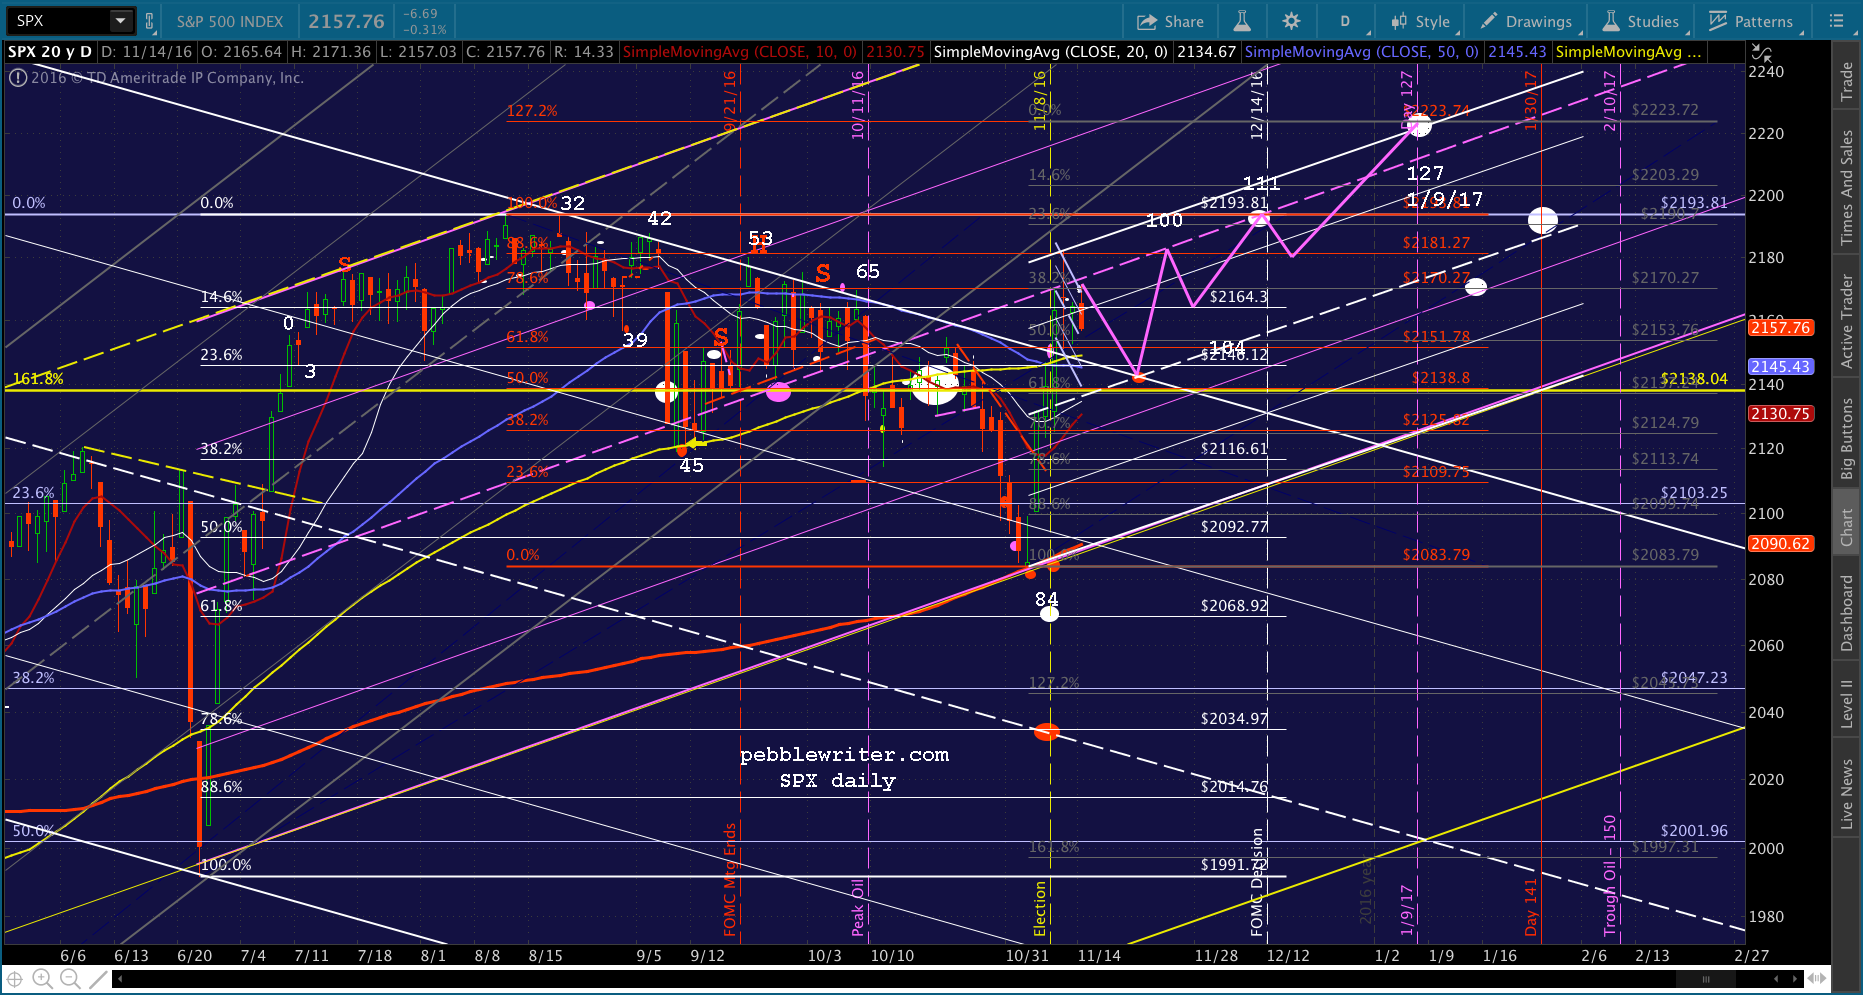 This particular path would require several iffy events working out. First, a Fed rate hike in December would screw the pooch. I don’t see any way that it wouldn’t. And, the only way the Fed could get away with not raising rates is if markets are crazy volatile and scary at the time. That would seemingly require a more negative path between now and Dec 14 — not the bullish meltup which occurred between days 90 and 111 in 2007.
Another potential problem with this forecast is CL, which needs to drop another 6 points between now and the end of the year in order to be in sync with 2015. But, CL rallied between Nov 13 and Nov 24 last year, so it should be able to do the same this year without reservations.
And, then there’s USDJPY — which theoretically can’t go up forever. It’s already past the point of reasonableness and is closing in on additional overhead resistance at 108.78 and 109.64. If it levels off or reverses here while CL takes over for the next two weeks, that would probably keep stocks on the rise. CL could then resume dropping after USDJPY has declined to good support at, say, 105.78 or just the SMA200.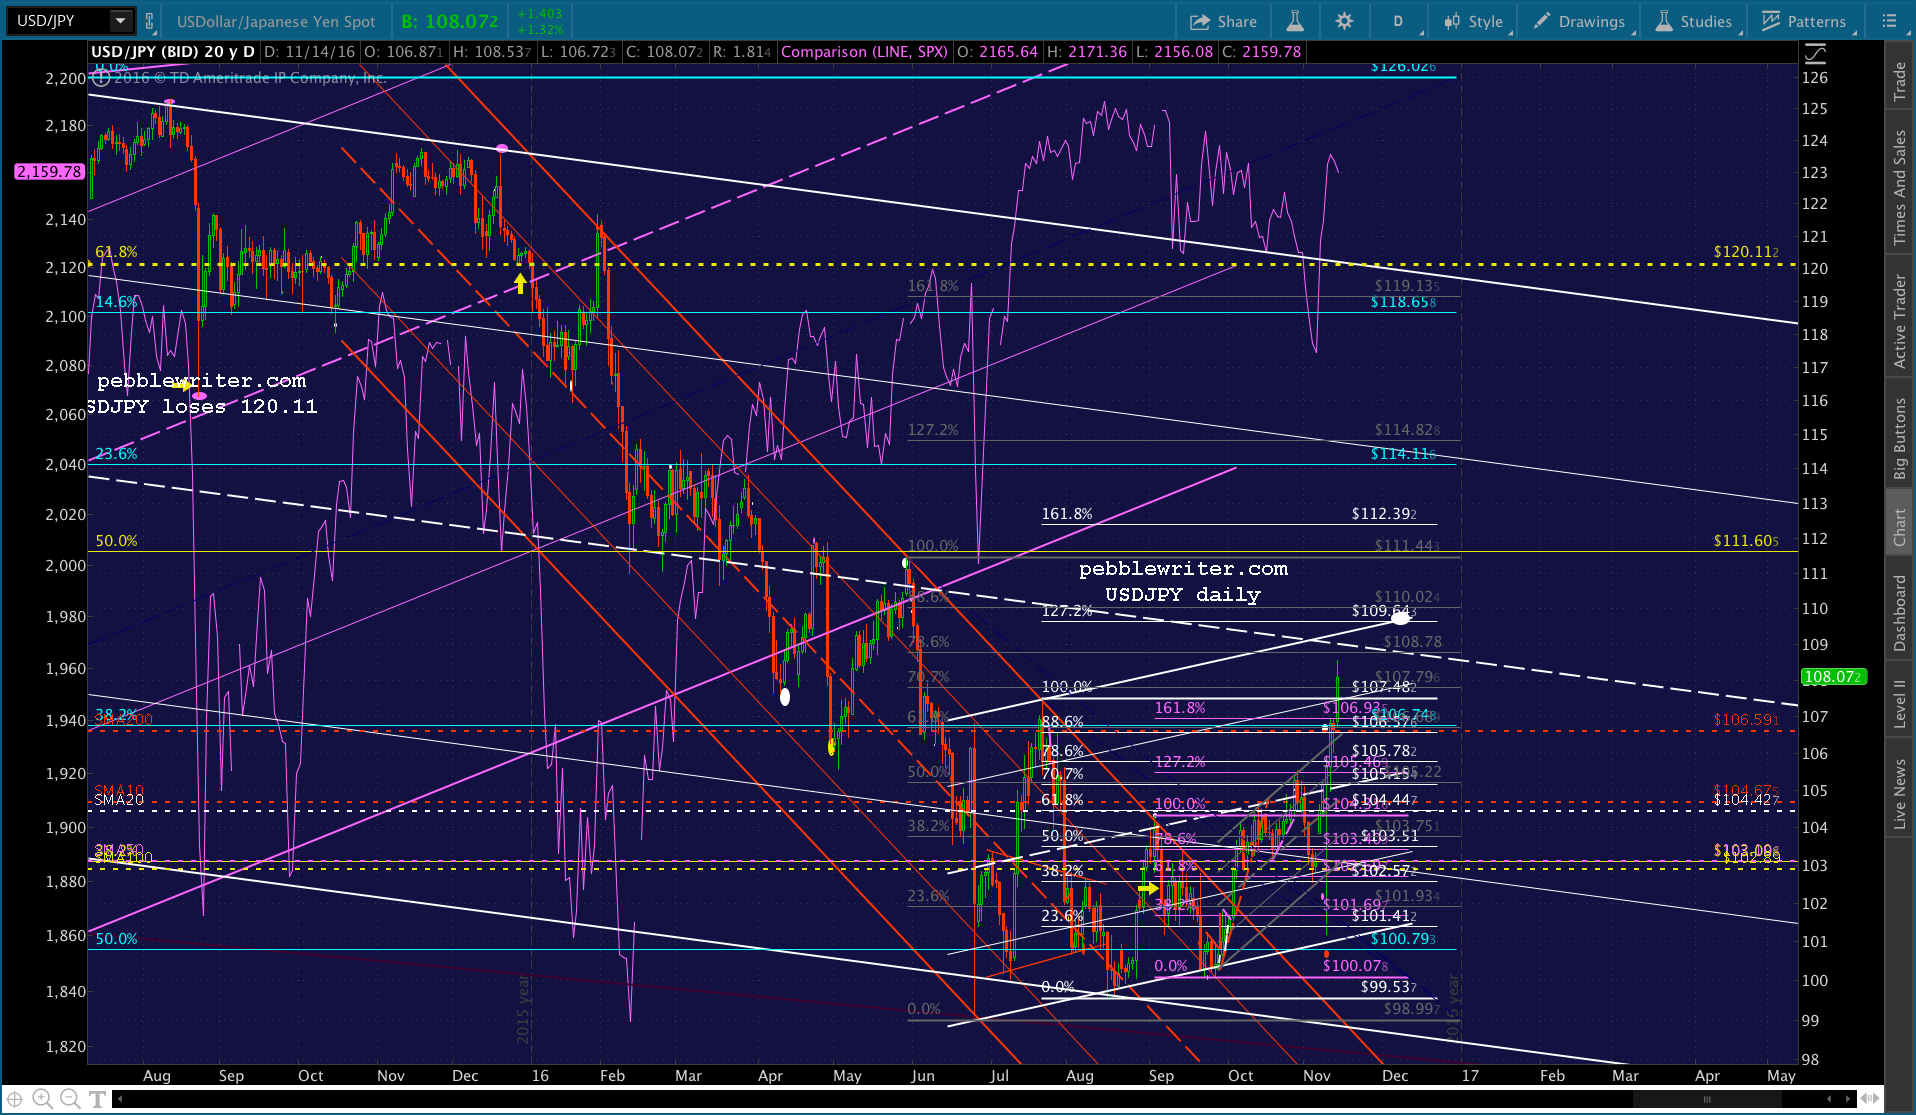 But, at some point, investors are going to want the BoJ to put up or shut up. It might be easier for them to believe in a higher USDJPY if CL continues dropping to offset it.
Another path we’ve discussed from time to time is via the EURUSD. It broke down through support today, tumbling through our next downside target at 1.0756 and closing in on the white Flag Pattern bottom at 1.06ish. If it were to drop through the Flag bottom and reach our yellow target at 1.02ish, that would presumably be plenty enough to push DX up to or, more likely, past its 2015 highs.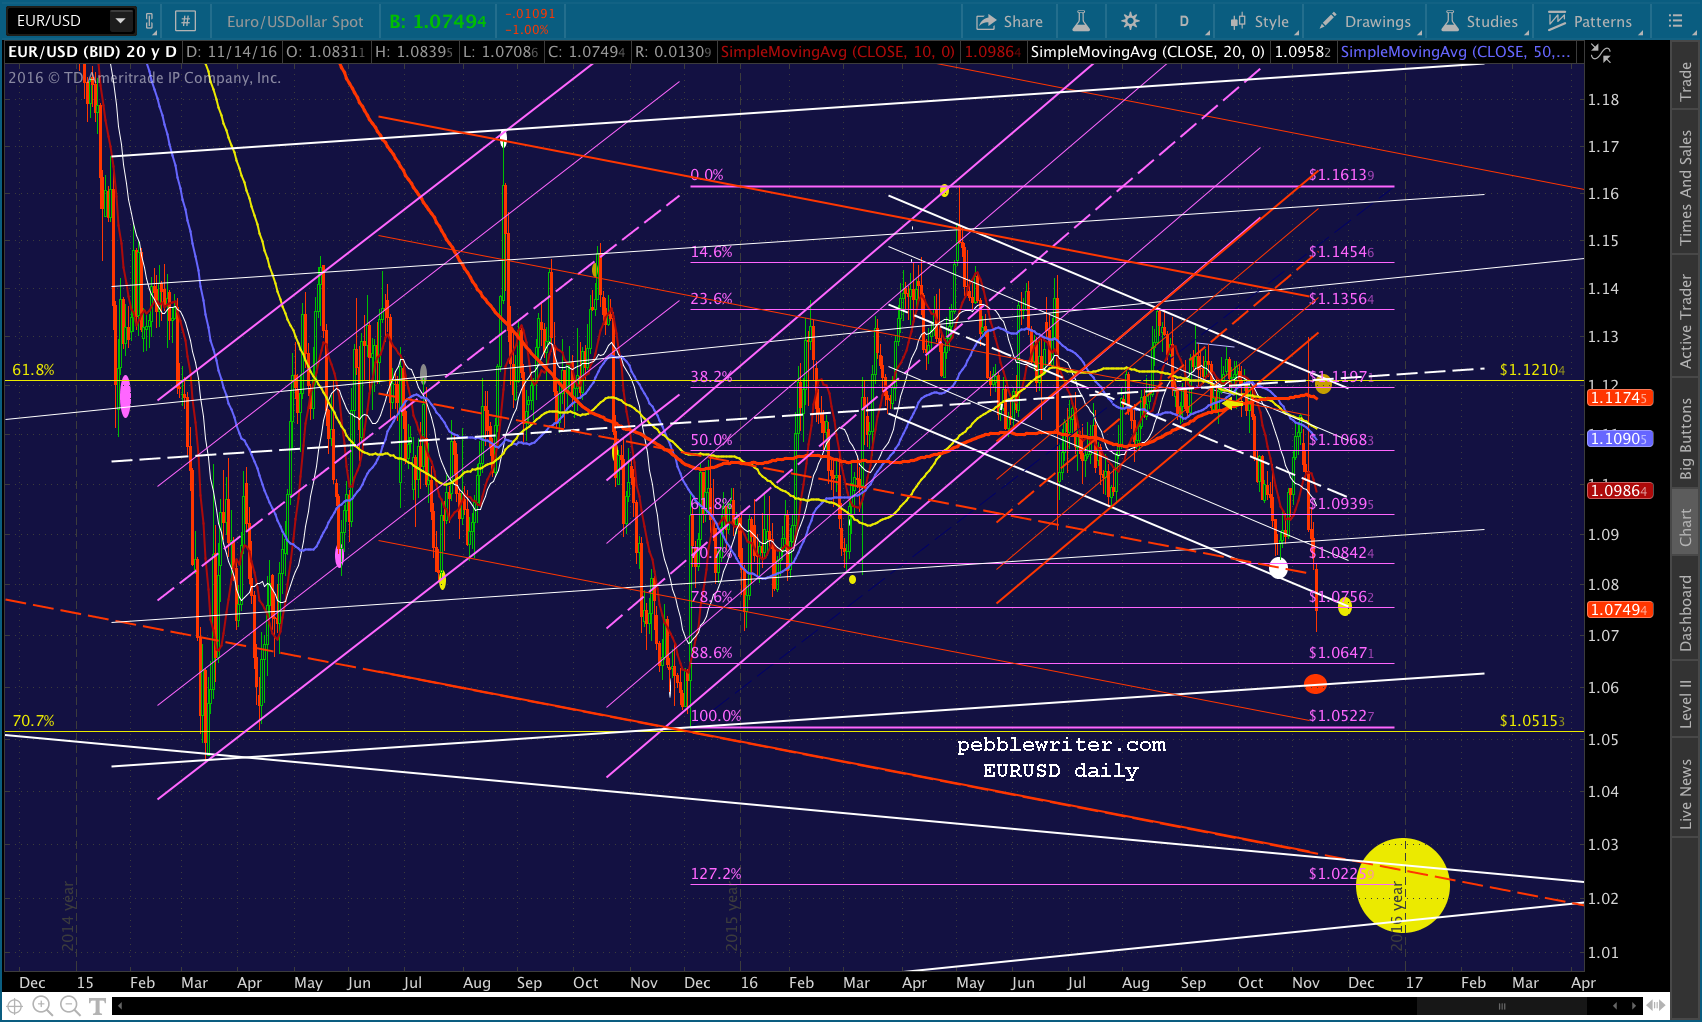
This isn’t at all far fetched. Consider that GC’s channel finally broke down two days ago and has potential to 1083 — a 12% drop from here. What better way to finish the year out?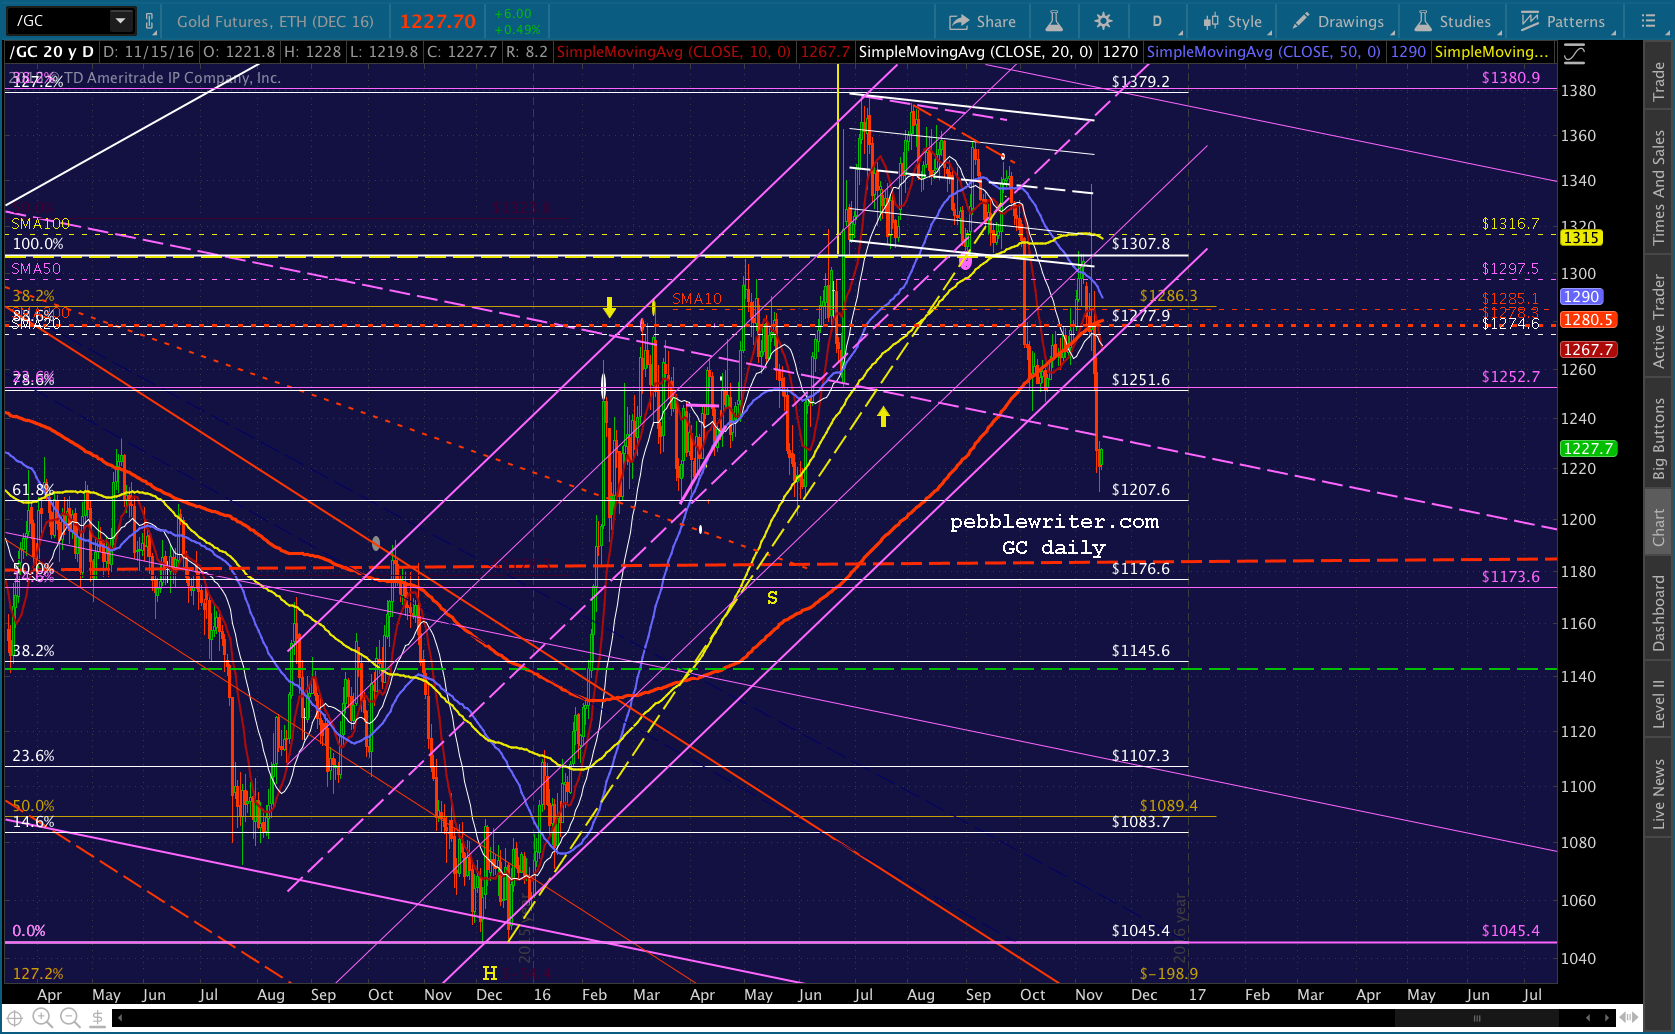
Call it a euro carry trade if you like. But, it would have a strong impact on the US dollar which would presumably drive stocks higher. It worked pretty well in February, but that was during a period of strong CL appreciation. So, I’m not convinced it would offset the alarms that would go off, warning of an impending EZ collapse.
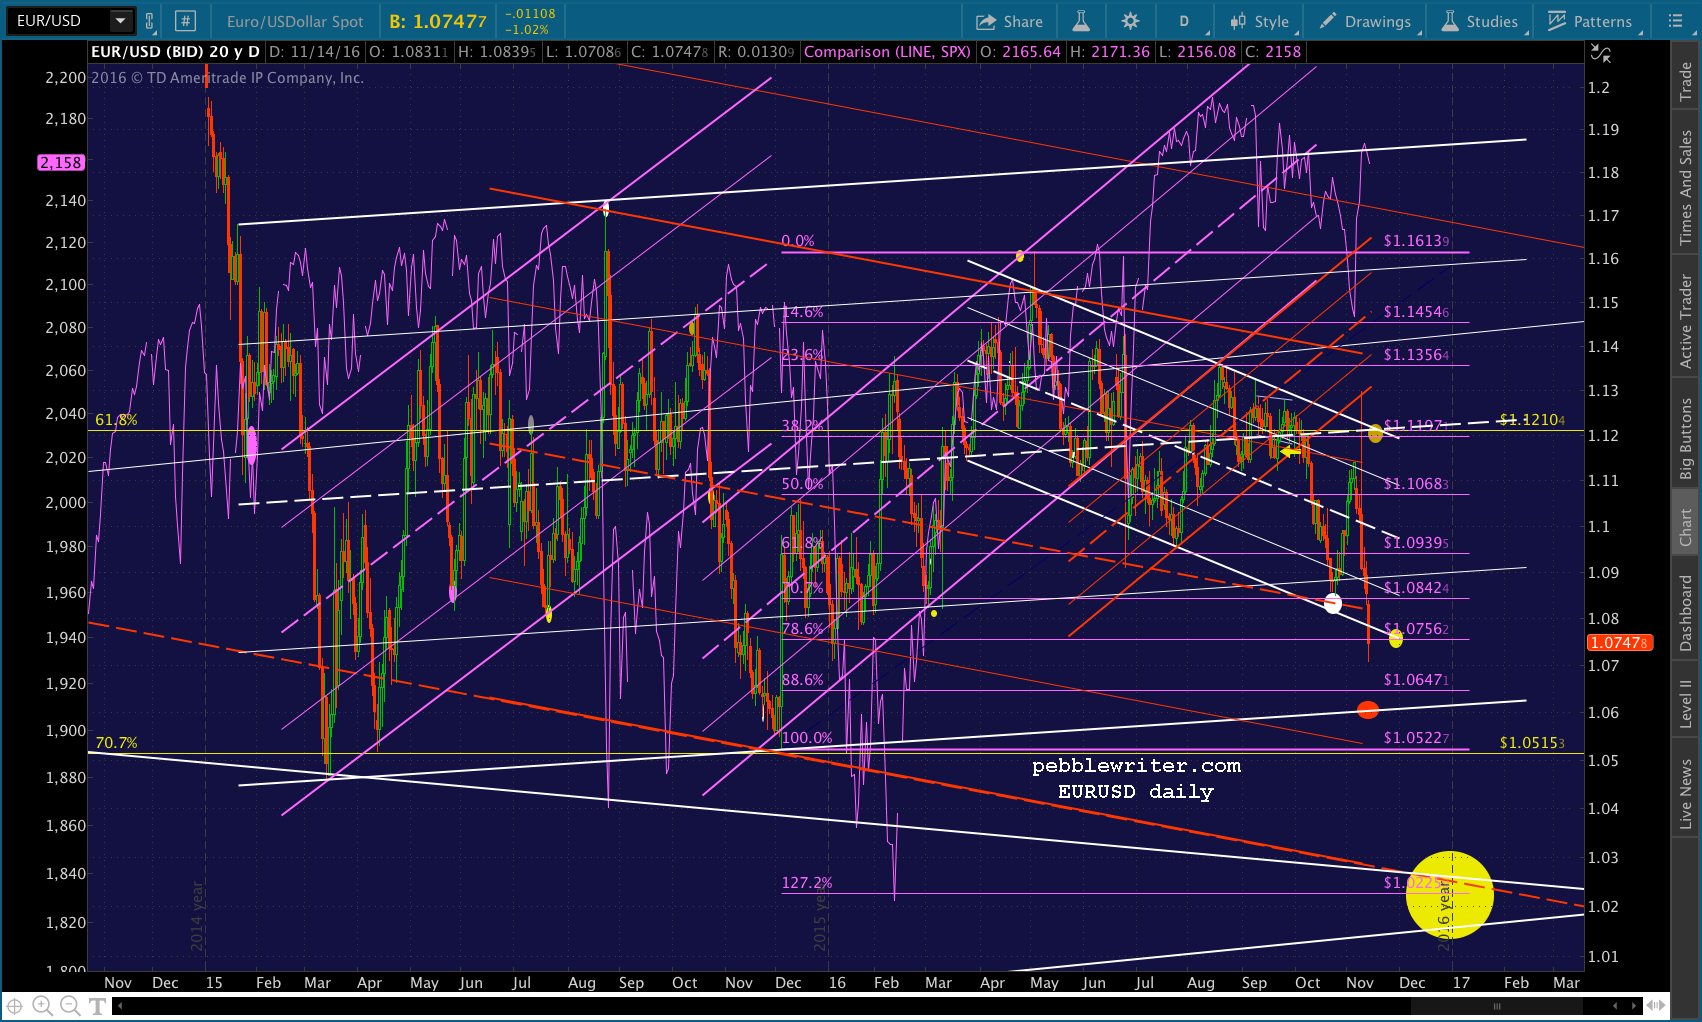 As we’ve discussed before, DX appreciation can be good for stocks if it’s happening because other currencies are devaluing. As a net importer, a cheaper yen or euro are good for the US. If DX soars because of a flight to quality in the midst of a panic, it’s a different beast altogether.
That’s the upside case. Let’s talk downside for a moment. Say the Nov 9 breakout doesn’t hold. Then what?
I discussed last week the possibility that Nov 9’s breakout was akin to May 31, 2011. But, that breakout reversed the next day without any support from algos, giving up 31 points on Jun 1 and shedding another 55 over the next two weeks. If SPX were to drop back into the falling white channel, I’d be the first to cheer the return to sanity. And, I’d start pounding the table on 2068, with 2015 by February.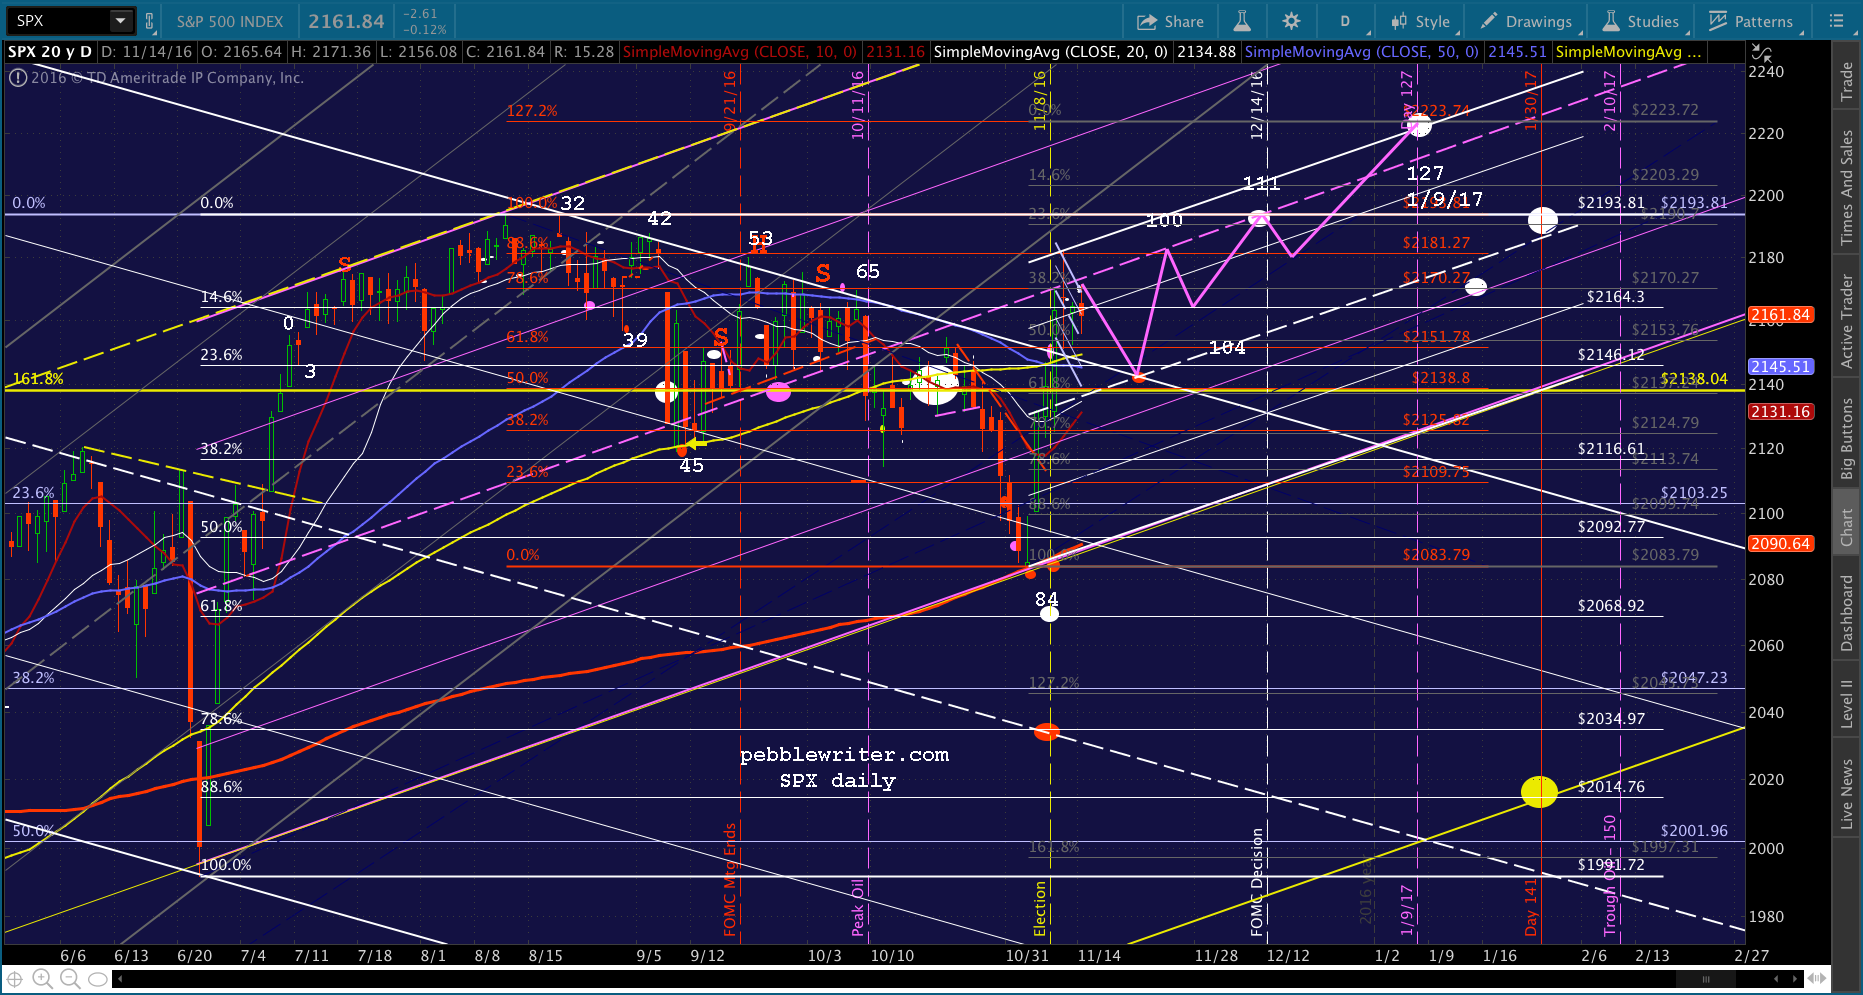 So far, however, TPTB have proven themselves to be pretty deft at propping stocks up. So, we’ll cross that bridge if/when we come to it. The warning sign is the SMA100, currently around 2149.31.
If you want to consider an “apocalyptic” angle, it gets much worse. Consider what the 2007 top at 1576.09 represented: an effort to top the 2000 high of 1552.87. It did, by all of 23.22 points — 1.5%. In the process, it created a falling white channel that started at the point at which it exceeded the .886 and tied in Days 88 and 197 on the downside, the Days 127 and 169 on the upside, and enough midline tags (especially Day 158) to look legit.
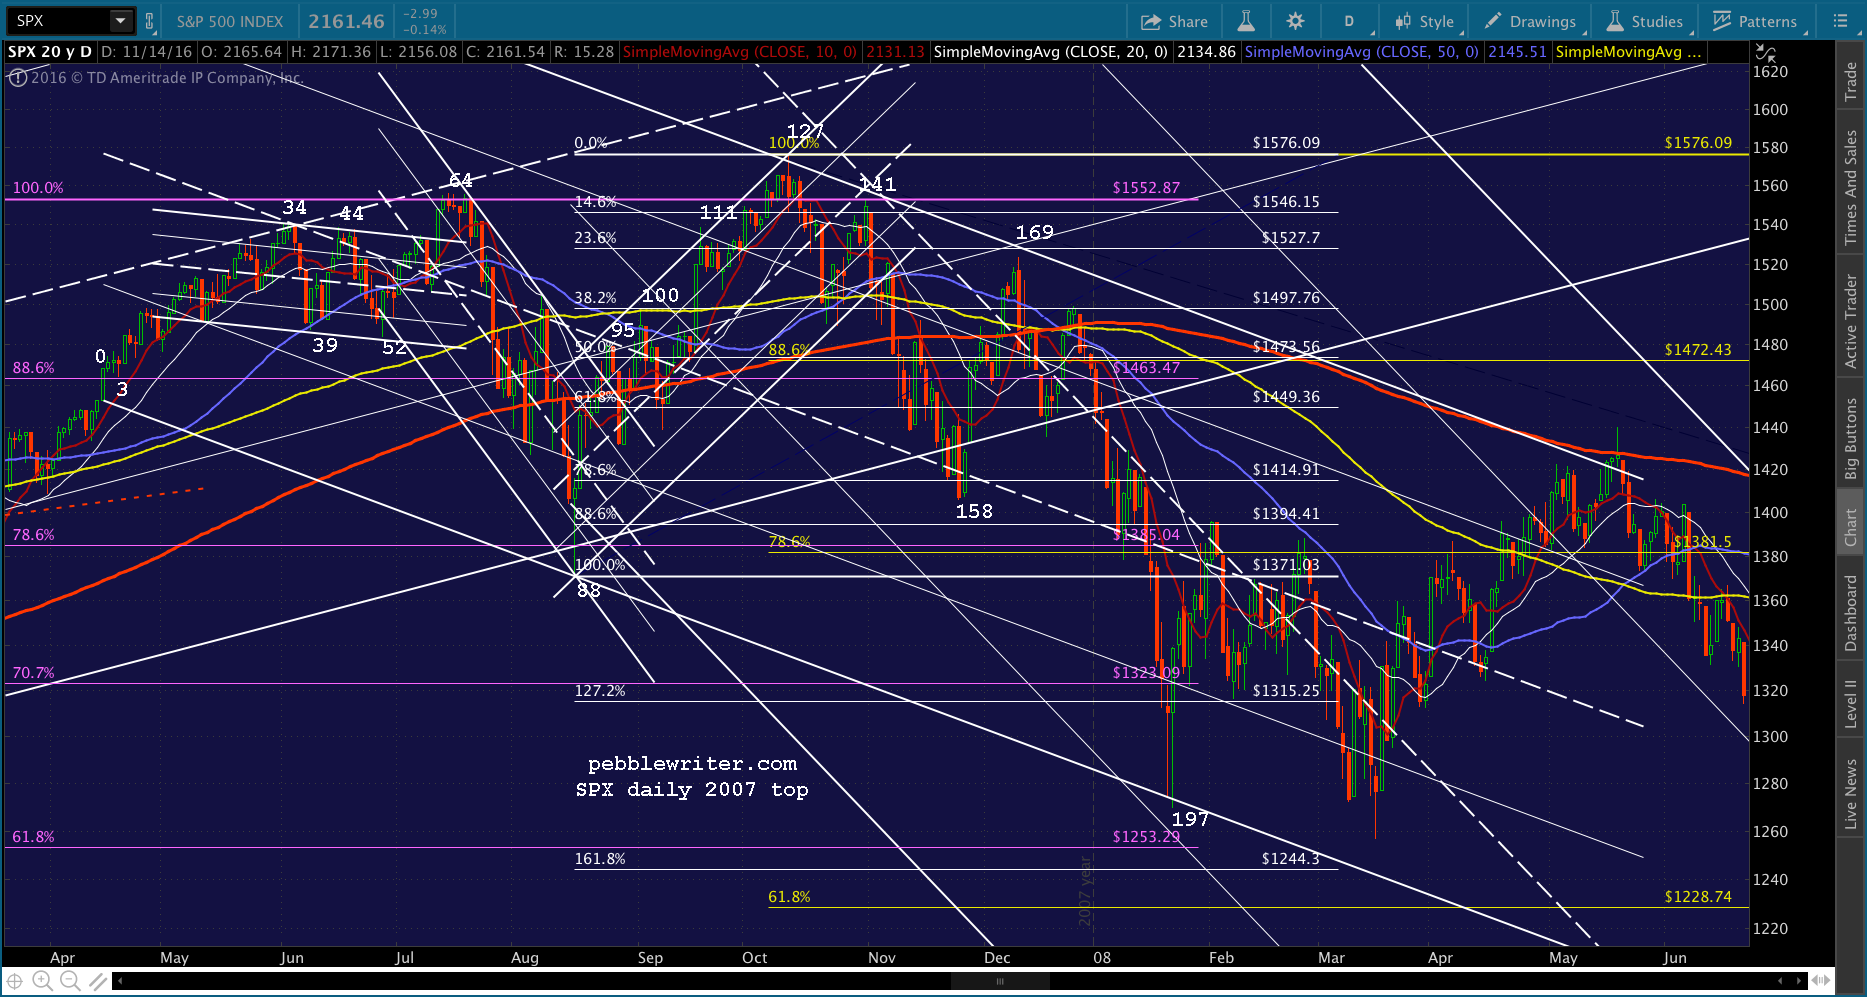 It didn’t really start falling until the rising white channel broke down on Jan 3. In other words, it served to preserve the year’s gains until after they were in the record book.
 If 2016 were to follow the same path, we’d see day 127 at 2226 — close enough to the red 1.272 at 2223.74 in my book — but, a bigger selloff in keeping with the resulting falling purple channel to 2100 (purple midline and gray .886) when oil bottoms out around Feb 10 and either 2063 or 2000 around Day 197 on Apr 20.
  There are countless lower targets if things get out of hand — including 1848 and 1776 (I know… cute huh?) which would be a 20% correction from 2223.
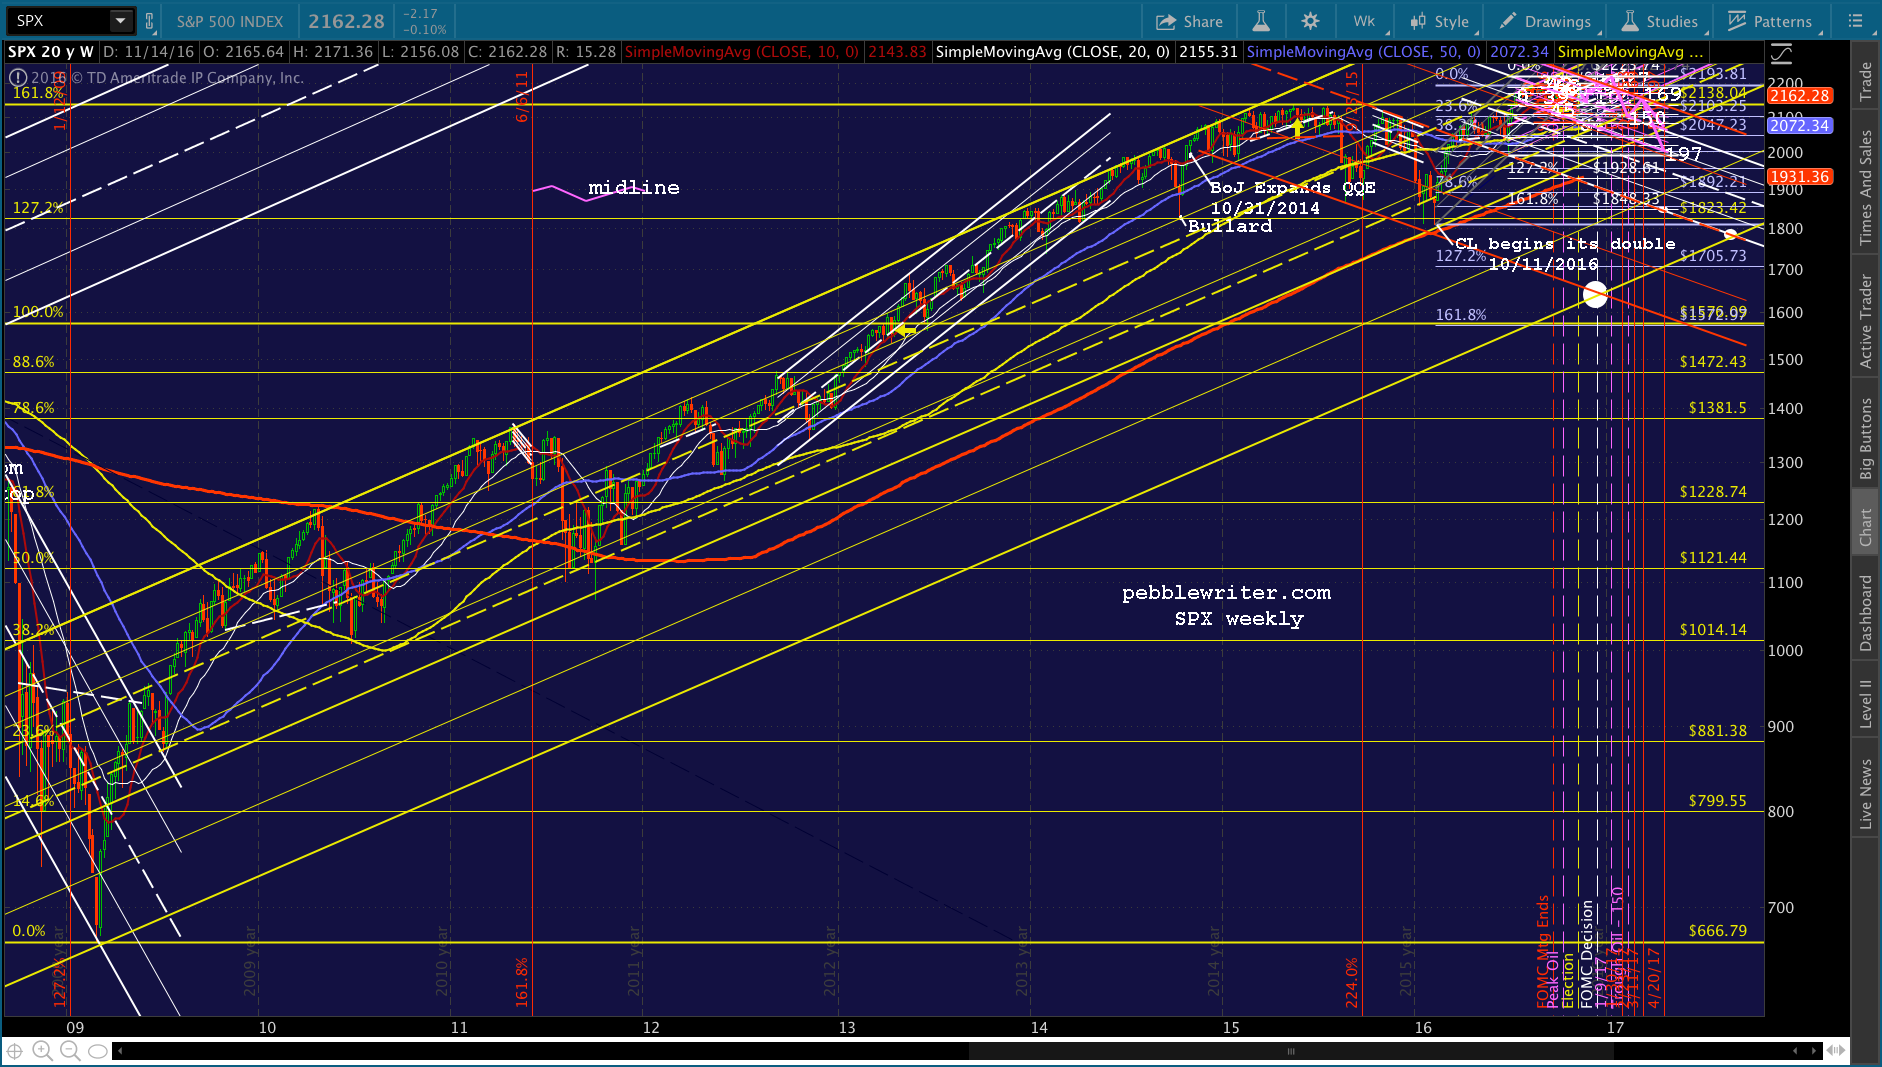
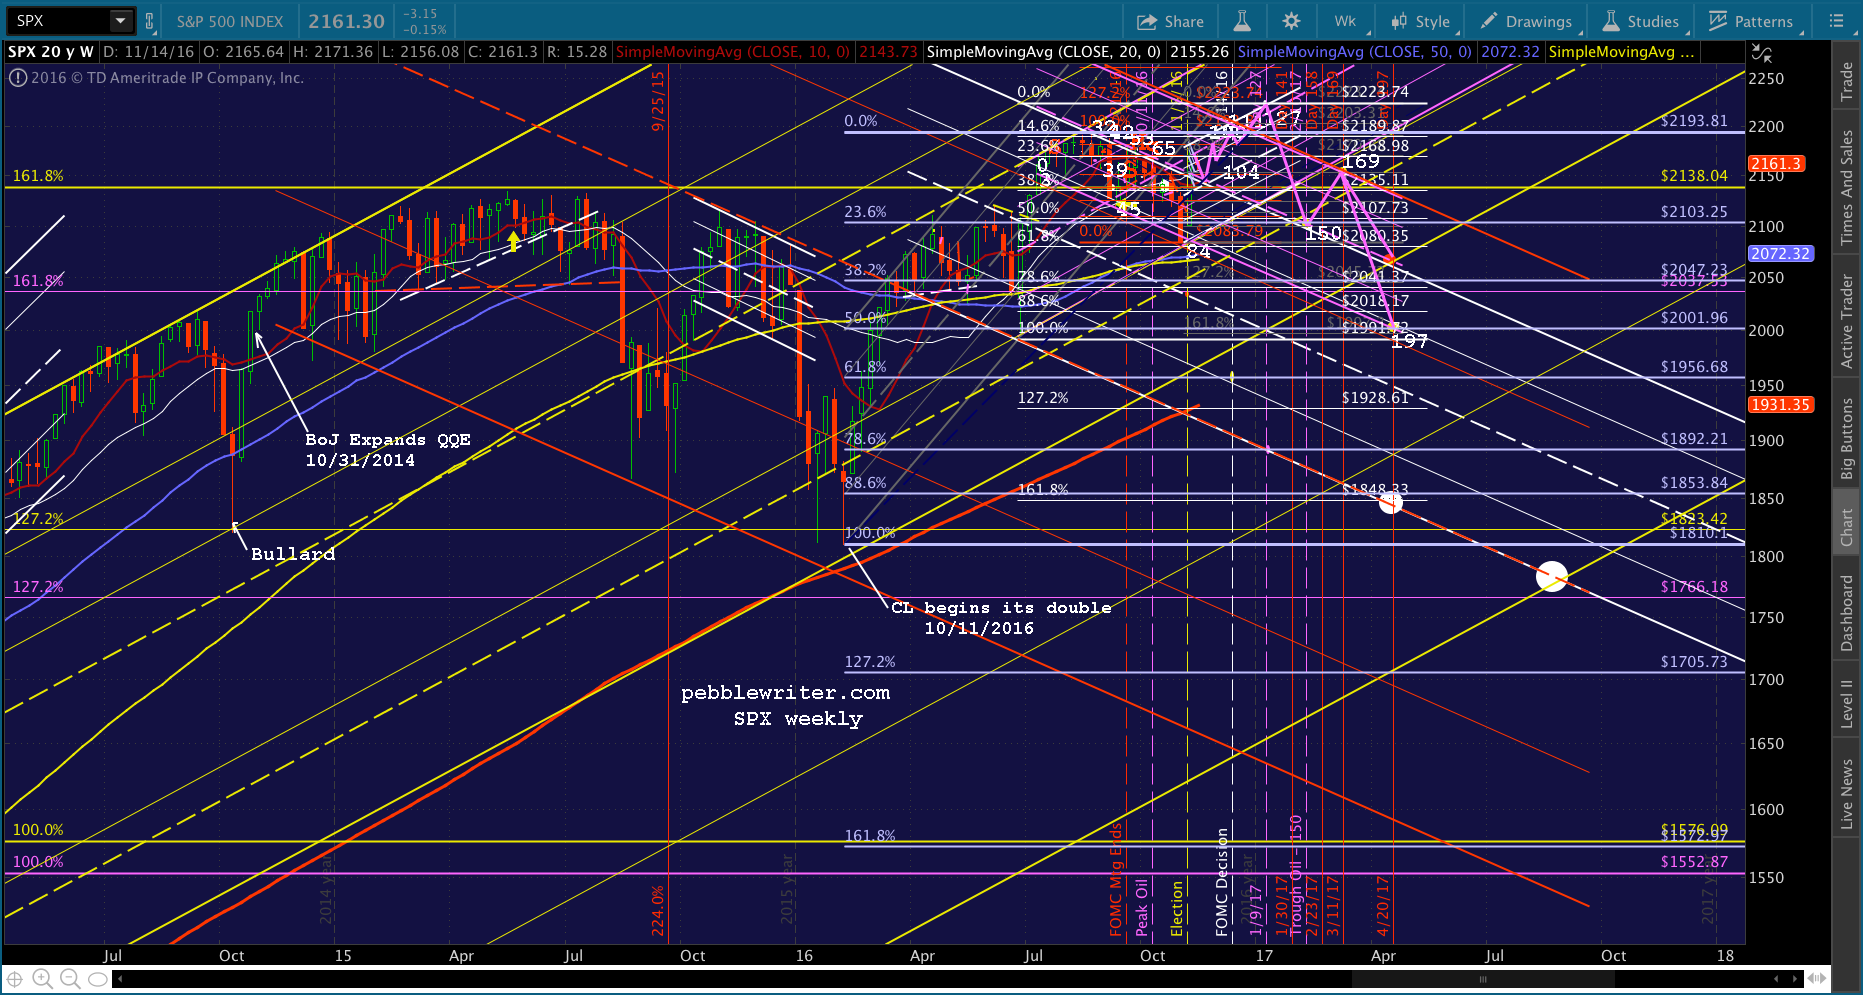 And, if we wanted to get real bearish, I’d point out that the bottom of the expanded rising yellow channel is currently down around 1650. But, after watching TPTB guard 1823 so jealously, it’s hard to imagine them letting things get that far out of control.
I imagine the Fed would go full BoJ on us and start buying stocks before they let that happen. Fun to think about, anyways.
 That’s about it for the Big Picture which, if you’re still reading, is quite obviously nothing but a brain dump. If you’re Aspergery like yours truly, this has been fun. If you just want to know what time it is, rather than how the watch works, I commend you for your patience. The most likely path is probably the most bullish: a rise to 2223 by FOMC day on Dec 14, followed by a modest selloff into the close, and the real action to come after 2016 is in the books.
Stay tuned.
UPDATE: 2:53 PM
SPX has bounced around quite a bit today, but hasn’t seen fit to tag the SMA100 yet. I’ll take this as a sign that SPX will settle gradually lower for the next several days until the SMA10 (and, possibly SMA20) have cleared the falling white channel — probably around 2148-2150. It wouldn’t surprise me if it took until next week and the breakout occurred over Thanksgiving. Central planners love low-volume holidays… I’d continue to hold short with relatively loose stops.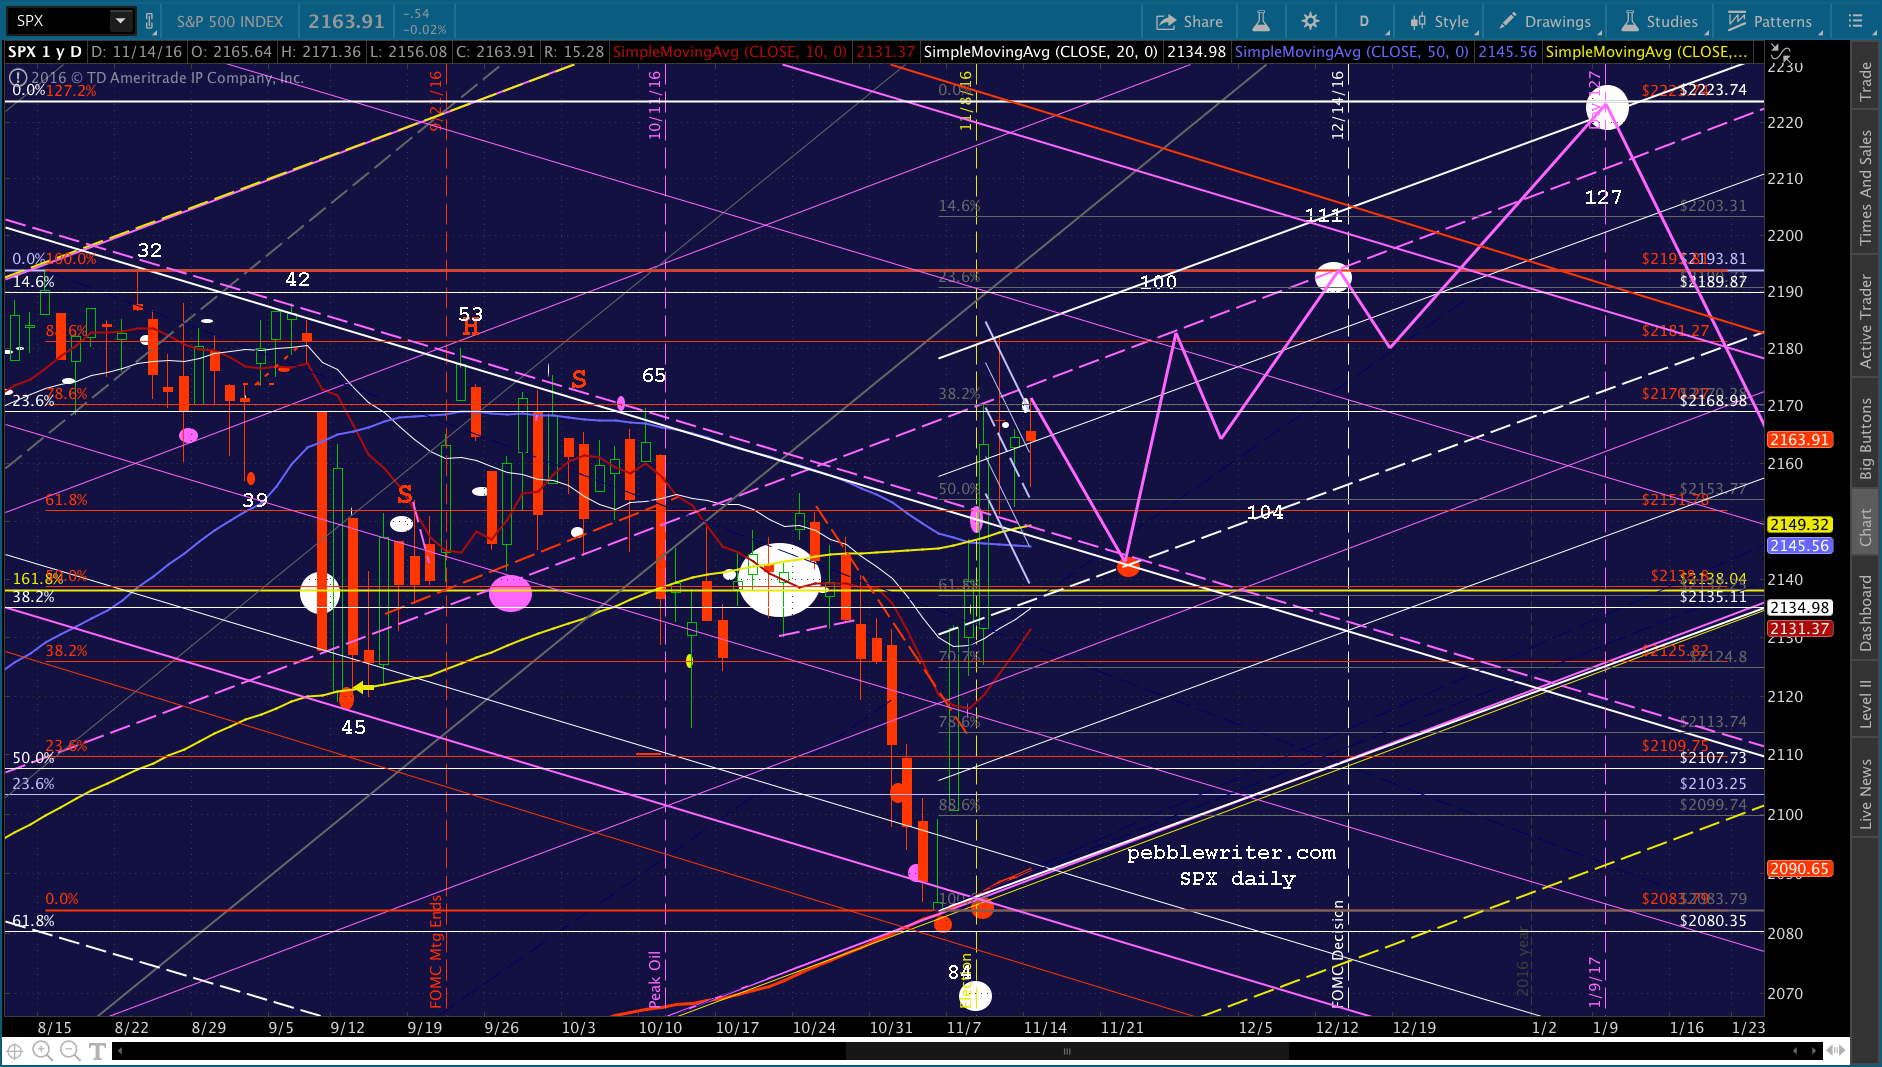 UPDATE: 3:56 PM
Quick update on today’s action so far — a triangle that I imagine will resolve to the downside, backtesting the white channel we just broke out of. Looks like 2146 by tomorrow, and potentially a little lower next week. But, I continue to believe it’ll happen when the SMA10 (currently 2131.39, up from 2127.59 Friday) clears the channel top. Remember, the SMA100 (currently at 2149.33) could get in the way.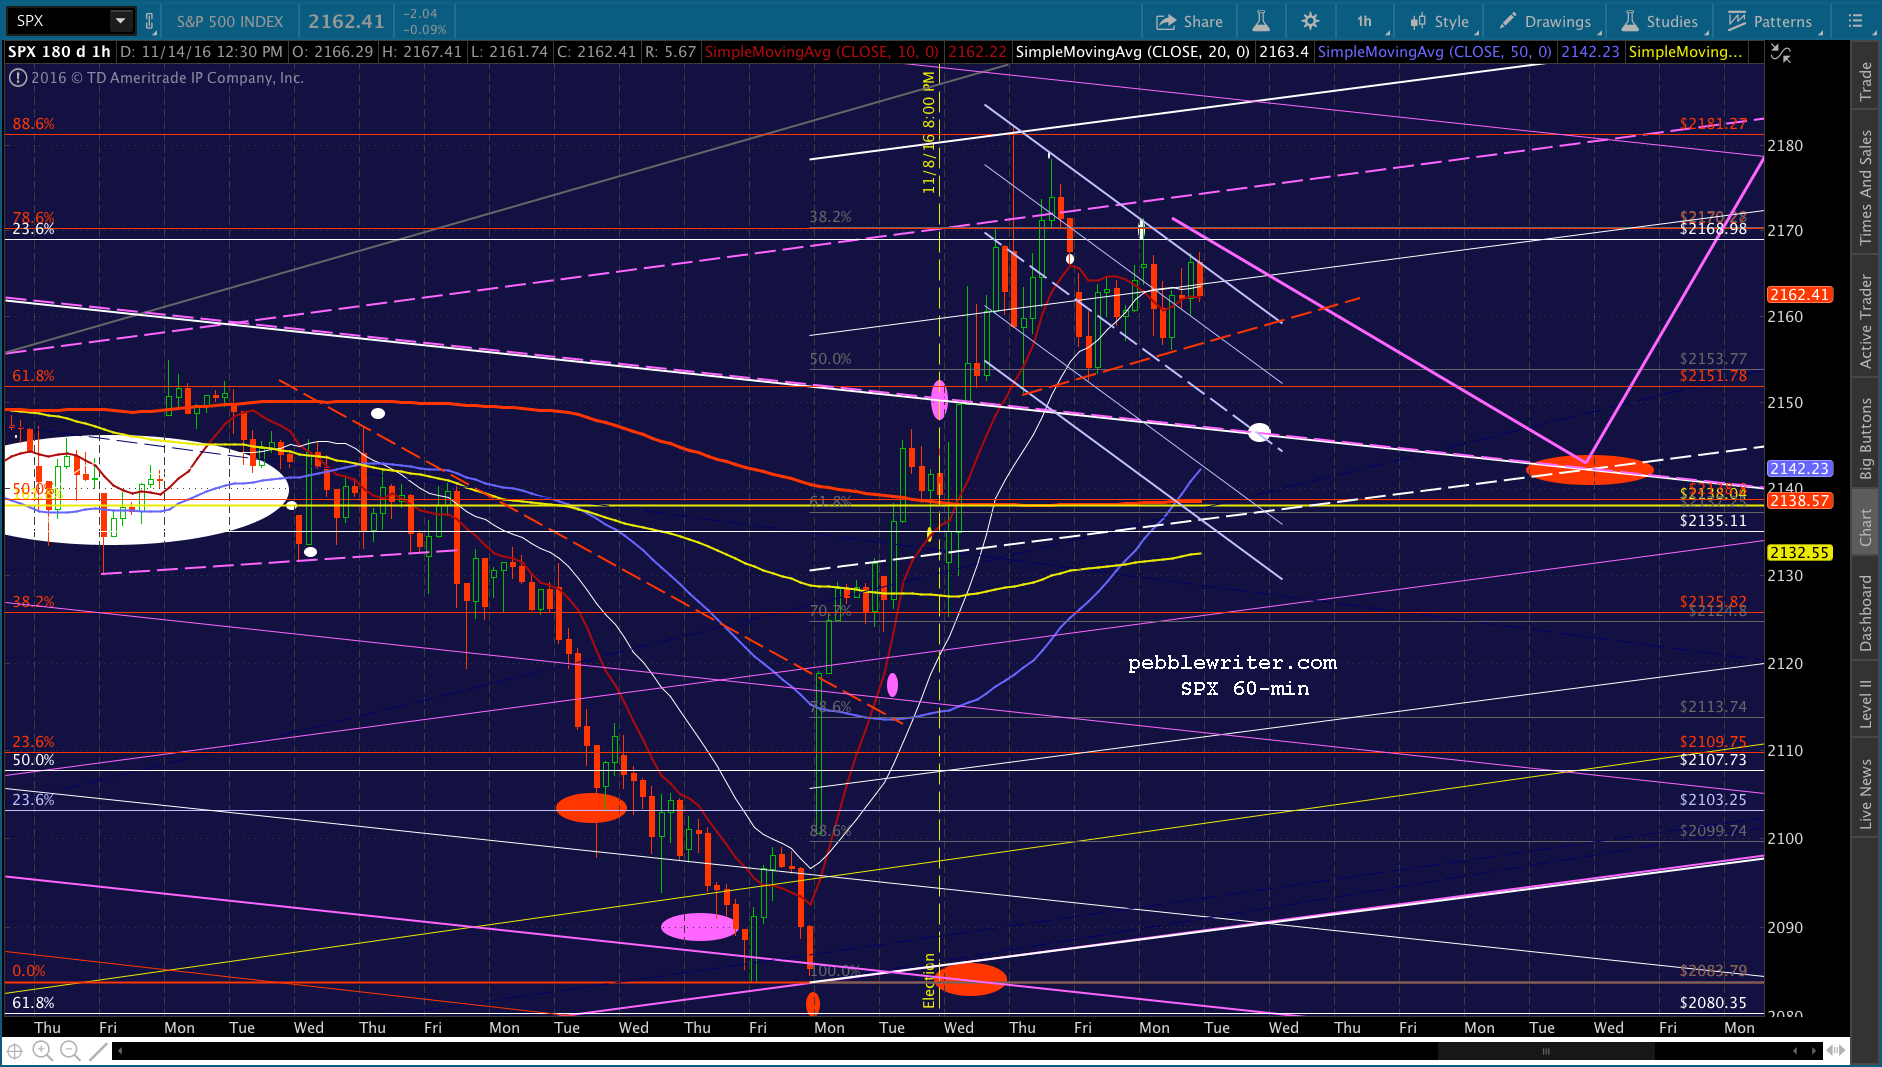 I’d continue to hold short if you’re able to hedge or can handle the overnight gap risk.
Comments
7 responses to “The Big Picture: Nov 14, 2016”
And additionally… will the Italian referendum have any impact whatsoever?
I need to study the issue a little more to offer an informed opinion. My love of Italy aside, my gut reaction is that losing the UK was a much bigger financial threat to the EU than this referendum represents. The UK contributes additional financial stability and liquidity, while Italy detracts.
That is true, but the difference is that Italy is on the Euro. A Euro-zone country leaving could be devastating, however just like brexit, I believe the bigger shock will be when they ACTUALLY leave, not when the results of any referendum are announce (since no one knows how long the process would take).
PW… do you think it is possible that they raise rates by .25 and the market rallies? It would seem to go against economics but when has that stopped the algos… or will the sell-off be simply too strong to prop up (for a short while)?
I guess anything’s possible. Recent experience tells us this is unlikely. So, I would imagine they keep jawboning as though rates will continue to rise in order to support the DX and USDJPY in particular. IMO, they want the dollar higher without having to actually pay higher interest rates.
PW,
Maybe I didn’t search around your site good enough, but what is the difference between your different colored targets?
Great question. There’s rarely any significance to the color. Though, when I have time and there are too many targets on the chart, I try to use yellow to represent a level requiring caution and red to signify a level representing potential danger.