

Ultra low interest rates don’t do much for traditional banking earnings, but they’re pretty fantastic for highly leveraged banks such as Goldman that are only too happy to front run the tsunami of Fed liquidity injections.
Between GS and more positive vaccine news (Moderna) the futures have pushed to higher highs, settling the question as to which of the deep retracements is the ultimate upside target. Note that the yellow channel midline served as a springboard yet again… …as did VIX’s daily drop to/through trend line support.
 continued for members…
I’ll clean the daily chart up to make it legible, but the falling channel choice is being made for us. Either ES stops at its current levels and the falling white channel is the one to follow or it pushes up to the .886 at 3258 and the red channel takes over.
 The chart below shows what the retracements and extensions would be if SPX reaches its own .886 at 3256.53. Note that the gray 1.618 lines up nicely with the yellow .886.
 The supposition for each is that this is the last gasp of the corrective wave which began on Mar 23. This wave could well be truncated, meaning that a push to 3258 is hardly a sure thing.
If ES/SPX push above these .886s, of course, it’s a whole new ball game. But, slightly higher highs wreck downside Fib and other chart patterns – the whole goal of overnight ramp jobs – and would stop out more than a few bears.
Also, remember that Friday is OPEX. So, we could see quite a bit of see-sawing going on between now and then. Reaching the .886 ahead of time would not be advantageous from an OPEX standpoint.
Bottom line, I continue to believe we are at or very close to an important turning point which will likely be marked by COVID-19 considerations: more shutdowns, schools not reopening, etc. I believe the Fed has no intentions of allowing the broader markets (SPX) to reach new all-time highs at this time, as evidence by increasingly bearish comments from Fed speakers (e.g. Brainard, Kaplan) over the last couple of days.
On the currency front, USDJPY is taking advantage of the futures’ enthusiasm to push lower… …while EURUSD’s higher high has allowed DXY to break below the fan line from the March lows where it is likely to reach the .886 it didn’t quite reach in June. If 95.613 breaks down, then we should test 94.662 and potentially our 94.2 downside target.
 Gold continues to hover just below its 1823 target. I’d continue to remain short with tight stops, but a decline in oil/gas prices should remove inflationary pressures and allow the deflation which is occurring elsewhere to dominate the headlines.
Oil and gas continue to postpone what I believe is an inevitable downturn. In addition to yesterday’s CPI beat which will put pressure on oil prices, news is just hitting the wire that OPEC+ will taper its production curbs from 9.6M barrels per day to 7.7M in August.

 The bond market continues to suggest a strong downturn as soon as next week. The red TL connecting the lows since 2019 intersects with the yellow channel bottom around July 23. A drop to that level that quickly would absolutely imply a sharp drop in stocks.
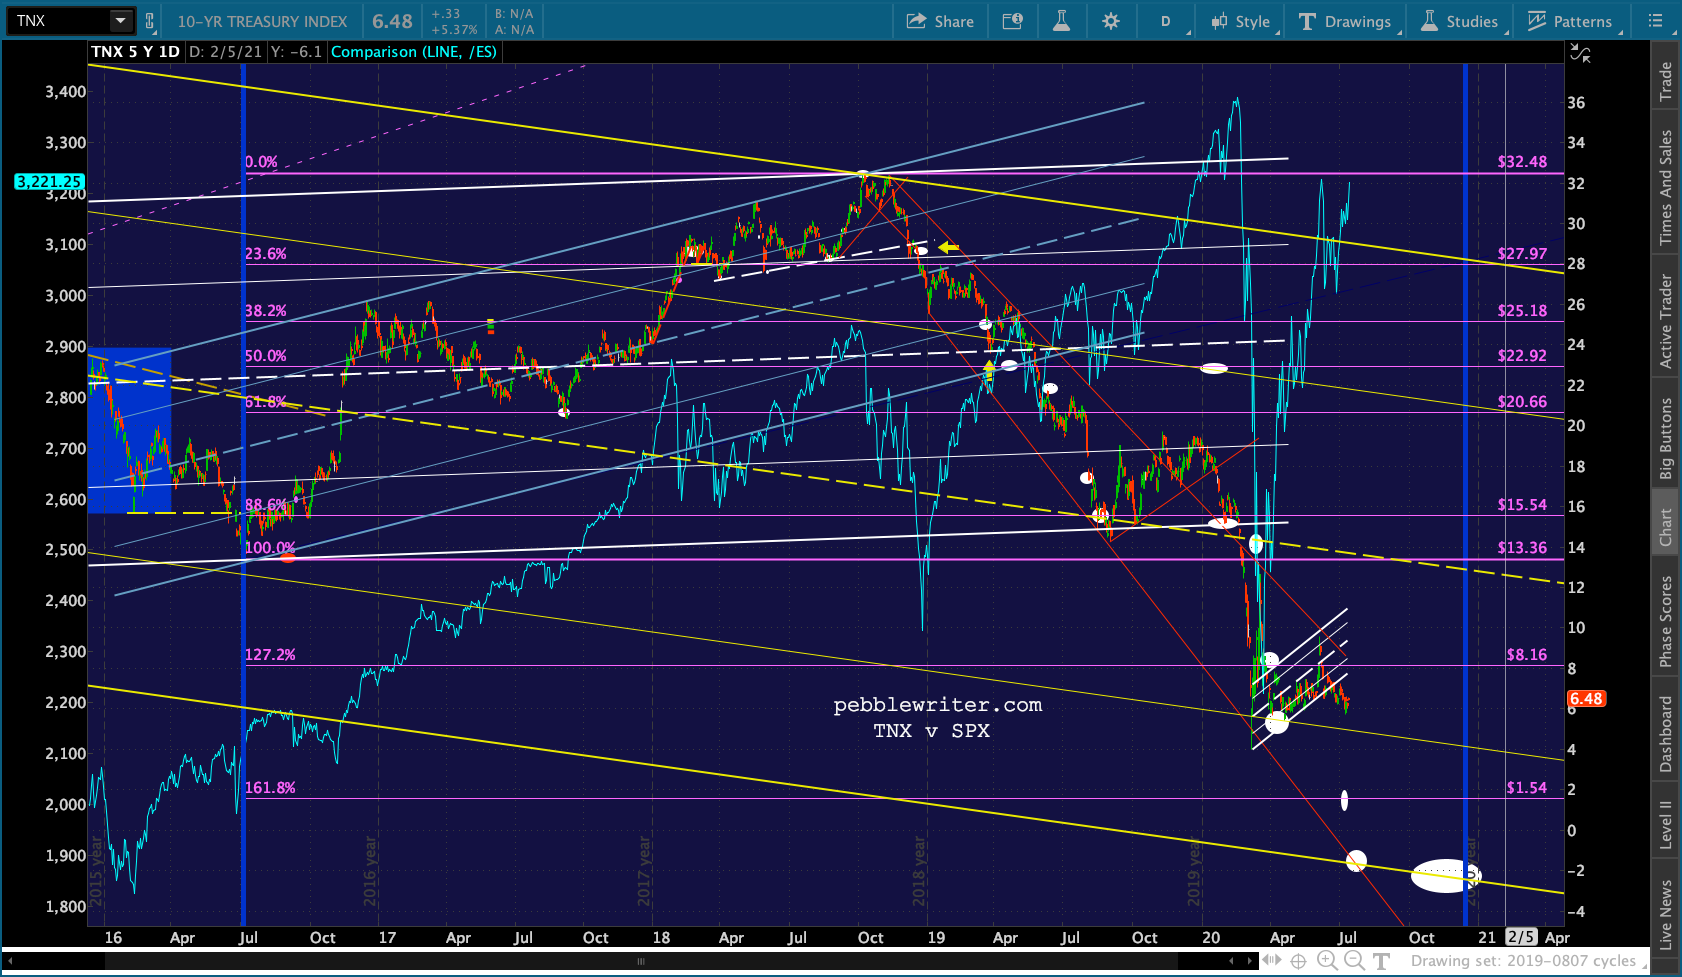 Remember that the cycle model’s current target date of December 13 was derived by averaging the length of other periods and is not considered to be exact. If I had to guess, I would say that ZN’s chart suggests a big drop in rates well before then – perhaps even right away.
  The 2s10s model continues to backtest…
 …and suggests a breakdown no later than Nov 23 (the white dot.) The sooner it breaks down, the lower the target level. Right now, for instance, the rising yellow TL is around 24 bps. On November 23, it’s closer to 35 bps.
  UPDATE: 3:40 PM
Not a huge surprise, but ES/SPX are heading higher as we approach the close – mostly on VIX’s threat to break down but also USDJPY’s and CL’s rebound.


