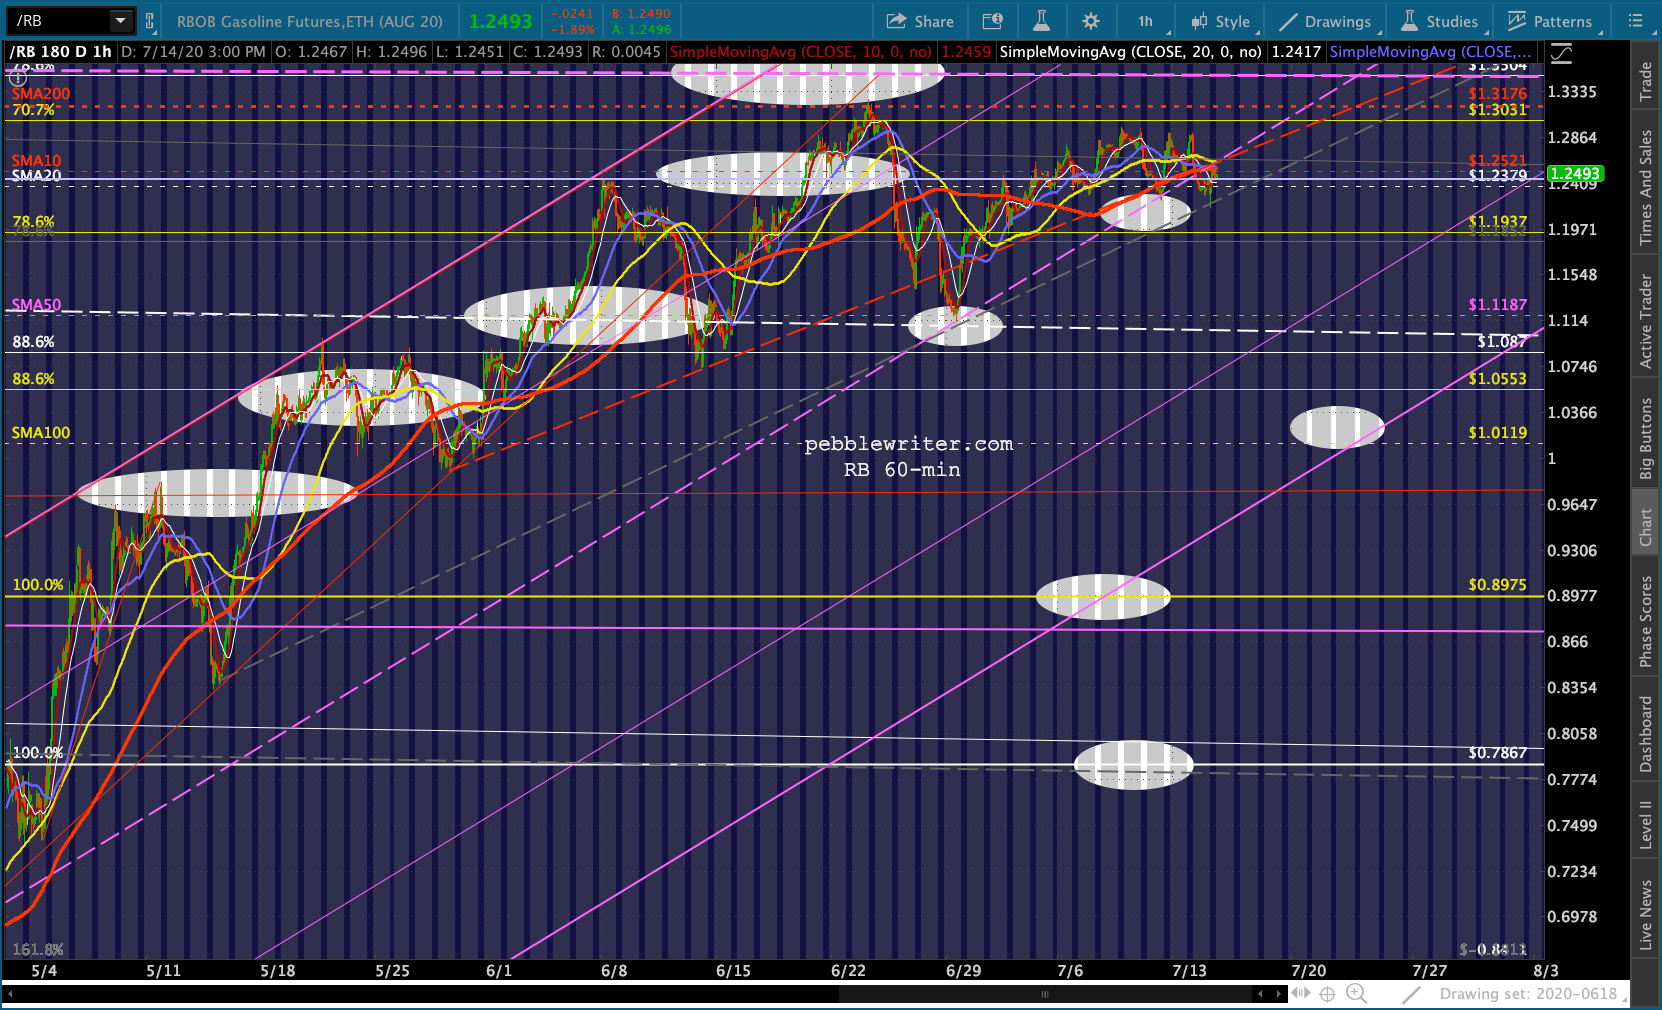
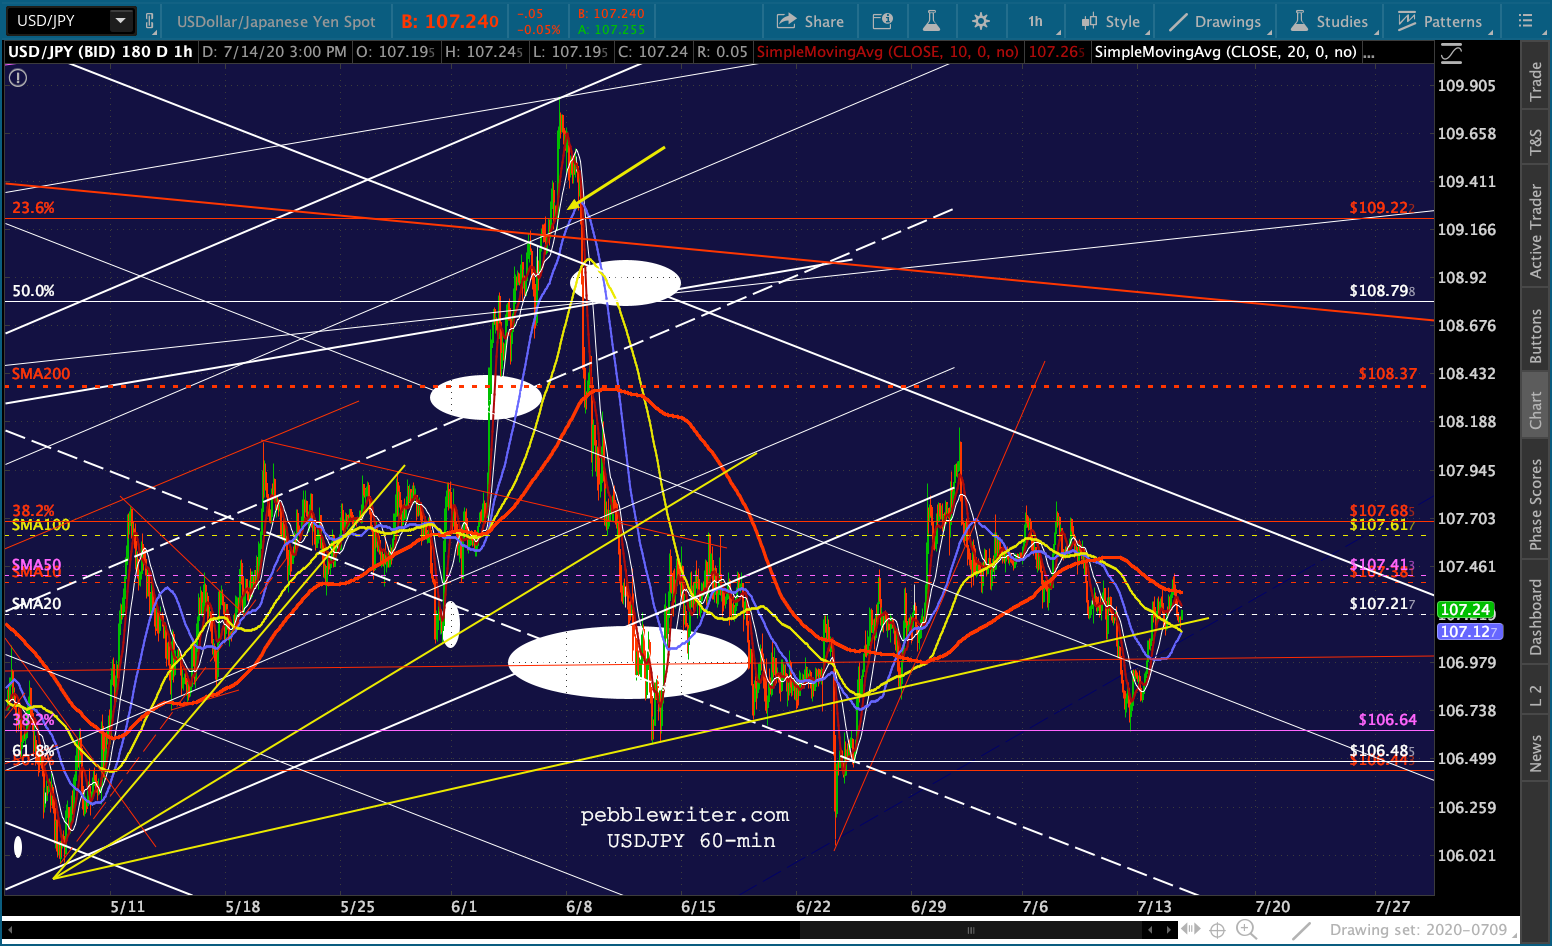
Note: CPI came in right on target: +0.6% unadjusted over the last 12 months. The MoM figure also rose 0.6% – driven, as expected, by the 12.3% increase in gasoline prices.
* * *
The last time I wrote a post including all the FAANG stocks was in November 2018 [see: FAANGs – Now or Never.] Several of them FB, AAPL, AMZN, NFLX and GOOGL were in trouble from a technical standpoint. GOOGL, for instance, had just completed a death cross and the stock had broken down from a 10-year old rising wedge. The S&P 500 itself was also in a bind, having dropped through its 200-DMA and struggling to remain above its 2.24 Fibonacci extension at 2703. As it turned out, it couldn’t. It shed another 14% (20% from the Sep 2018 highs) before being rescued by the Plunge Protection Team. Most of the FAANGs had similar troubles.
GOOGL, at 1071.05 at the time, dropped 24% from its July 2018 highs and tested its March 2018 lows and completed a huge H&S Pattern targeting 707 before magically finding its footing. It has since piled on another 500 points, with two downturns along the way turning the rising wedge into a rising channel [it just needed a global pandemic and a horrible recession to help it along] which is once again offering overhead resistance.
  What about the rest of the FAANGs? Any other warning signs that we should be watching? Glad you asked.
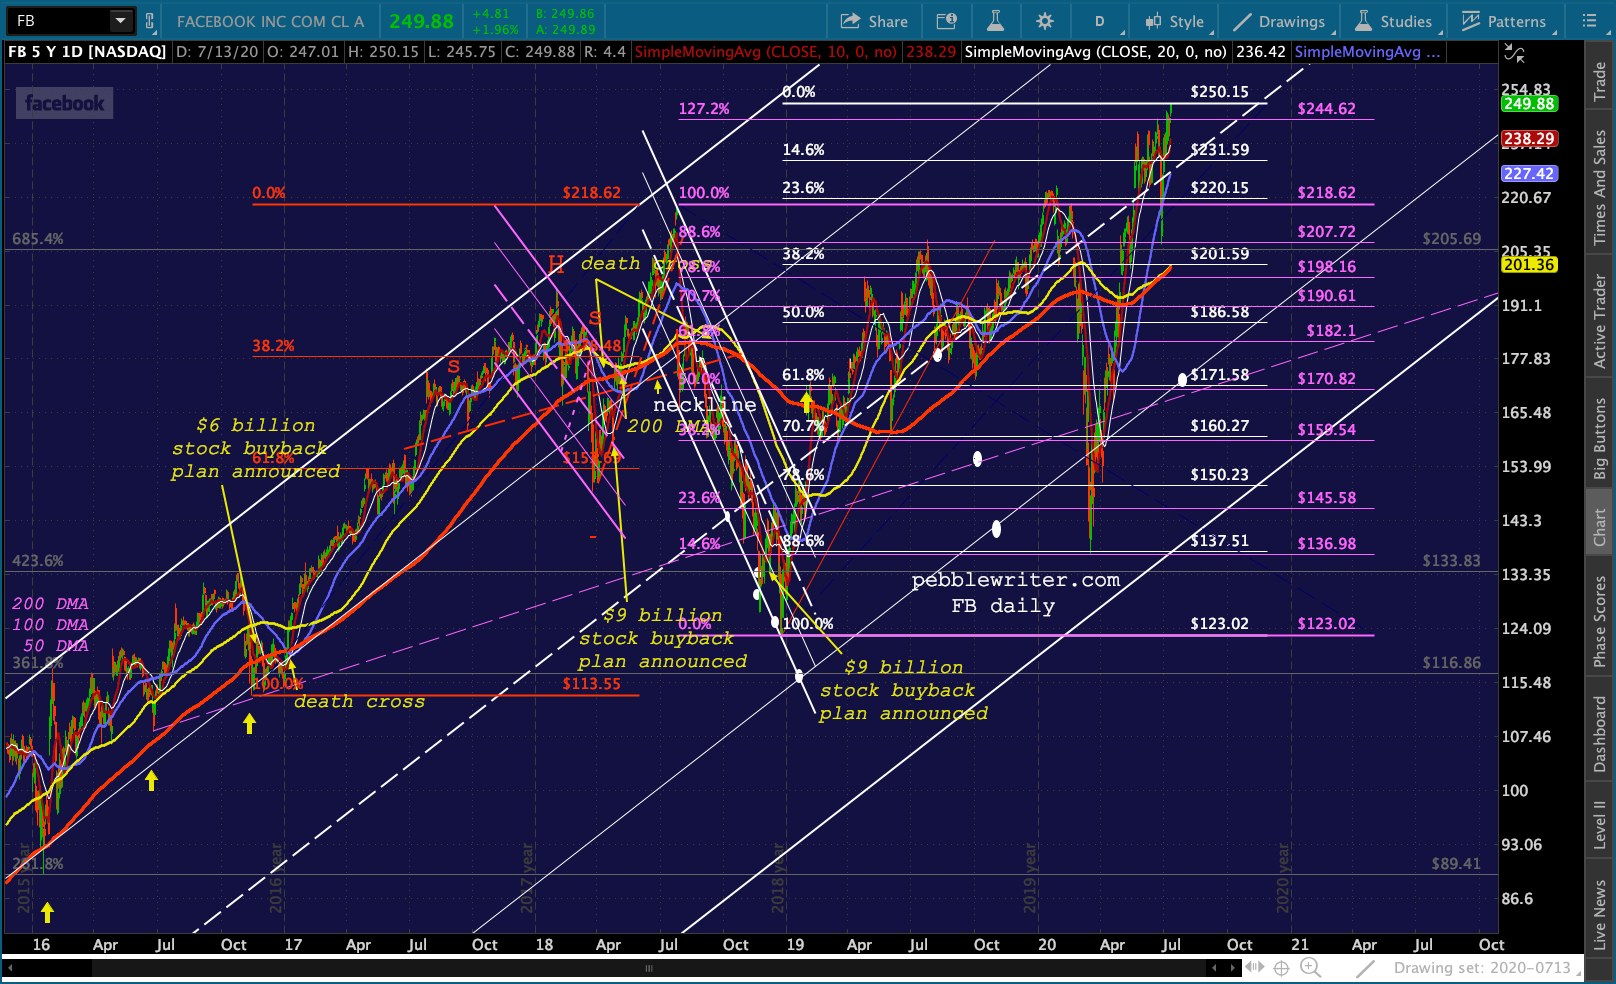
continued for members…FB has pushed above the white channel midline and completed a sloppy butterfly pattern (after recovering from a nifty double top) that could spell trouble.
 AMZN is testing the top of its rising white channel and a 2.618 Fib.
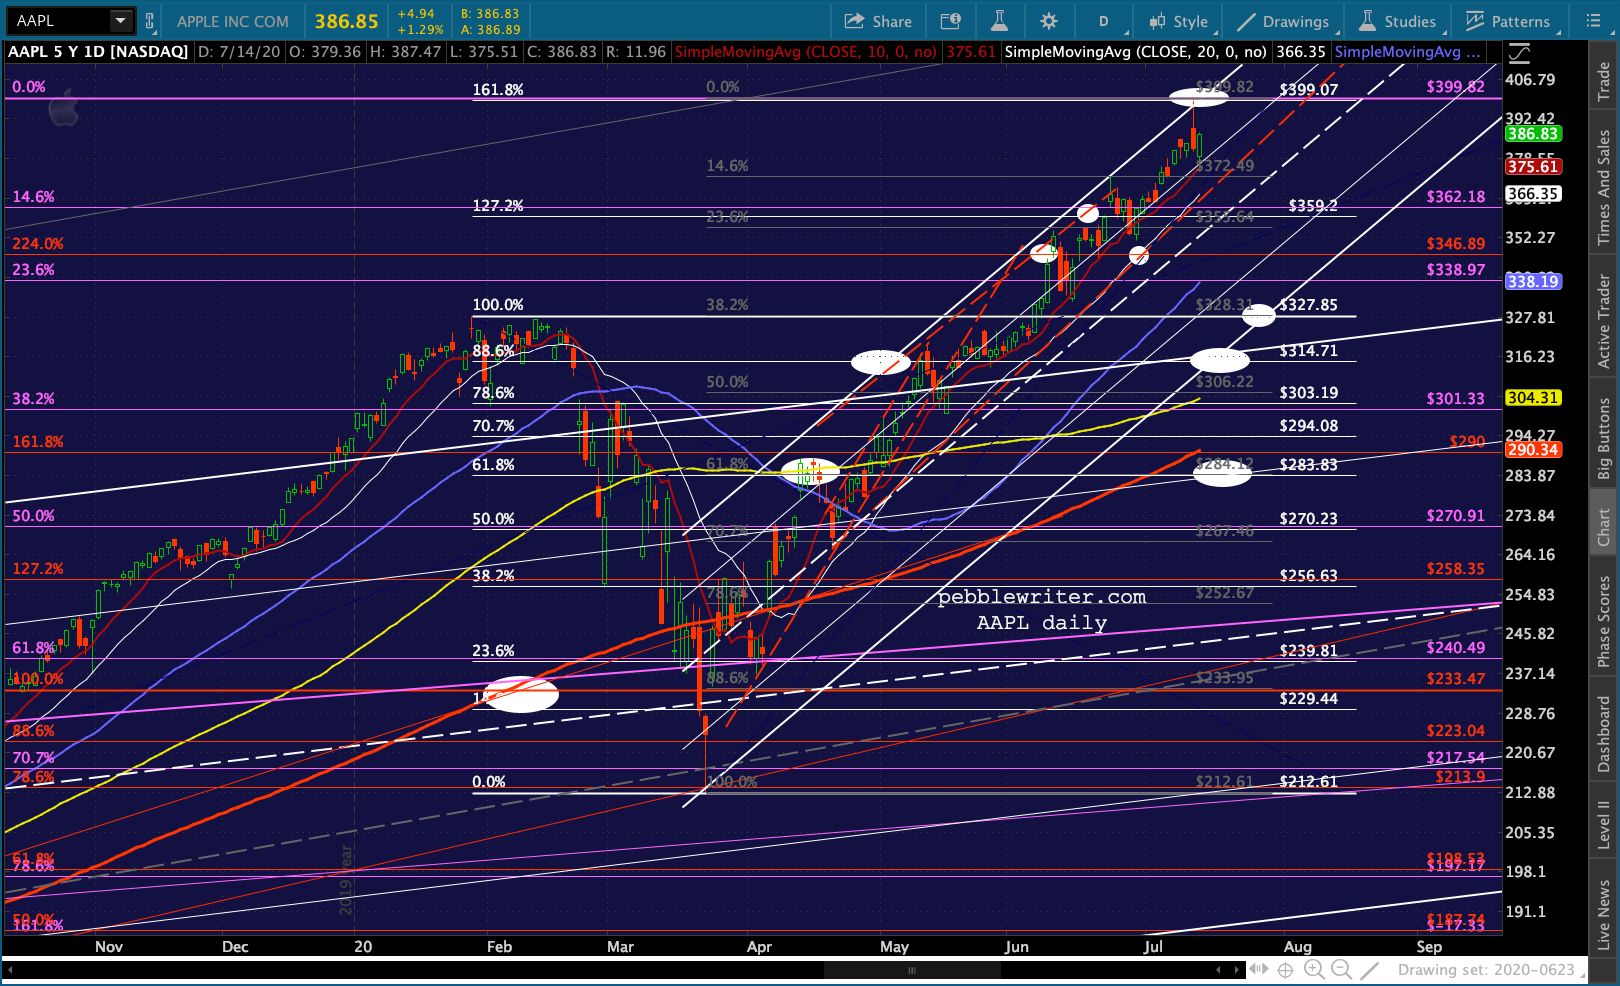
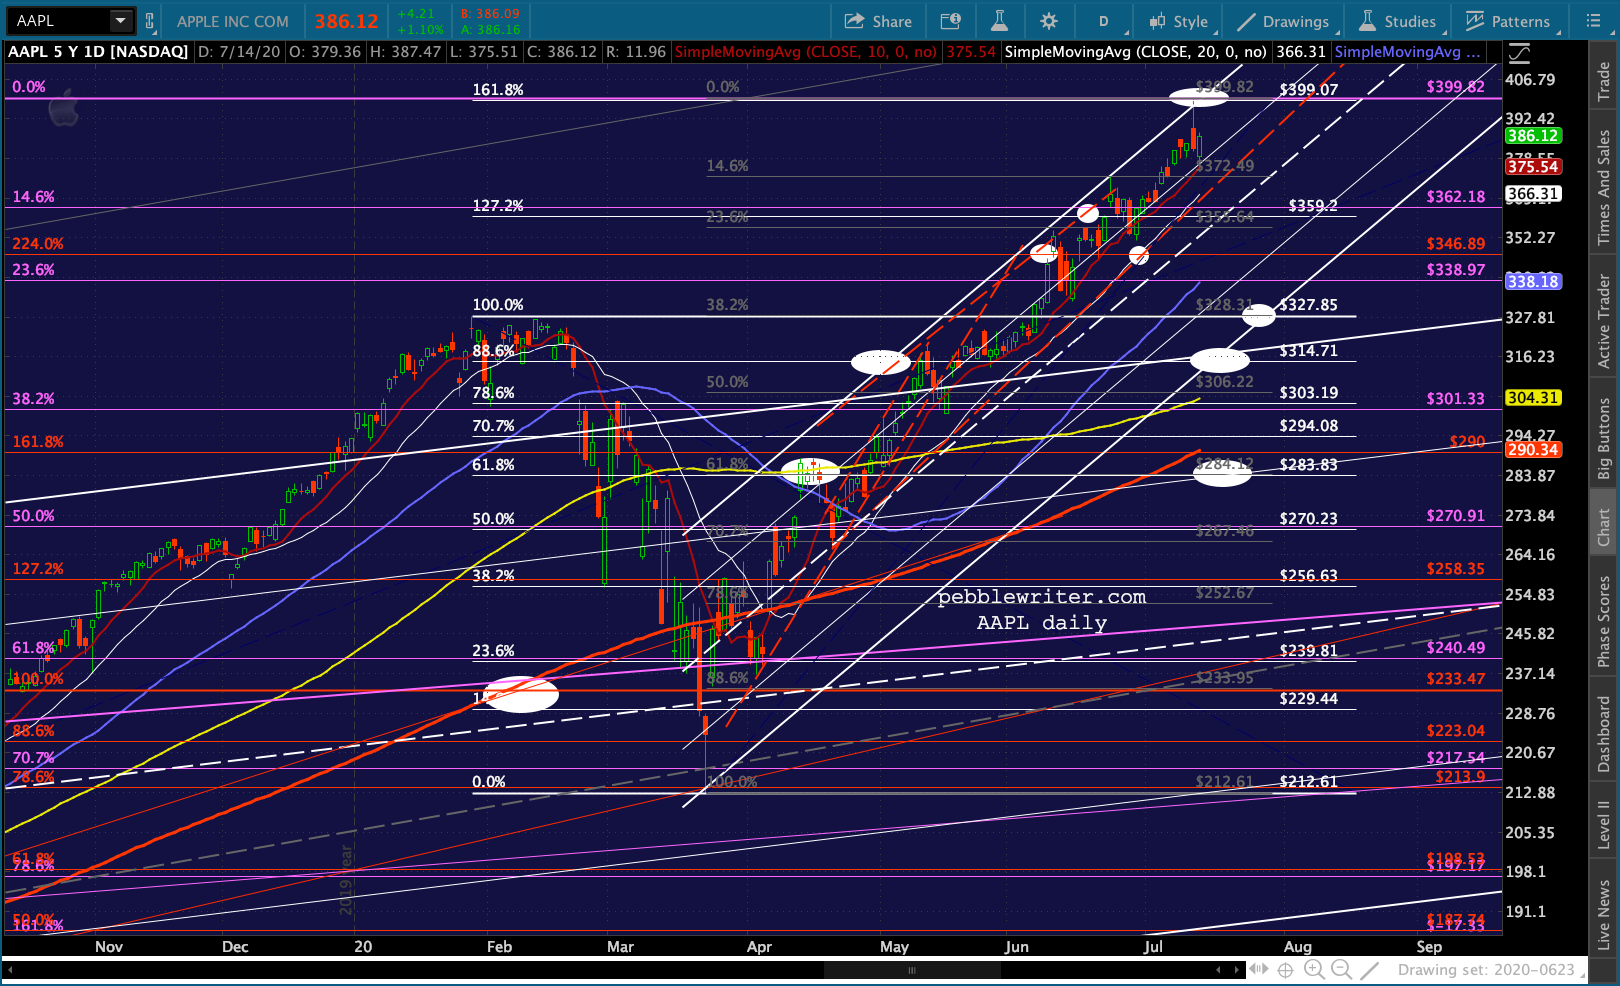
 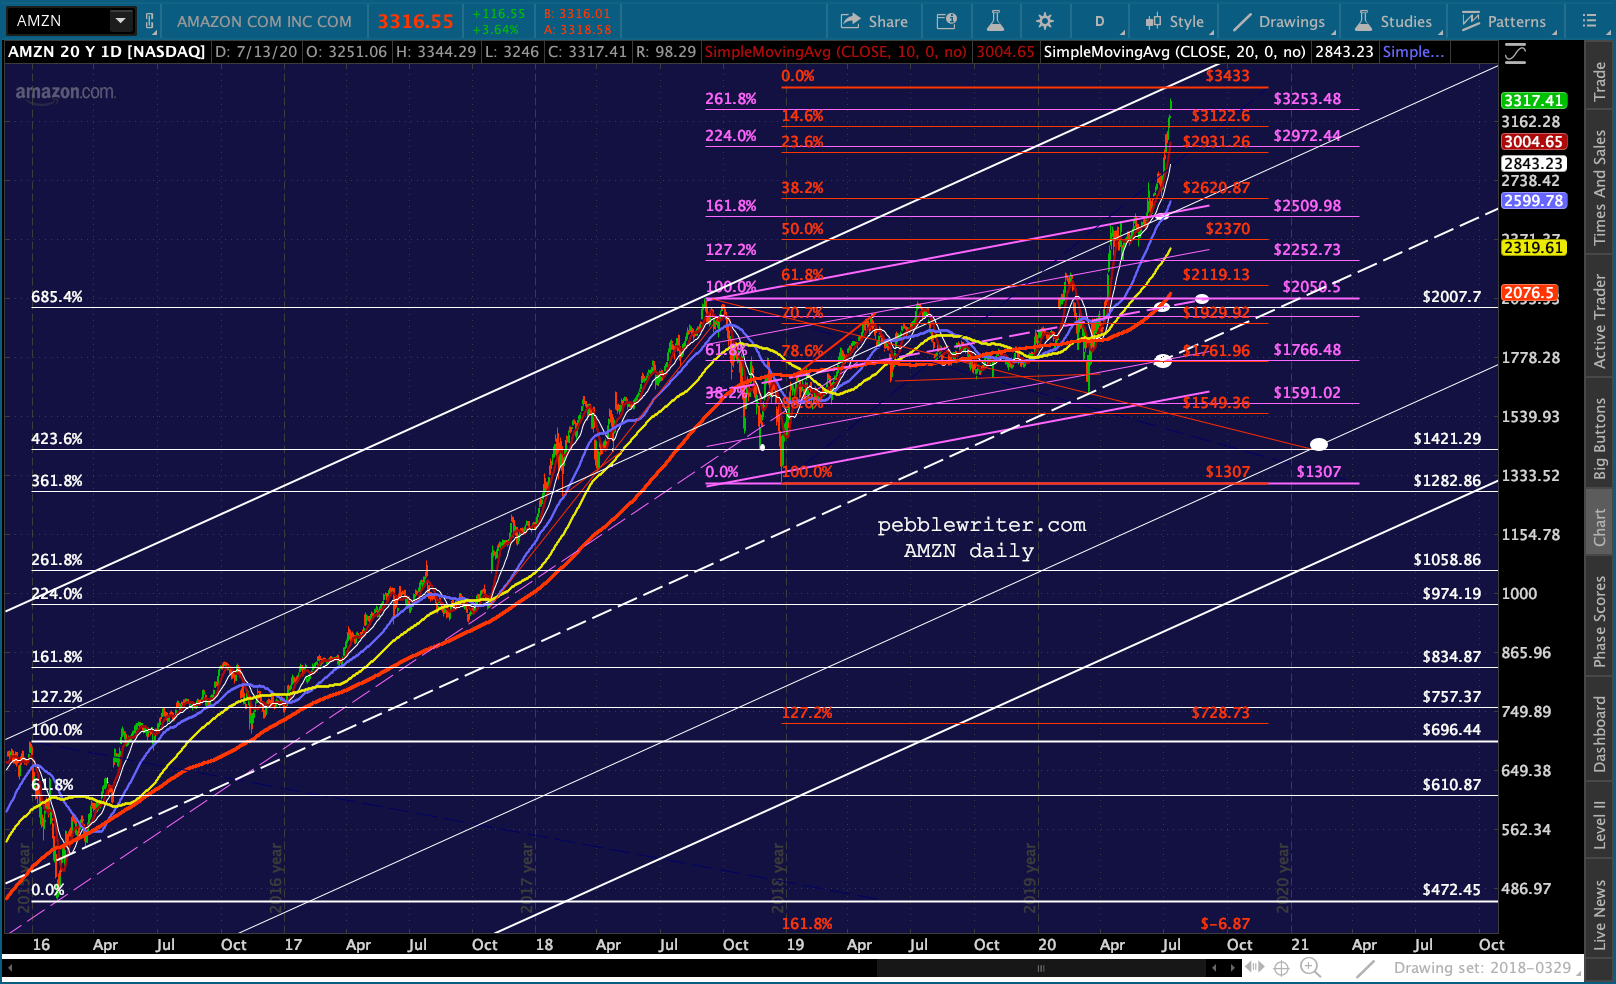 AAPL, which overshot our 144 target by two points in Jan 2019 before a massive bounce that allowed it to break out of its primary channel again, is testing the 1.618 Fib extension of its drop in Feb-Mar. It’s very vulnerable here, with support way down at its 1.272 (359), followed by the intersection of its Feb 2020 high and its channel bottom (327) or broken channel top at (320ish.)
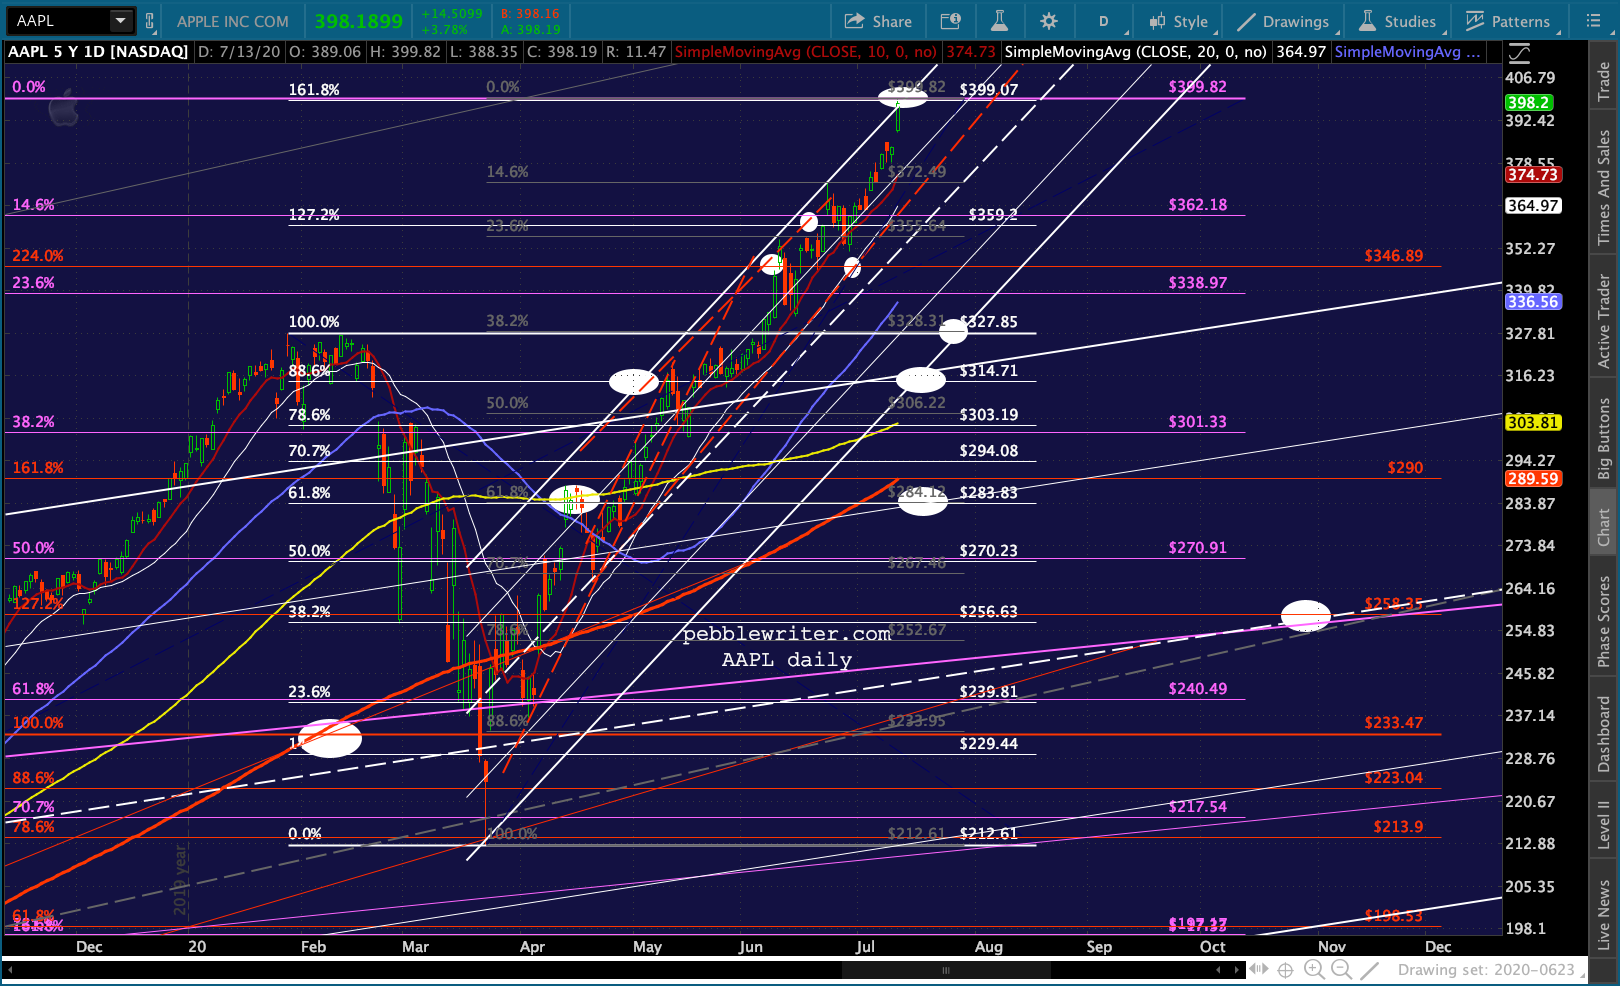 After coming within 0.46 of our 230.77 target…
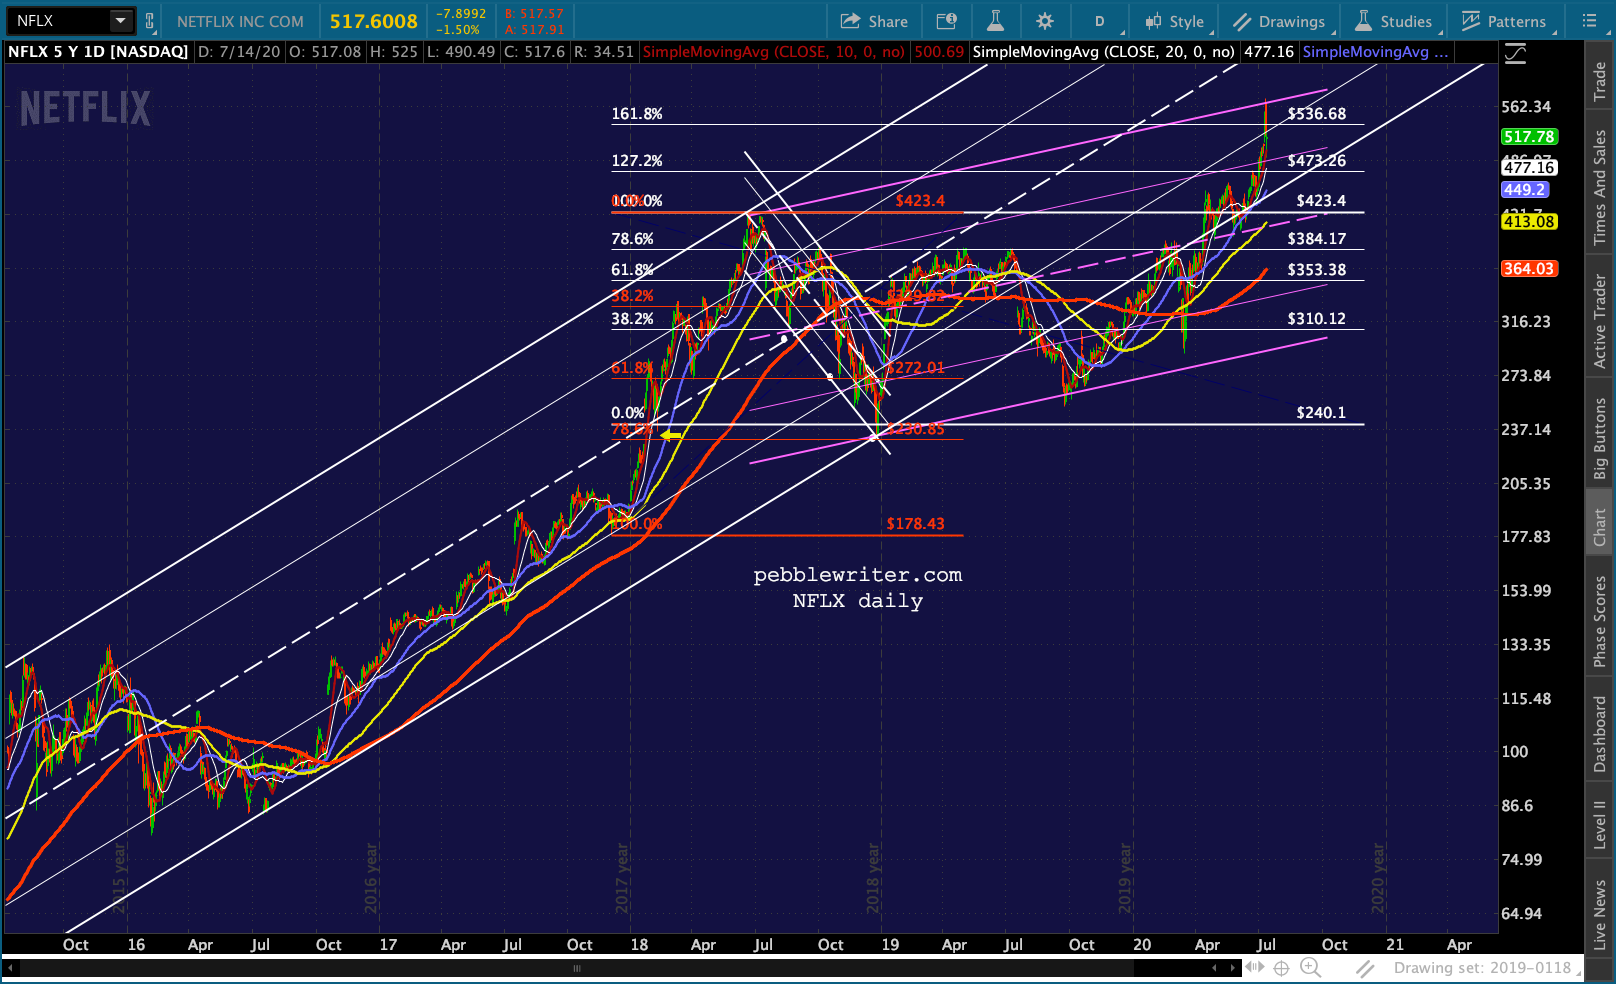
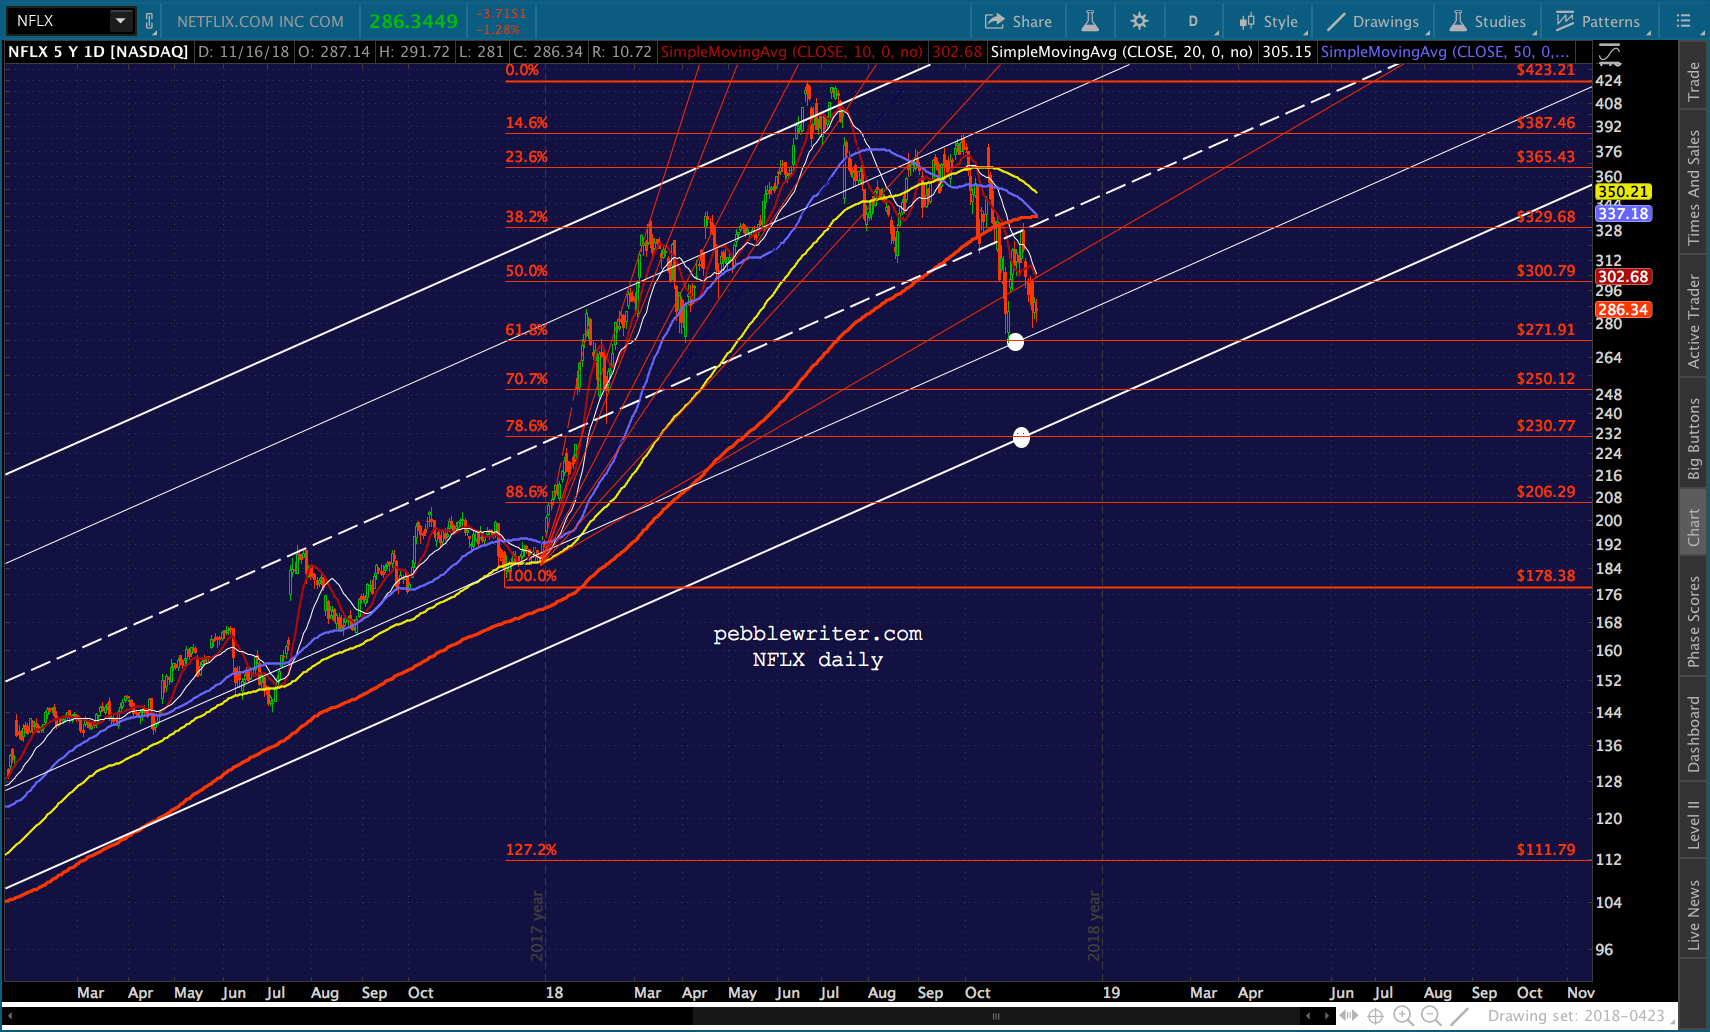 …NFLX bounced sharply, only to see its rising white channel break down in August 2019. I has since made a nice recovery – with the shutdown turning it into a stay-at-home darling. If it can’t hold 542.16, however, it has exposure down to the white channel bottom at 444ish and, should that not hold, to 423.40.
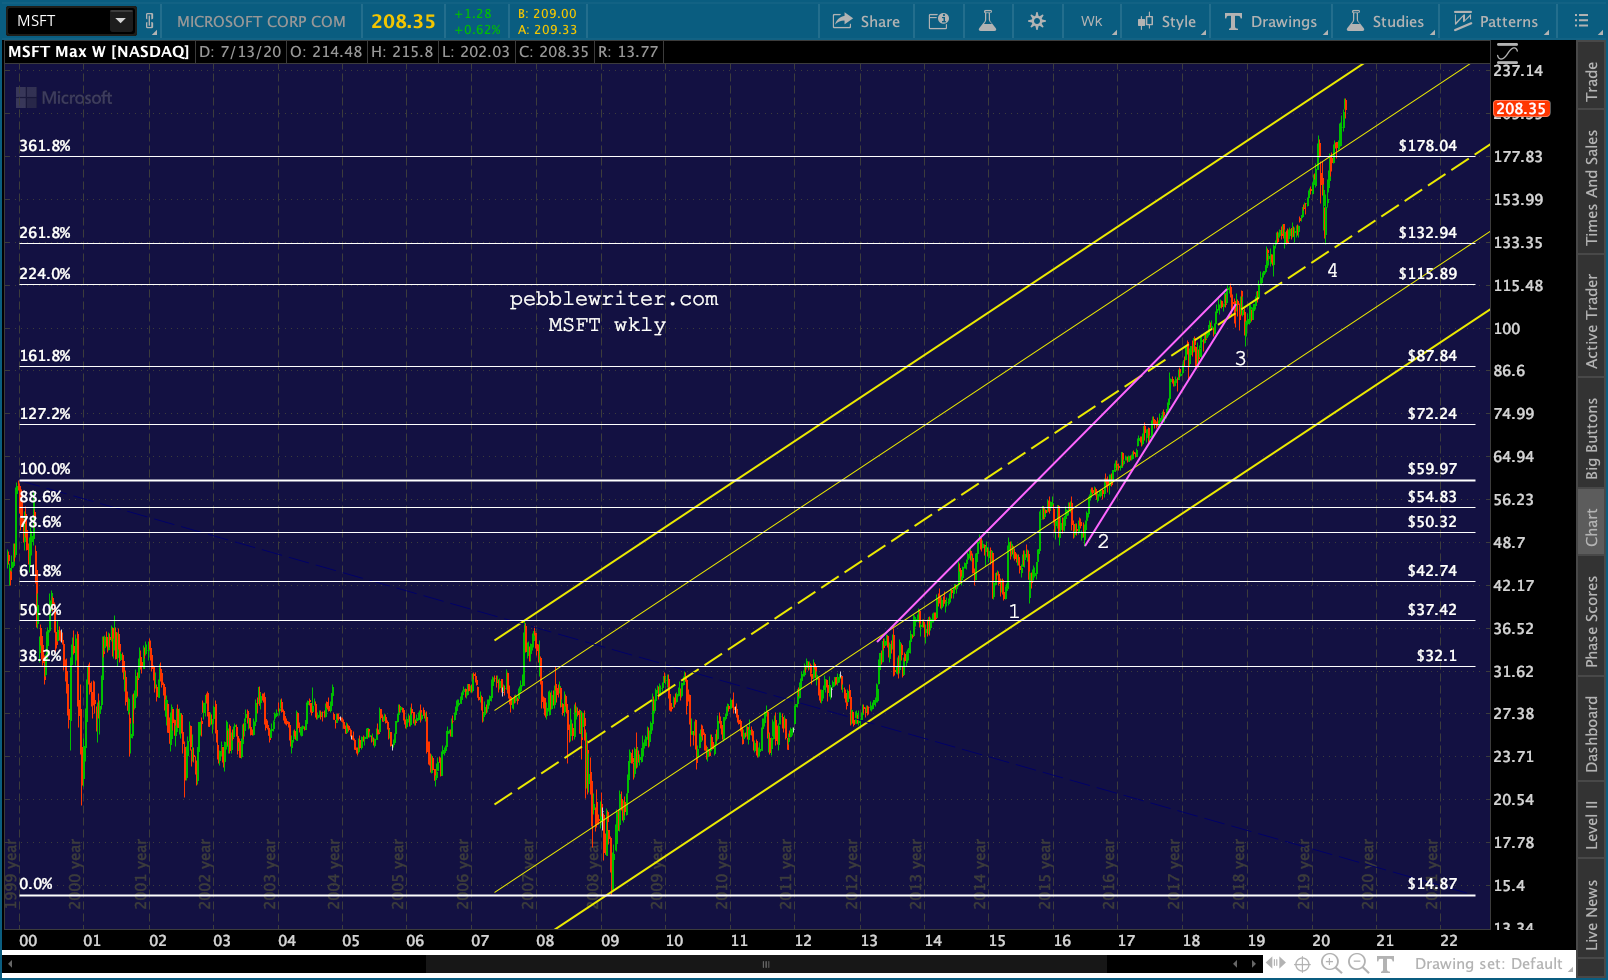
 Last, though it’s not a FAANG, MSFT is obviously a player in the market’s stunning absence of breadth. It also exemplifies the critical role that buybacks play in stocks’ runaway rally. As of Sep 2018, MSFT had completed a rising wedge, reached its 2.24 Fib, and tagged the top of a well-defined channel dating back to 2008. It was very due for a pullback.
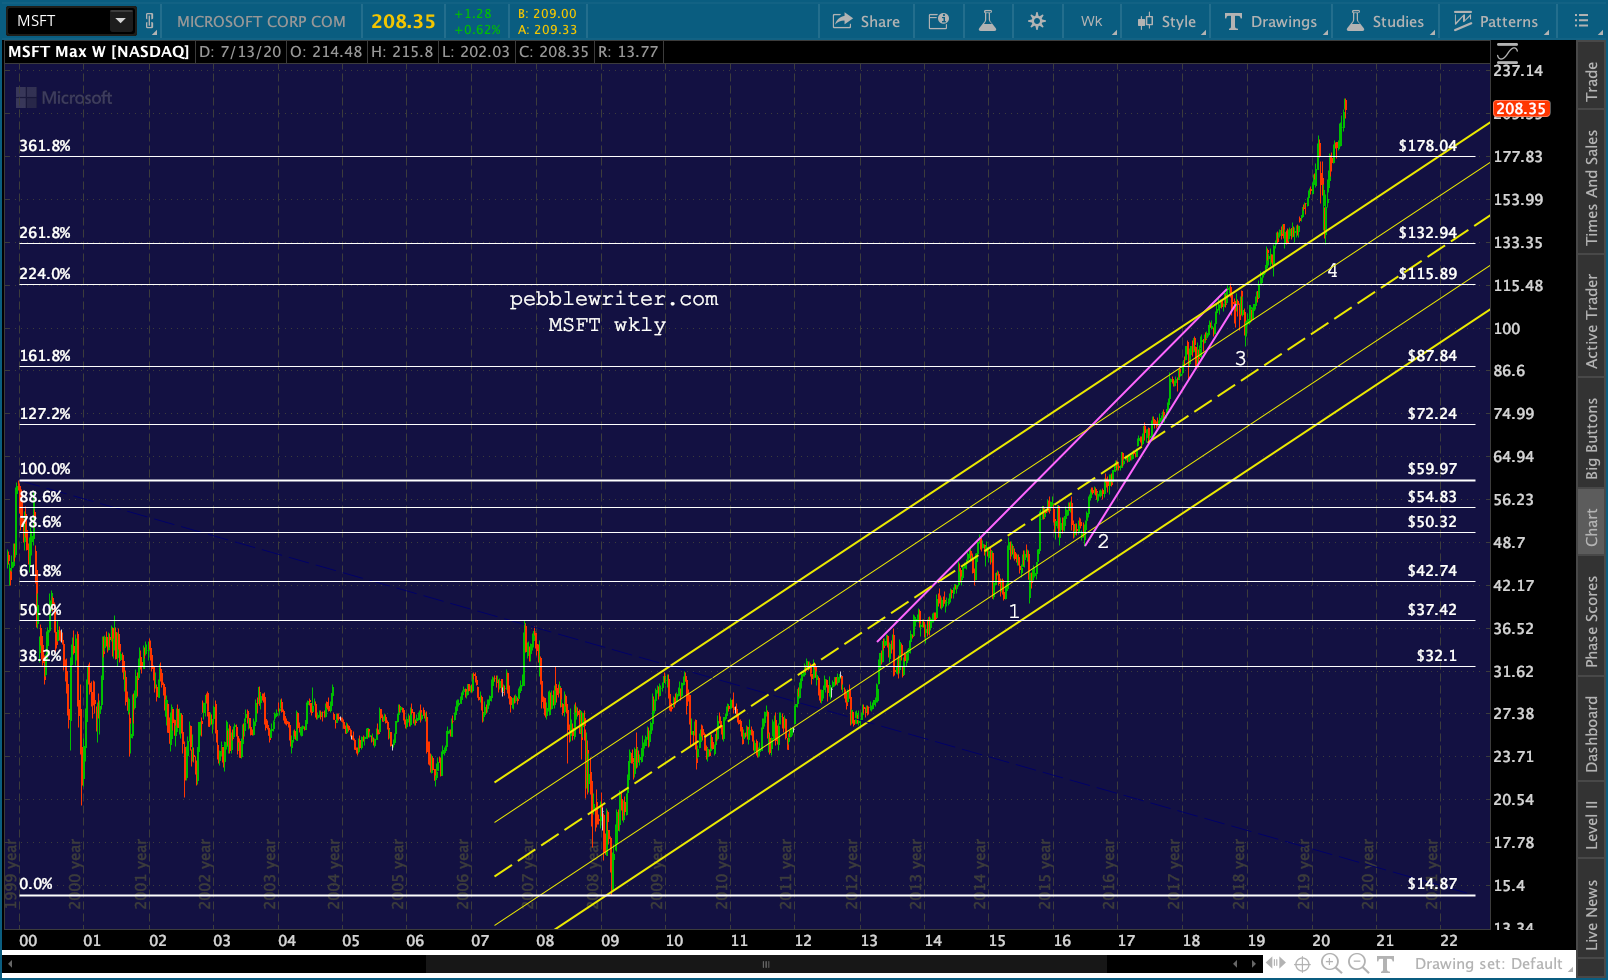 It tumbled 19%, heading straight for a backtest of the 1.618 at 87.84. Then something funny happened. First, the PPT met on Monday, December 24 and began a campaign to crush VIX. The overall market bottomed that very day.
The other thing is that MSFT purchased nearly twice the usual amount of stock under its stock repurchase plan that month. 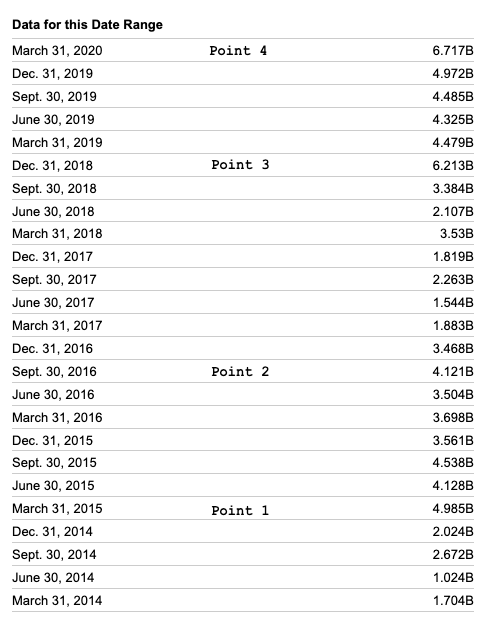 Note that each and every time MSFT faced a breakdown, it upped its buybacks above $4 billion for the month. We see it at Point 1, when MSFT experienced a death cross and dropped below its SMA200 and .618 Fib; Point 2 – another death cross, drop through the SMA200 and below its .786; Point 3 – the rescue mentioned above after reversing at the 2.24, another drop below the SMA200 followed by a string of above average purchases which helped it break out of the rising yellow channel; Point 4 – after dropping through its SMA200 again, the backtest of the yellow channel it broke out of (previously a backtest of the smaller yellow channel top.)
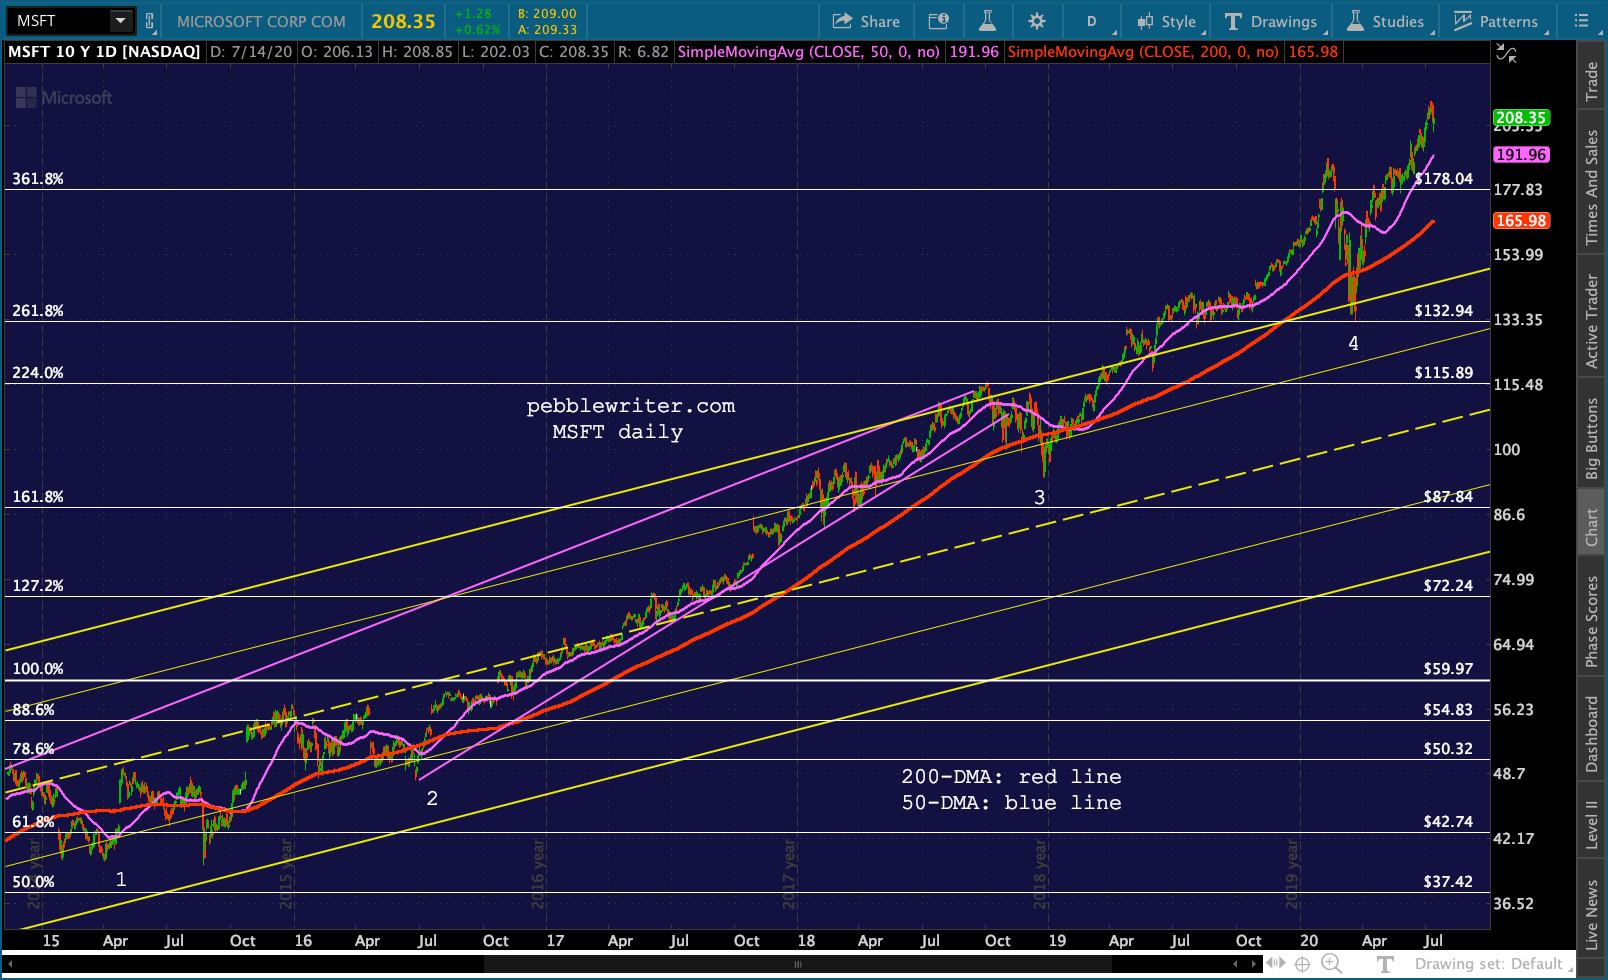
The yellow channel must now be expanded, resulting in one that leaves plenty of room for more upside. It doesn’t matter that the $6 billion purchases aren’t meaningful to a $1.5 trillion market cap – only that the company is known to prop up its stock when it counts.
As long as the company is willing to step in and prop up the stock at a moment’s notice at crucial points of support, how can it ever correct? At some point it will likely backtest the 3.618 Fib extension, but who knows?
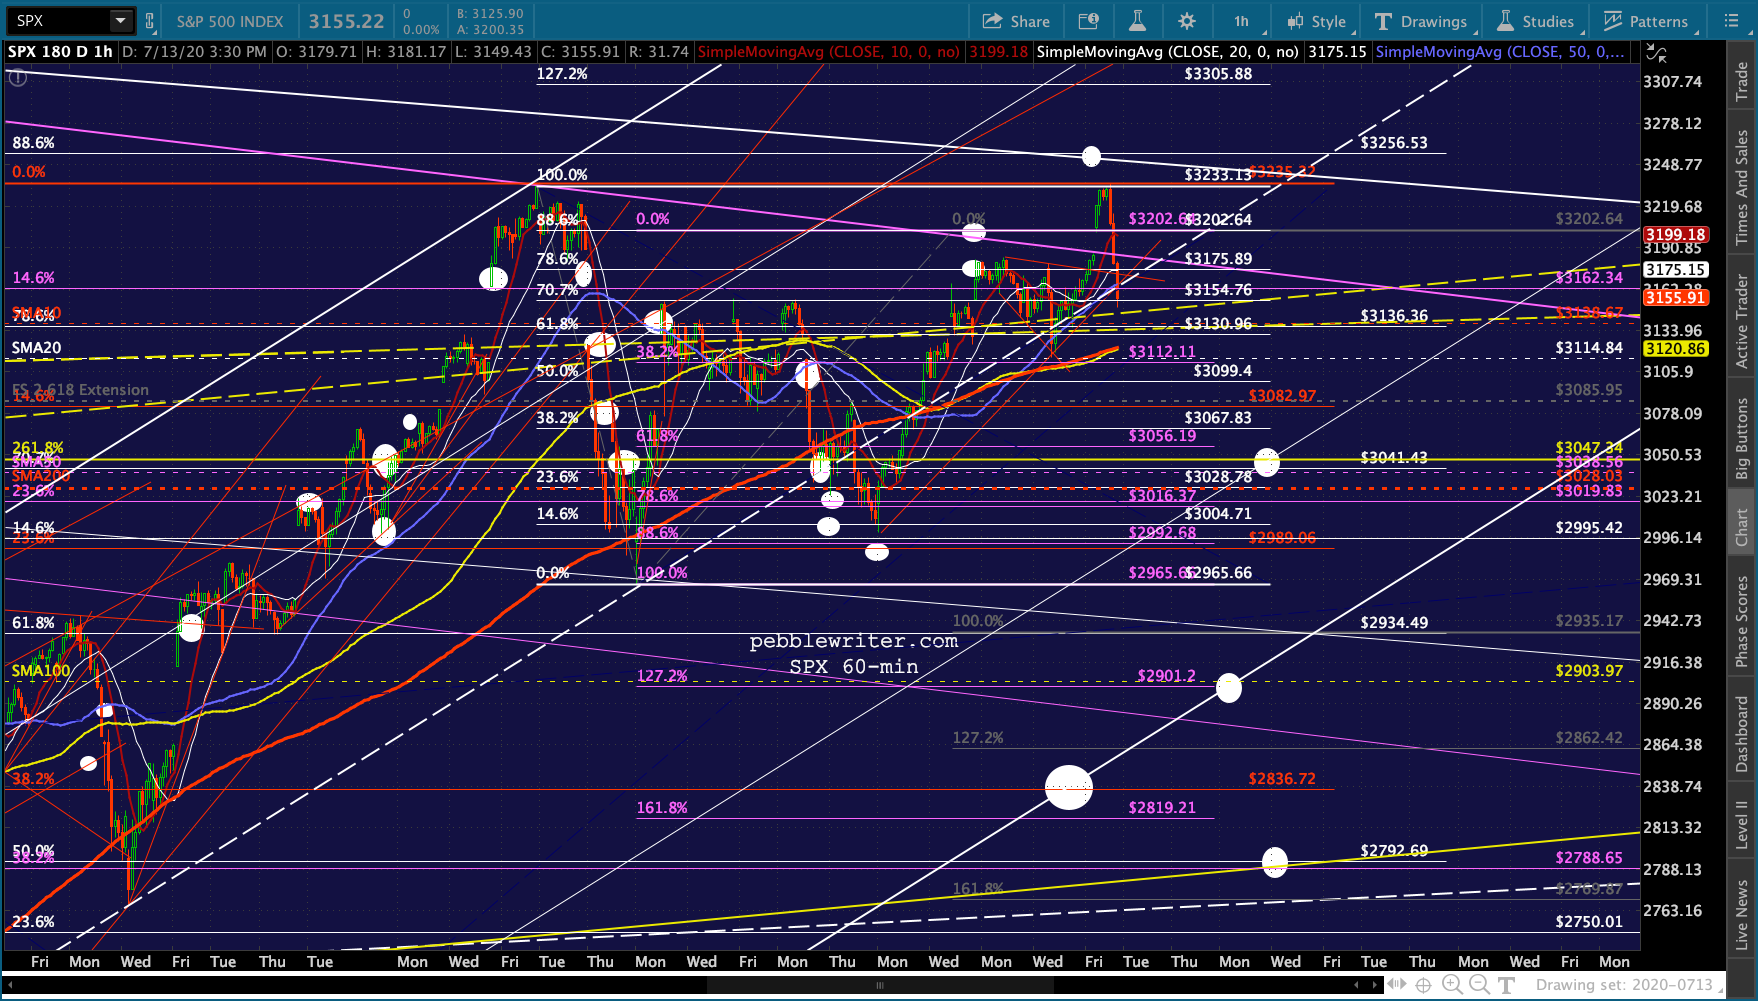
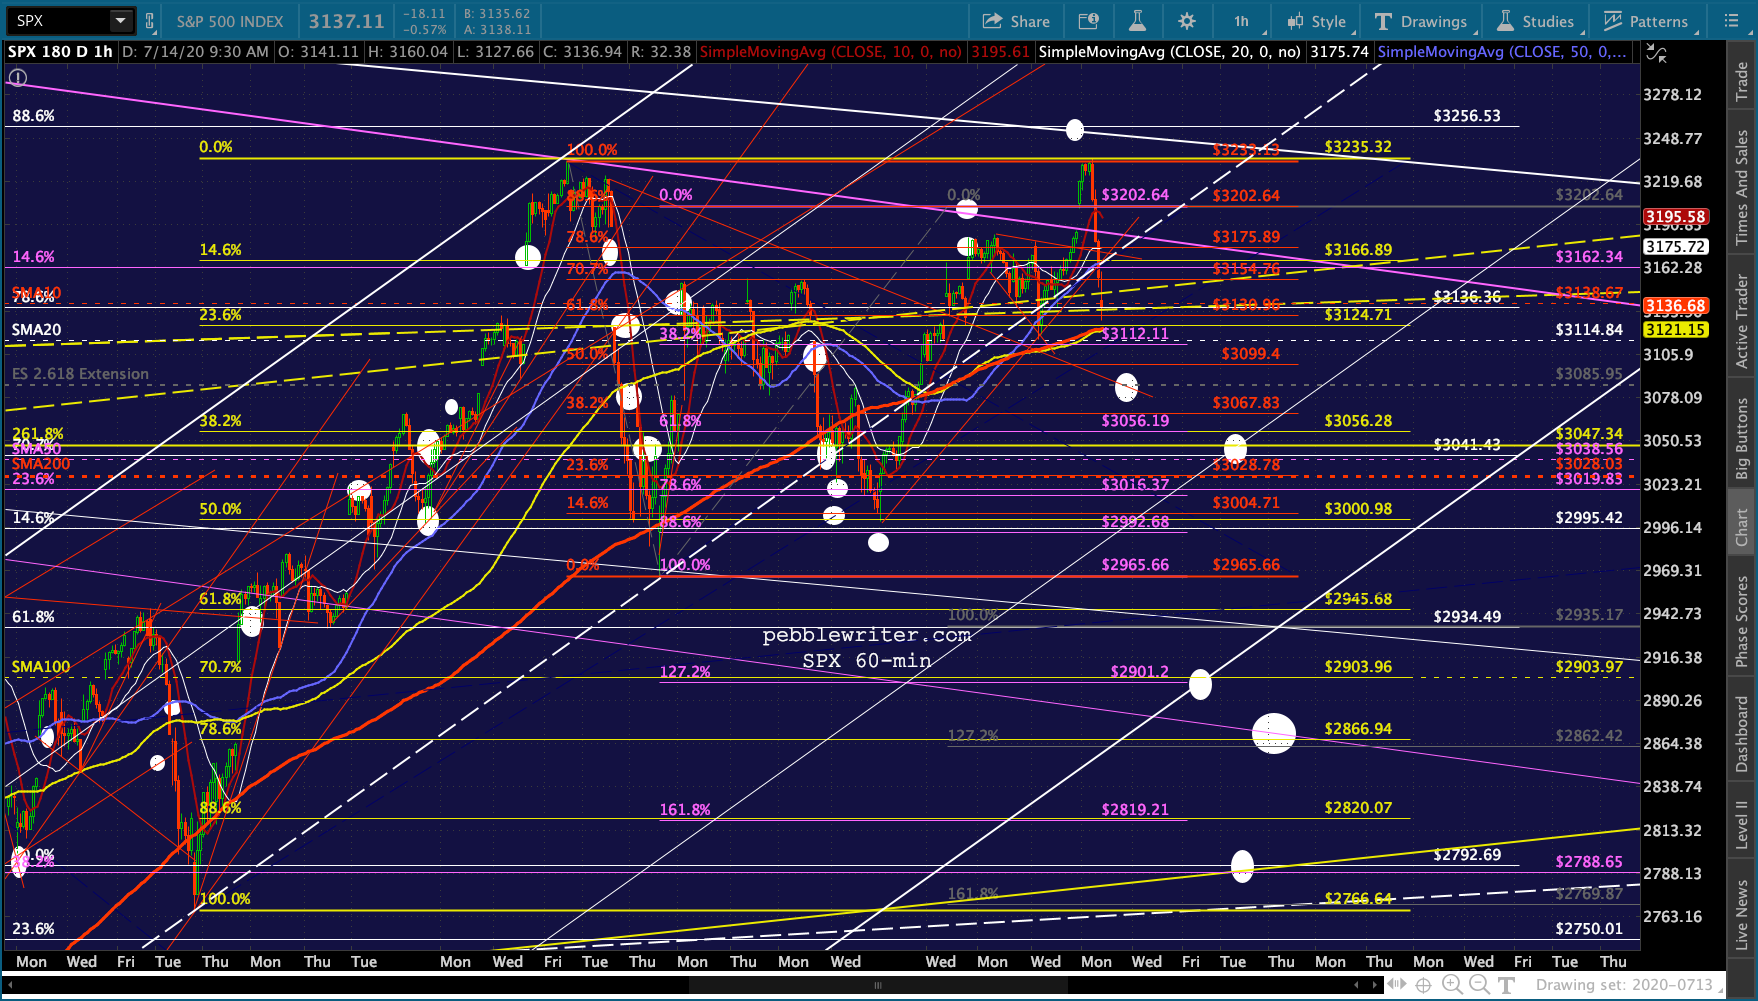
 Bottom line, each of the FAANGs faces some degree of resistance here. With CPI coming in at 0.6% for the month (In the meantime, yesterday’s SPX chart shows it clinging to support – the yellow and white channel midlines.
 UPDATE: 10:00 AM
ES and SPX have found their yellow TLs – important support for both. Below here, lots of support starting at ES’ white midline at 3100 and its 2.618 at 3076.93.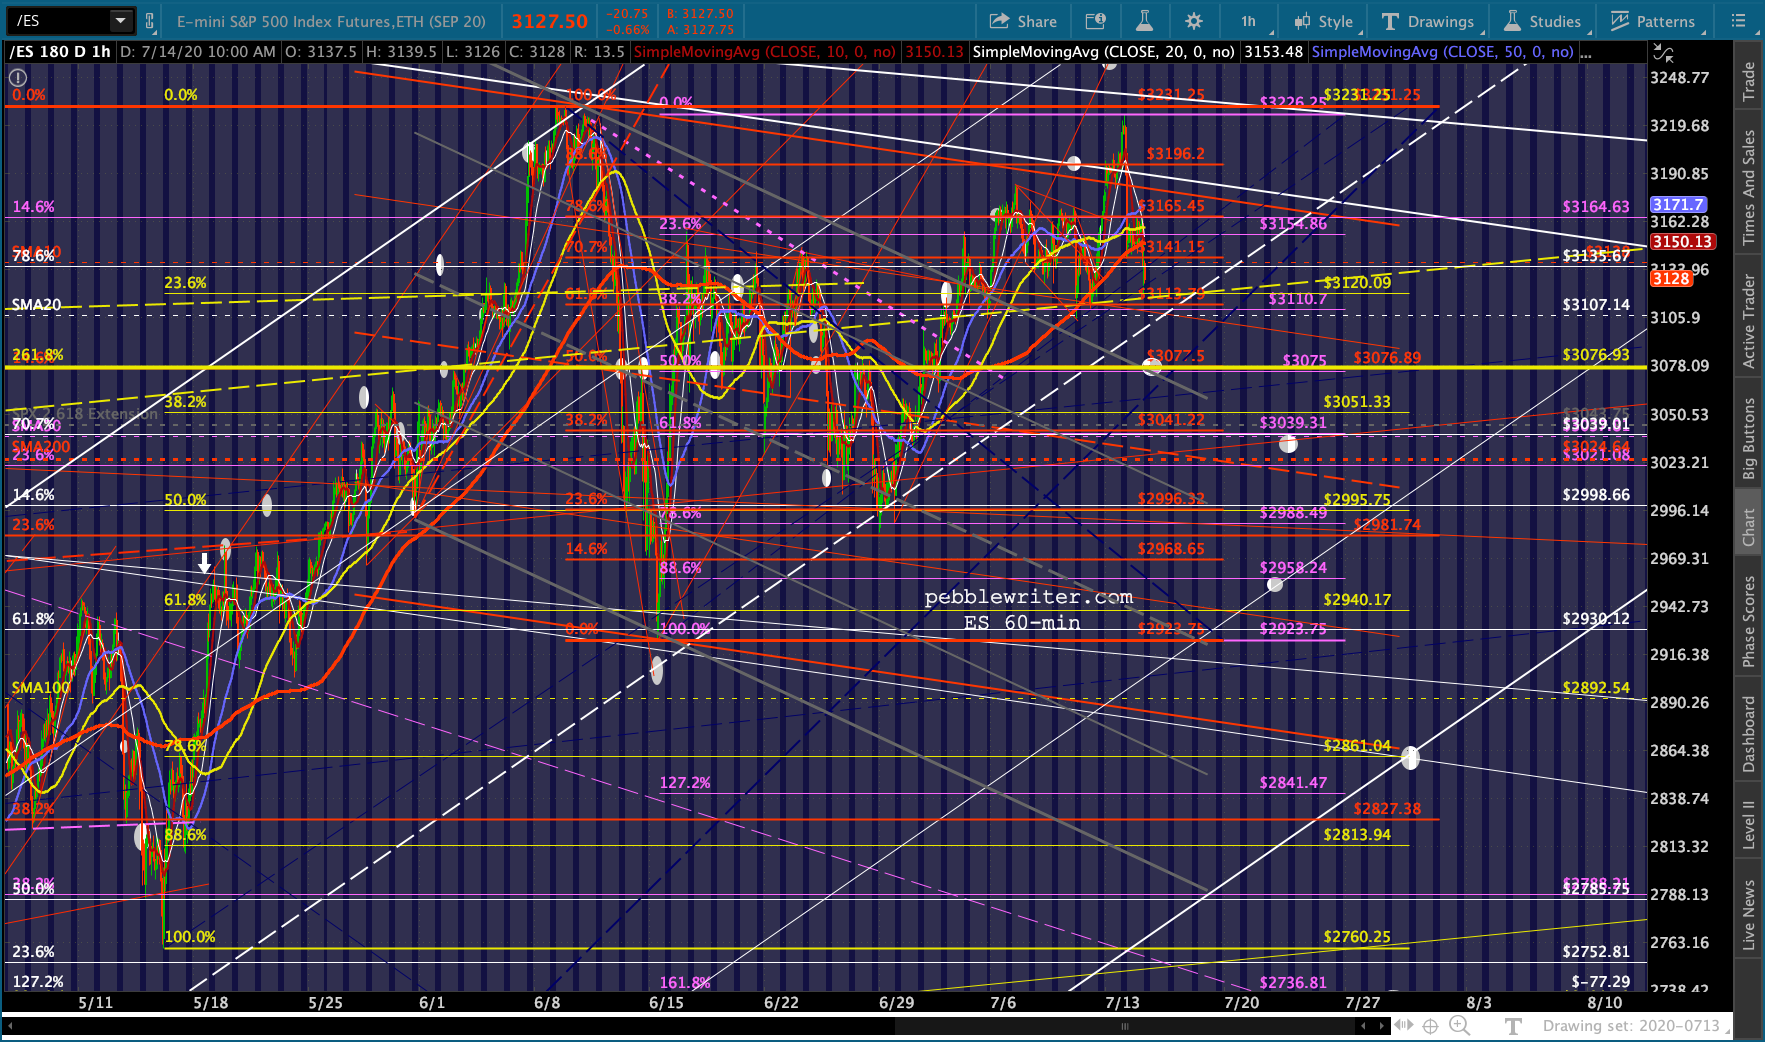
 UPDATE: 3:50 PM
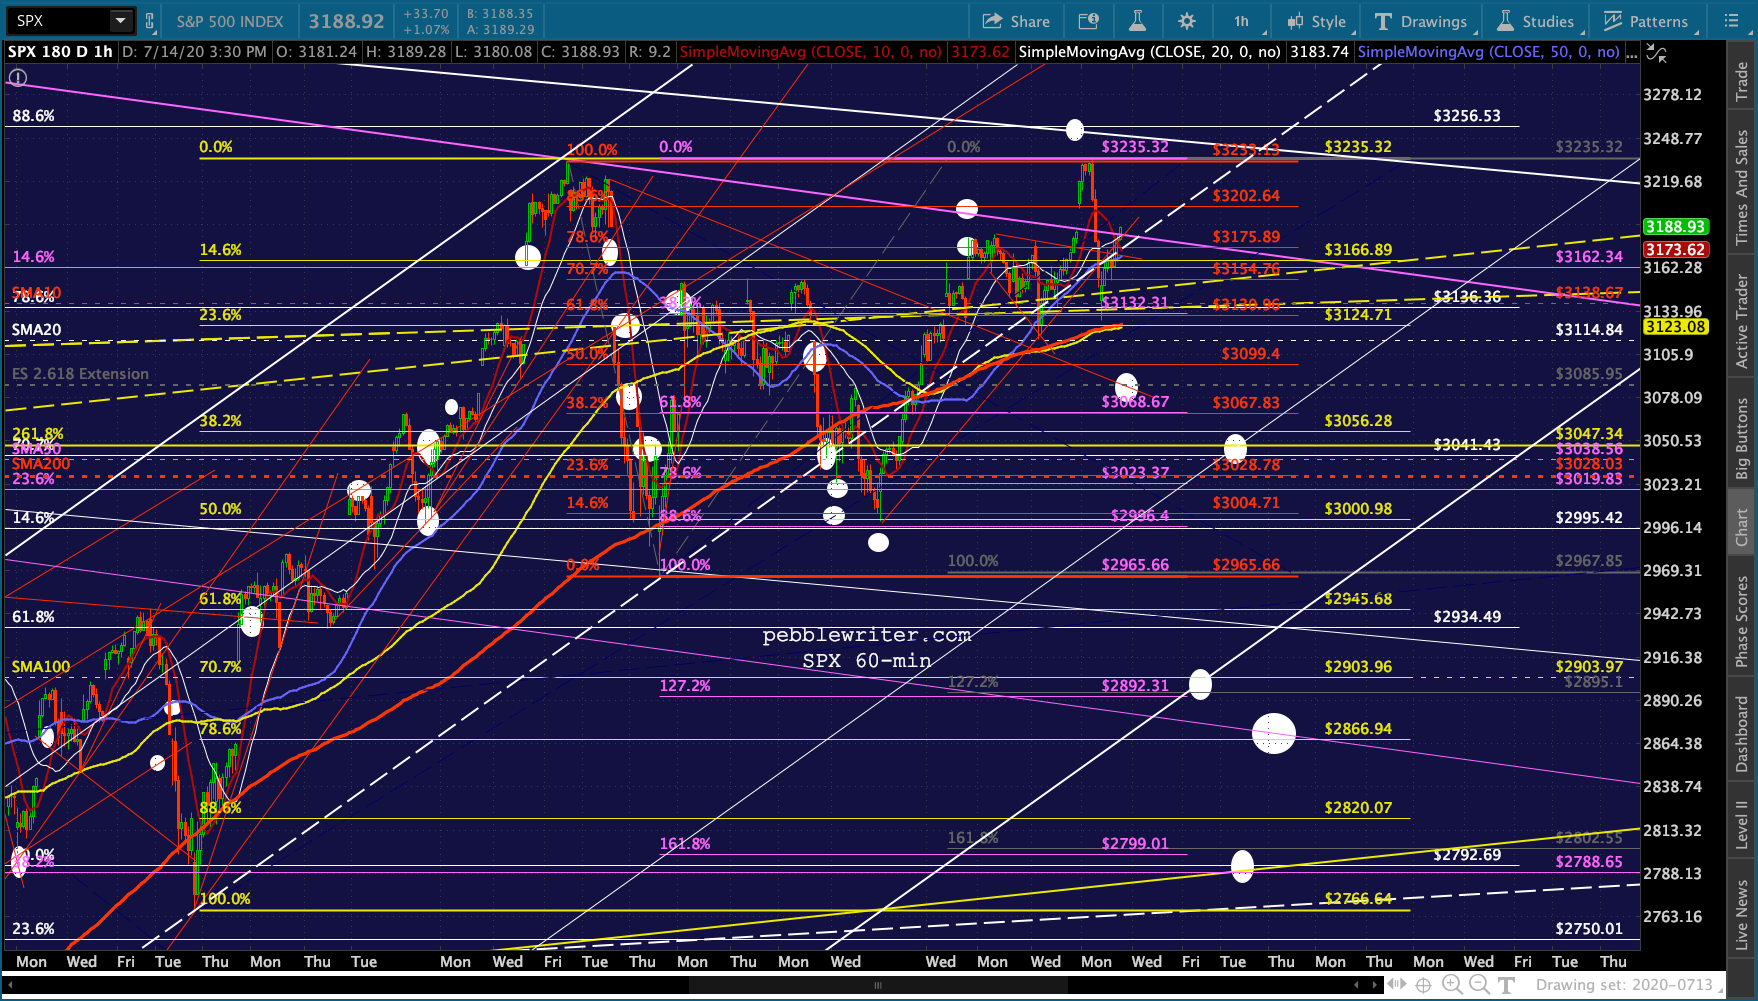
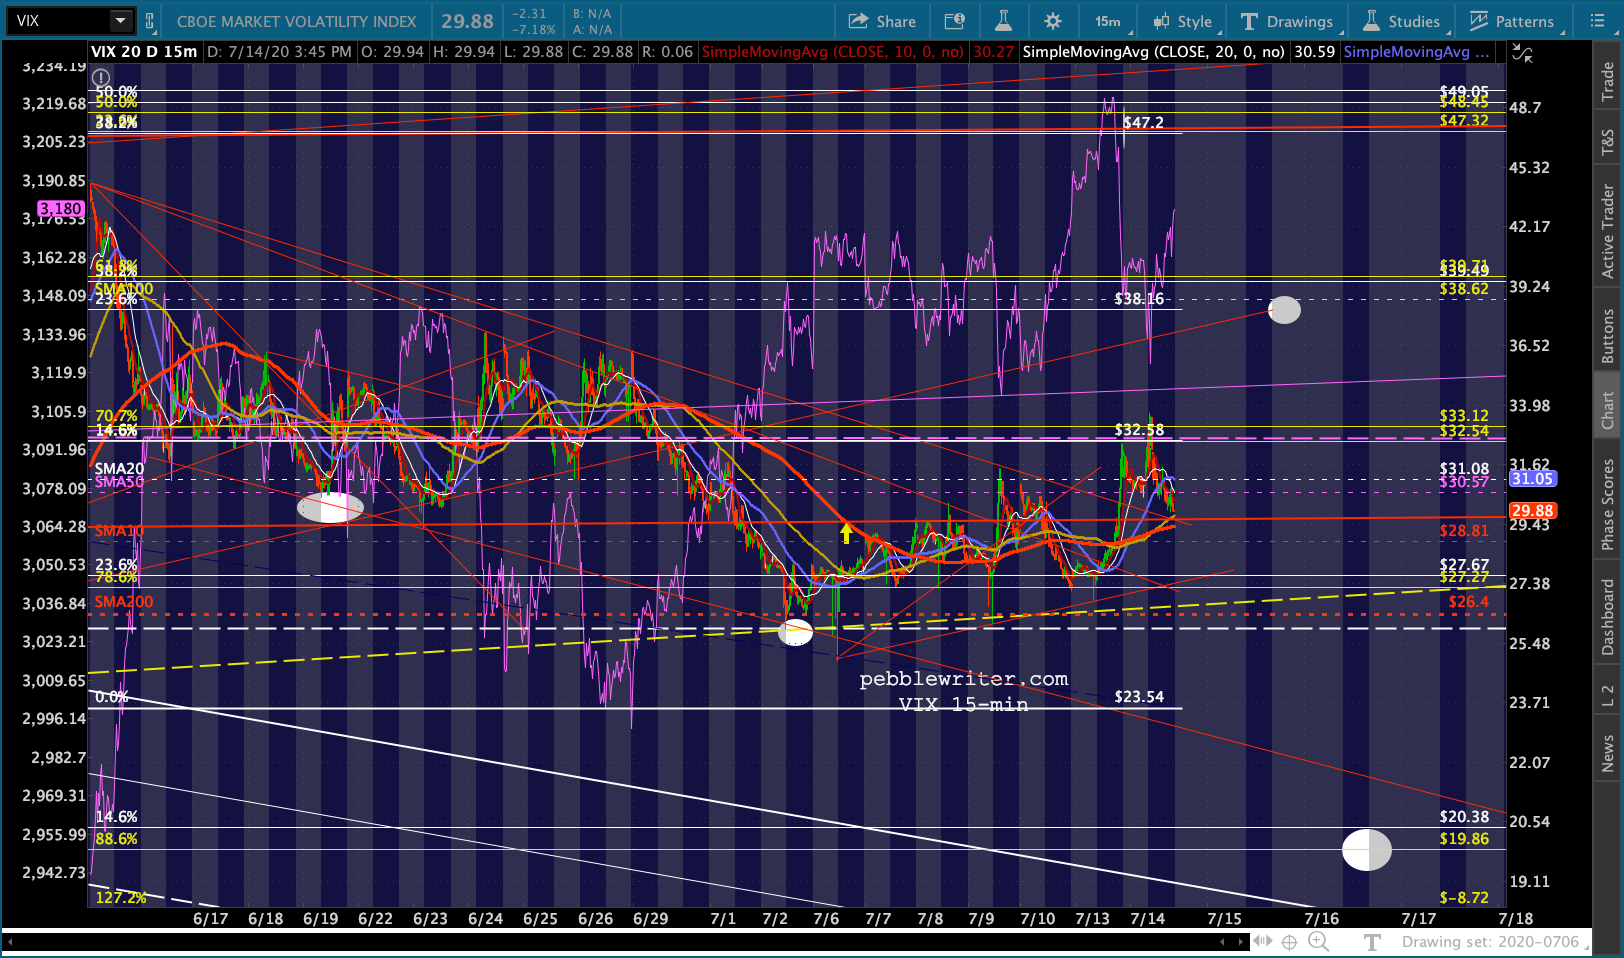
Another day, another V-shaped snapback rally beginning with a bounce on the yellow channel midline. The FAANGs aren’t faring well, though. 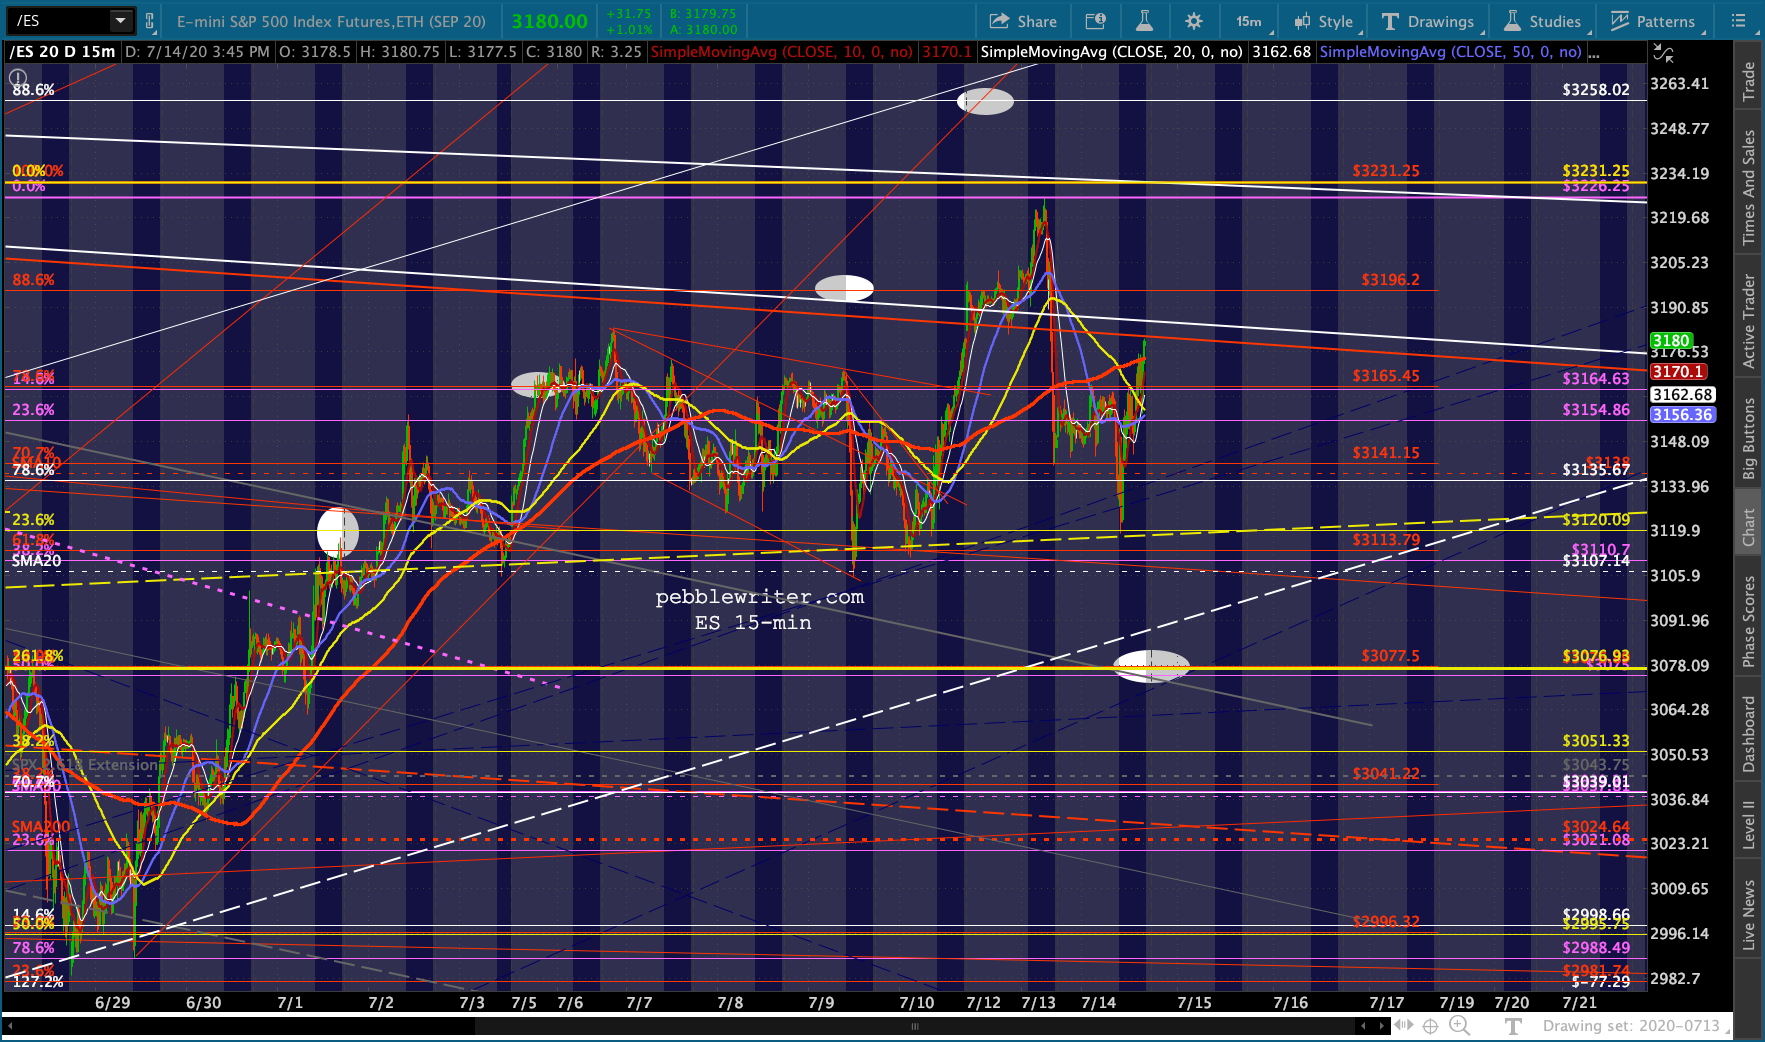
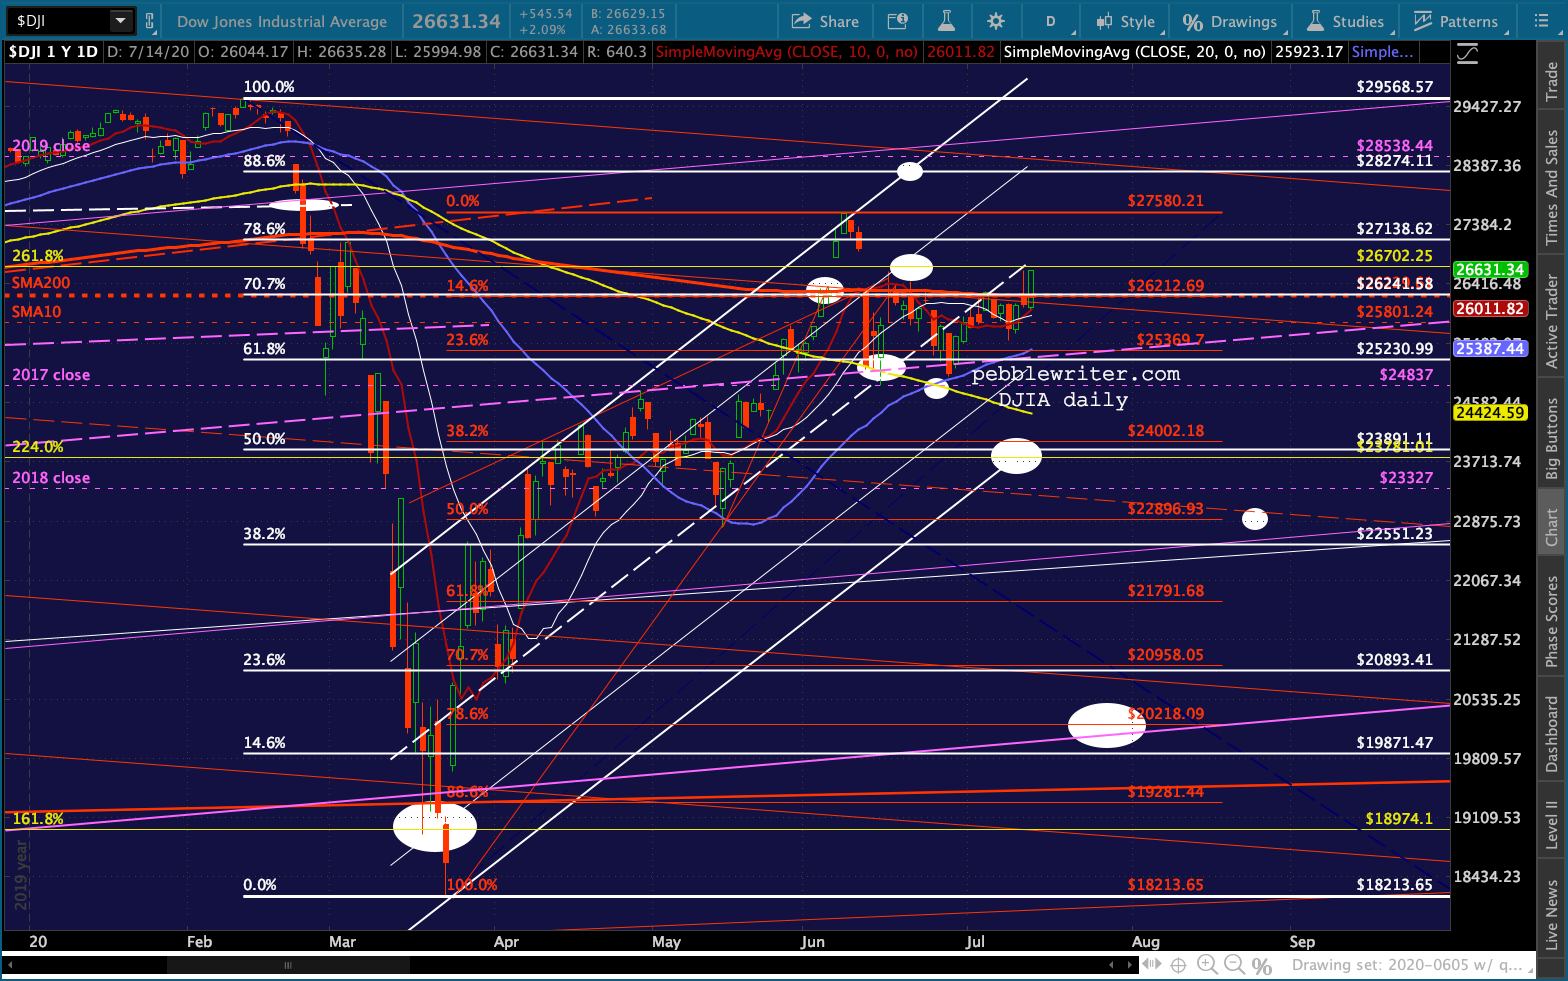
 The Dow is pushing well north of the SMA200 again, led by some of the high-priced stocks in the index which are up sharply.
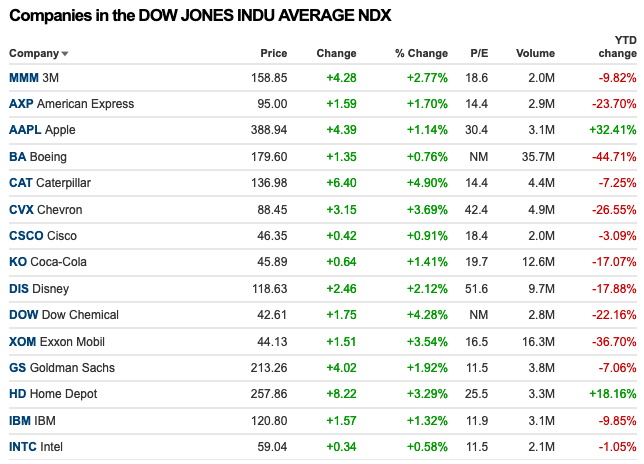 UPDATE: 3:57 PM
Unbelievably, ES has now made up half the distance to the .886 at 3258.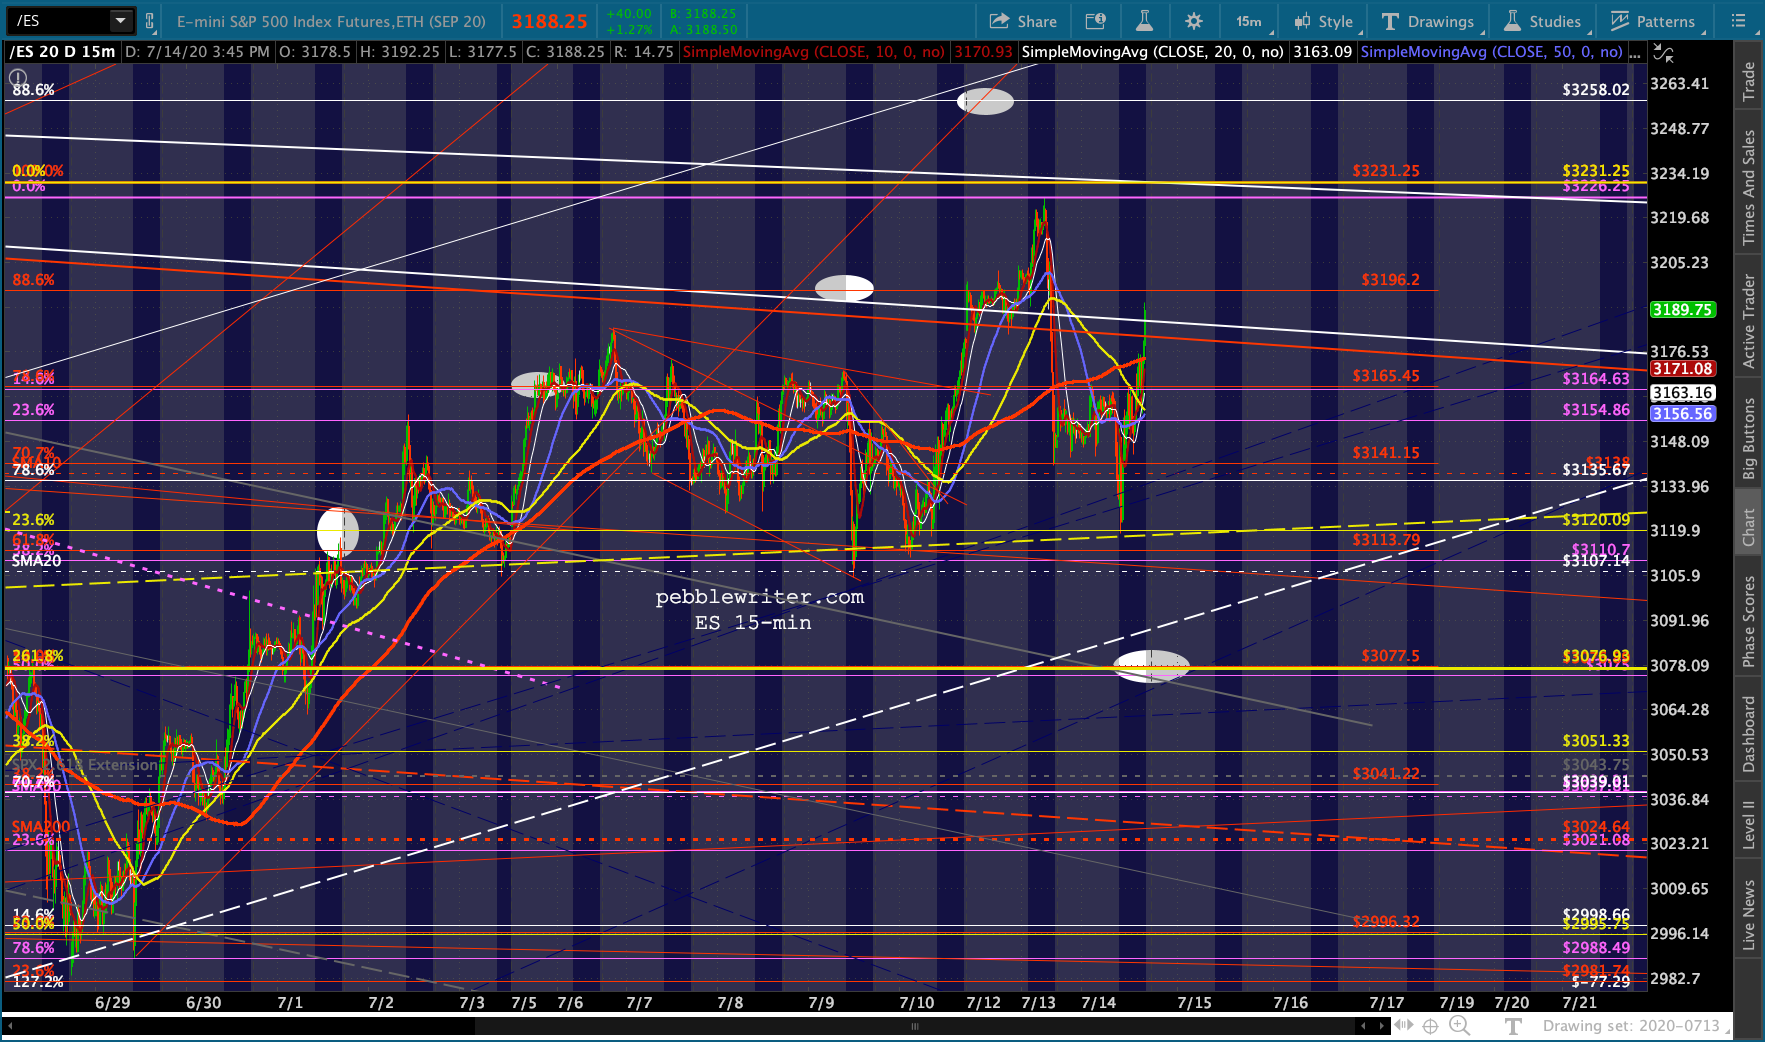 Even though AAPL shows up about 1%, it has actually lost ground vs yesterday’s highs.