Month: February 2018

  • Interest Rates: Just Kidding

    Stocks were not thrilled with Powell’s somewhat hawkish testimony yesterday.  Bottom line, he didn’t do much to inspire confidence that tightening would be limited to three rate hikes.

    The killer line came, however, when he admitted that the US is not on a sustainable fiscal path.  It was, perhaps, the least surprising comment he might ever utter during his tenure.  But, the algos were not amused that he said it out loud.

    This sent note yields spiking higher…

    …which sent stock prices tumbling lower.  Fortunately for the bulls, SPX’s slide landed it right at important support.  It will be very easy to measure whether or not the bounce has run its course for now.

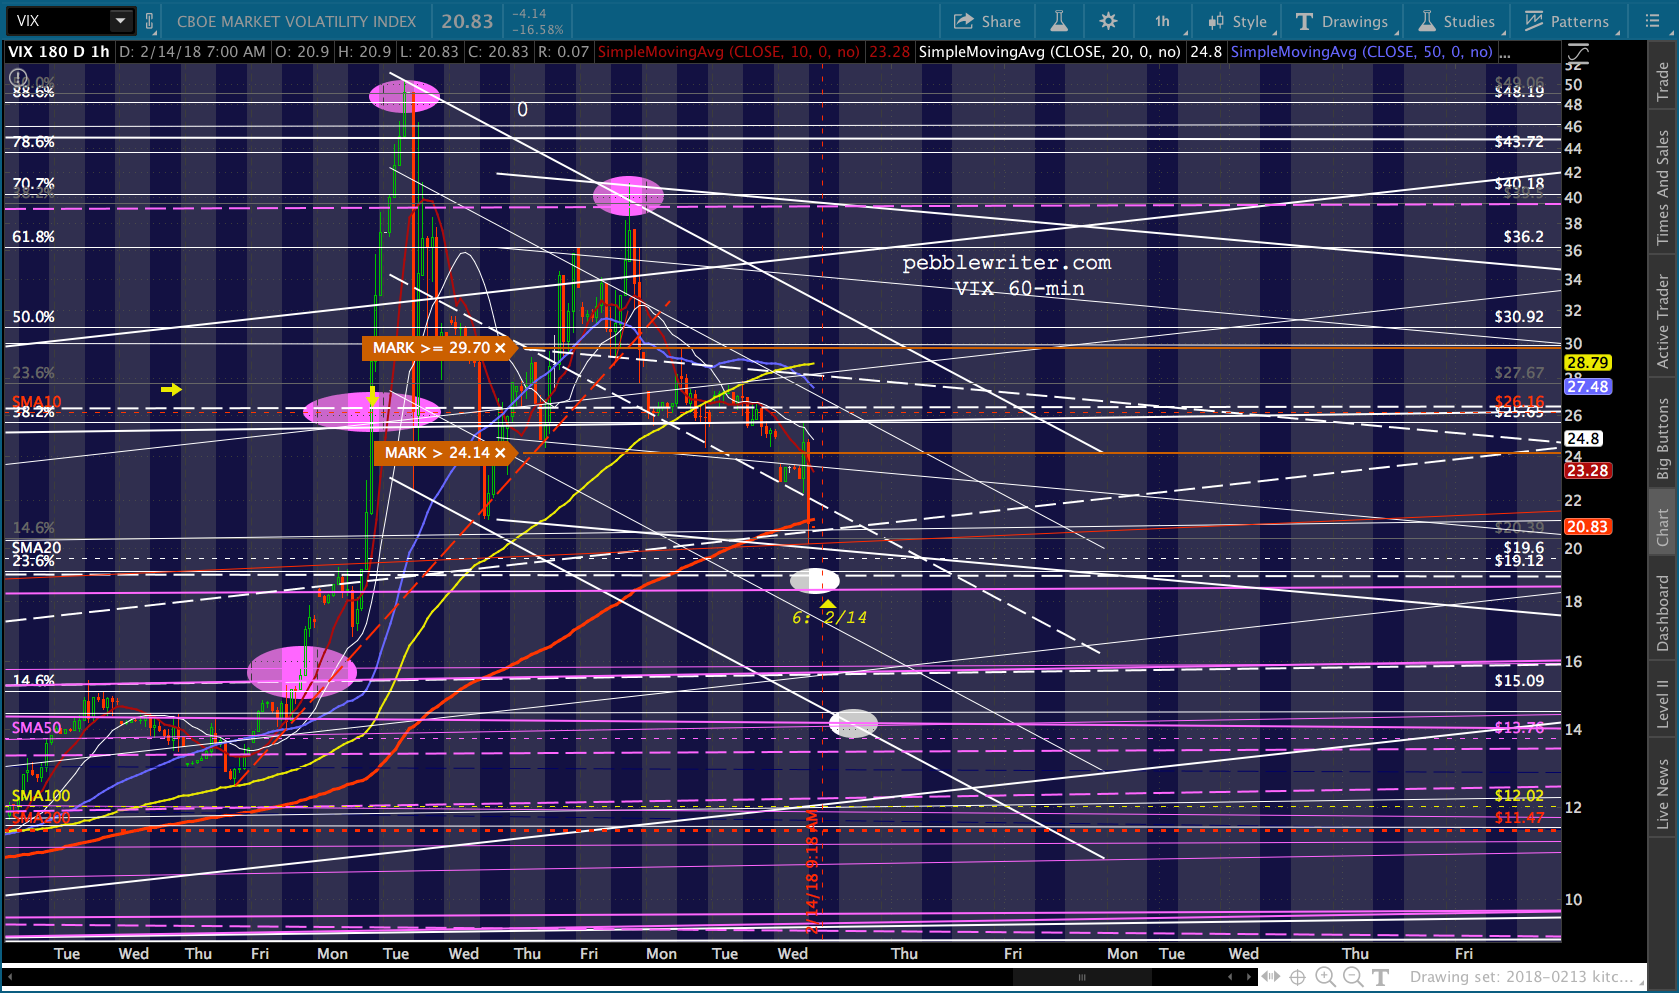
    Keep an eye on TNX and VIX today, as they should both provide clear signals.

    continued for members(more…)

  • Powell’s French Toast

    I made French toast for my daughter this past weekend.  Most people think I’m a pretty decent cook, especially with weekend staples like French toast, pancakes, etc.

    I left her to chow down while I went back to work — only to find this when I returned.  The conversation went something like:

    Me: Didn’t you like it?
    Her: I don’t like the crust.

    It reminds me of the task ahead for newly minted FOMC Chair Jerome Powell.  He must somehow convince investors that the economy is yummy, but that inflation (the crust) isn’t a problem.

    In his prepared remarks, he cites the 1.5% core PCE annual rate (as of December) in describing inflation as “low and stable.”  He further makes reference to some of the monthly data:

    We continue to view some of the shortfall in inflation last year as likely reflecting transitory influences that we do not expect will repeat; consistent with this view, the monthly readings were a little higher toward the end of the year than in earlier months.

    By “a little higher” he is apparently referring to the 0.4% November monthly CPI figure —  carefully avoiding mention of the 0.5% increase registered in January.Hopefully, he will do a good job of explaining how strong economic growth is compatible with low inflation.  The market will not be pleased if he can’t demonstrate more intelligence than Steve Mnuchin did last week, insisting that “you can have wage inflation and not necessarily have inflation concerns in general.”

    I suspect Powell is not only much more knowledgeable, but less likely to stick his foot in his mouth.  If his word salad of prepared remarks are any indication, he will walk the same fine line as his predecessor.  Look for his testimony to promise nothing more than the Fed’s continued focus on maximum employment and price stability.

    All he really has to do is buy some time, keeping a lid on rates until February’s inflation data is released on Mar 16.  The way things are shaping up, it should be considerably lower, supporting the narrative that inflation was transitory after all, irrespective of actual inflation [see Inflation: The Charade Continues.]

    Our analog remains on track. For those who’ve been away, note that I revised the timeline yesterday.  Details may be found in the members’ section at A Break or A Breakdown?  Tomorrow, Feb 28 is our new Day 12.

    Powell’s testimony is a potential disruptor.  But, for now, the algos like what they’re hearing.

    continued for members…
    (more…)

  • A Break or a Breakdown?

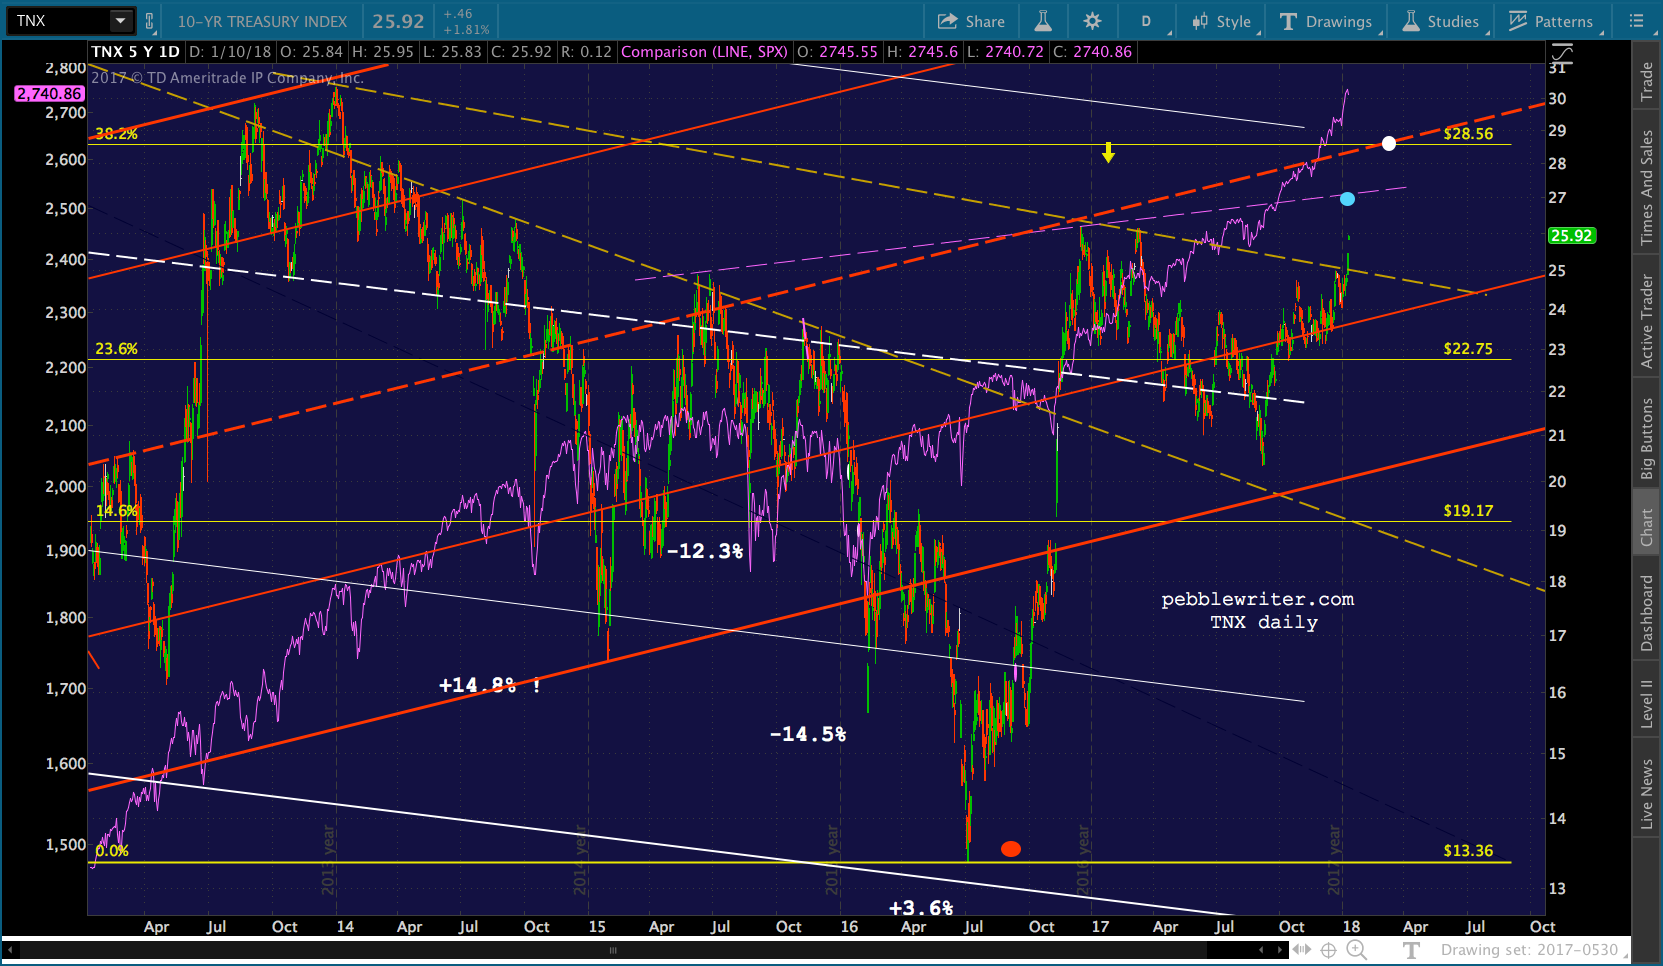
    The 10Y yield has clearly broken trend as expected, with a couple of Fib tests the only things standing between it and our downside targets.  Our 28.56 upside target from Jan 10 [see: China – It’s Not Me, It’s You] has officially yielded. This is what stocks were waiting for — a sign that interest rates’ climb past 3% wasn’t as certain as most analysts suggested.  ES broke out of its slump and pressed on to new highs, finally joining SPX in regaining its 2.24 Fib extension.

    This leaves our analog on track with our next targets easily in reach.  It also confirms the time adjustment that was suggested by the most recent dip and the redrawing of VIX’s (and everything else’s) path for the next six weeks.

    continued for members(more…)

  • Why Rising Rates Are a Problem This Time

    A sharp drop in interest rates has traditionally been a negative for stocks.  The chart below shows that most significant declines in 10-year yields over the years were associated with steep drops in the S&P 500.  Usually, equity losses precipitated the drops in yield.  As stock declines accelerate, money flows into bonds — raising prices and depressing yields.  The crashes of 2000-2003 and 2007-2009 are striking examples.  So are the corrections of 2010, 2011, 2015 and 2016.

    There were several exceptions, when stocks were supported through carry trades and other algo-stroking forces: the 15% rise in SPX between Dec 2013 and Feb 2015, the minor 6.1% drop between Mar and Jul 2016, and the 2.5% rise between Mar and Sep 2017.

    But, significantly, not a single equity correction occurred without a concurrent and significant drop in yields.  This begs the question, then, of whether increases in yields are positive for stocks.

    In 2008, yields bottomed almost 2 months before stocks did in 2009.  But, in the 2000-2003 crash, yields bottomed 9 months after stocks.  Most other yield rallies from significant bottoms also lagged stocks: 4 months in Oct 2010, 9 months in Jul 2012, 3 months in Jan 2015, 5 months in Jul 2016.

    It would seem at least some bond buyers take a “show me” approach, waiting until the coast is clear in equities before shifting money back into bonds.  This analysis ignores the considerable influence that Fed purchases had on bond yields — an influence which the Fed maintains will diminish over the next few years.

    So, what are we to make of the latest spike in yields which began on Sep 7, 2017?  The 10Y rose from 2.03% to 2.94% through Feb 21.  SPX rallied along with it, up almost 17% by Jan 26 — then promptly did a gut wrenching 11.8% nosedive in only 2 weeks.

    Fortunately for the bulls, it got a strong bounce off its 200-day moving average and subsequently bounced to its 61.8% retracement. But, pundits seem fixated on the 10Y with rates nudging up against 3%.  Does it matter?

    In a word, yes.  Even though 3% is still well below historical yields, the level of debt has risen dramatically over the years.  The chart below shows the annual interest expense (the orange line) and the US’ rapidly growing pile of debt. Superimposed over each is the average interest rate (the black line) paid on that debt.

    Even though interest rates have flatlined since 2013, the expense of servicing the rapidly expanding debt has risen sharply — recently breaking out to all-time highs.

    Clearly, if rates were to normalize the interest expense would be unmanageable.  How unmanageable, you ask?

    Between 2000 and 2007, the average interest rate was 4.84%.  On the current $20.6 trillion balance, that would mean an annual interest expense of roughly $1 trillion.  And, we haven’t even begun to talk about the effect on consumer debt, the mortgage market, debt issued to fund corporate buybacks, etc.

    Obviously, an increase in the 10Y yield doesn’t immediately reprice the entire pile of debt.  But, it’s a clear step in the wrong direction.  And, investors are right to be concerned.  I imagine the Fed is also quite concerned — which is why I put a target of 2.85% on the 10Y back on Jan 10 [see: China – It’s Not Me, It’s You.]

    Not only did it represent channel and Fib resistance, but it seemed like a good tipping point for what I expected to be rising concern (one can hope) about our shaky fiscal situation.  TNX overshot it a little, which has been fairly common over the years (Feb 2011, Sep and Dec 2013, etc.)

    Those previous overshoots typically helped stocks get past resistance.  It might work this time, too.  But, judging from the mood out there, I don’t believe stocks will be led higher by higher interest yields this time.  And, I have trouble believing the Fed isn’t working to put a lid on long rates – yield curve be damned.

     *  *  *

    Related Posts:

    Where To Next?
    The End is (Probably) Near
    CPI: The Charade Continues
    Update on Bonds: Jan 29, 2018


  • Bullard!

    I remember Oct 15, 2014 like it was yesterday.   SPX had risen sharply on the back of the yen carry trade, popping through important Fib resistance at 1823. But, it had just broken trend line and channel support.  To make matters worse, it had just dropped through its SMA200 at 1905.The culprits? USDJPY had reversed off heavy resistance and its 10-week rising channel had broken down.  And, equally concerning, the bond market signaled more stock carnage to come.

    As we noted at the time:

    The more troubling development for Mr. Market is the bond market. The 10-yr note futures shot through the previous high overnight, complicating the prospects of a quick resolution to the market’s correction.

    Note that while we might see a reversal today on the white Fibonacci grid — the .786, .886 or the 1.272 itself — we still have to deal with the grey grid, which suggests the possibility of a drop to the .786 at 1798 or the .886 at 1770.

    A drop to 1800 would have meant giving up that important Fib support at 1823.  More importantly, a 10% correction would occur with a drop to 1817.33 or lower.  Who needed those headlines in the middle of spectacular rally to new all-time highs?

    The solution?

    SPX’s plunge halted at 1820.66 — 3.33 points above what would have been an official correction.  No fuss, no muss.  The Fib line which had once loomed as formidable resistance could now be reclassified as support.

    What has been is what will be,
    and what has been done is what will be done,
    and there is nothing new under the sun.
    Ecclesiastes 1:4-11

    As I went to sleep last night, marveling at how SPX had taken a rather circuitous path to our 2703.62 target,I wondered whether the 2.24 Fib would hold.

    I found myself thinking back to 2014.  Maybe Fed President Bullard would make another appearance.  I didn’t have long to wait.

    On CNBC this morning…

    click to play video


    Futures are currently up 27 points off their overnight lows (bounced at the 10-day moving average, probably about 60 seconds after Bullard was booked on CNBC.)  At least we weren’t kept in suspense too long!

    Oh, and for those wondering why/how yesterday unfolded as it did, take a look at VIX.  See that little dip (yellow arrow) below the trend line from Jan 26?  Yep, that’s all it took.

    When VIX climbed back above the yellow trend line, SPX promptly gave up all its pre-minutes ramp job.VIX has obviously proven it’s still incredibly powerful.  Who needs a 40% spike when a 20% one can put on the brakes so effectively?  The flipside, of course: if VIX decides to pop up to 26 anyway, SPX will likely ignore Bullard and also test its SMA10.

    Bullard might be able to divert attention from the interest rate problem.  But, it clearly hasn’t gone away.

    This time, it’s a spike in rates rather than a plunge.  So it’s a different kind of interest rate problem.  As a result, this one might be tougher to rectify.  And, the implications for the overall economy are much more serious.

    continued for members(more…)

  • Any Minute Now…

    The last time the FOMC released minutes was Jan 3 [see: Will the FOMC Minutes Save the Dollar?]  At the time, we looked at the effect of FOMC rate hikes on the dollar index (DXY.)  The obvious conclusion was that rate hikes in 2017 had marked interim tops, while failures to hike rates has produced temporary bumps that lasted anywhere from 1-6 weeks.

    Here’s the exact same chart, updated with January’s non-hike.  In honor of today’s Fed minutes release, I’ve also added markers (the purple arrows) for previous releases.

    Looking at each, you’d have to conclude that either: (1) the FOMC knew what they were doing, and wanted to talk the dollar down throughout 2017; or, (2) they had no clue how to prop it up.  What’s interesting to me, as a chartist, is how well the inflection points occasioned by the minutes releases tracked our falling white channel — allowing our forecast from last May [see: Update on US Dollar May 1, 2017] to play out very precisely.Our conclusion back on Jan 3 was that the minutes would not only not save the dollar, but its continued slide would present problems for stocks.

    With TNX about to break out, we can expect continued weakness in DXY.  Needless to say, this will present difficulties for the yen carry trade crowd and, ultimately, equities.  I suspect the dollar’s slide isn’t over — with our targets at 88.423-88.682 the next major support when it breaks below September’s lows.

    If [SPX can’t push through 2703] then the first real support is the bottom of the gray channel, currently around 2588. And, if that fails, then the SMA100 is currently around 2560 and the SMA200 is around 2485.

    We all know what happened next.  The minutes produced a momentary bump in DXY and USDJPY, safely escorting SPX through the resistance at 2703.  At the same time, CL went on a month-long 11% tear and VIX continued to plunge when necessary.  SPX didn’t look back until reaching 2872.

    At that point, the rally ran out of steam.  Obviously, it was overbought.  But, DXY’s slide from 92 to 88 didn’t help.  Nor did USDJPY’s plunge from 112.5 to 105.5.

    The most intractable problem, however, was the sharp rise in interest rates.  They reflected a growing recognition that the sharp spike in oil and gas prices which helped fuel algos throughout December and January would also produce inconveniently high inflation.

    When the 10Y broke out on Jan 10 [see: China – It’s Not Me, It’s You] we slapped a 28.56 target on TNX — a target it reached on Feb 5.  Not so coincidentally, Feb 5 was the day SPX plunged back below support (formerly resistance) at 2703.  The next day, SPX plunged to within 5 points of our 2588 target.  Three sessions later, it tagged the 200-day moving average.

    The rally off of 2532 has been impressive, following our analog [see: Analog Watch] very closely for the past two weeks.  As we wait for word on whether to expect three or four rate hikes in 2018 (at least, so everyone says,) our analog suggests that the Fed will have to deal with the divergence between spreads and the 10Y itself.It might not be pretty.

    continued for members…
    (more…)

  • Fibs, Fans and Logs

    The chart below usually stops charting skeptics cold in their tracks.  We can argue all day about whether Fibonacci levels should matter.  But, it’s pretty obvious they have.

    The reversal in 2010 at the .618 Fib resulted in a drop tot he .382.  The tag in 2011 at the .786 Fib yielded a drop to the .500.   The most recent large reversal came in 2015 at the 2.618 at 2138, resulting in additional backtests of the 1.272 at 1823.We can also see the importance of moving averages — with the 100-day (yellow) and 200-day (red) figuring prominently over the years.  And, of course, channels have been extremely helpful in identifying periodic tops and bottoms.

    I tend to chart in logarithmic scale because, besides making more logical sense to me, it offers earlier warnings of breaks in trend.  According to the chart in log scale above, SPX has bounced (off the SMA200) to the midline of the rising white channel — often a point where reversals occur.

    But, if we map a channel to the past couple of years in arithmetic scale, we get a very different result: a wild overshoot that corrected and is now back to the channel top — a moment of truth for the bulls.

    Today is Day 9 of our analog, so we have a pretty good idea what to expect.

    continued for members(more…)

  • Now We’re Official

    DXY just made it official, tagging the .618 Fib at 88.423 overnight.  It came close on Jan 26, coming within 0.015 before a strong bounce which surprised a lot of people by not supporting stocks.This latest move, along with VIX reaching our downside target, made it possible for ES to tag our first upside target from Feb 5 – albeit two days late.I suspect this had more to do with SPX’s delay in tagging its own SMA200 than anything else.  Bottom line, our analog remains on track.

    continued for members(more…)

  • Where to, Next?

    It’s an odd feeling when multiple forecasts play out all at once.  It’s exciting, probably not unlike drawing several royal flushes in a row.  Except, in the case of the markets, it has less to do with the luck of the draw and everything to do with detecting how the house has rigged encouraged a particular outcome.

    DXY is about to tag the next lower target we set back on May 1, 2017.

    EURUSD is within .0043 of the target we set on Jan 8.

    And, USDJPY just reached a target we set last October.

    On the bond side, the 10-yr note has slightly overshot our 28.56 target from Jan 10...

    …which could potentially accelerate the yellow channel bottom tag posted on Jan 31.

    Perhaps the most satisfying results have been on the equity front.   After many false alarms during the Great Meltup of 2017, we wondered on Jan 30 why we weren’t getting the usual instantaneous recovery and included 2703 to our downside case for SPX.  We added 2732 and 2533 on Feb 2.  SPX nailed our 2533 target a week later (2532.69.)

    As SPX was tumbling on Feb 6, however, an analog became apparent [see: Analog Watch.] If it played out, the bounce from the upcoming lows would be very sharp and VIX would collapse from its then current value of 49.21 to 19.10 (refined on Feb 7) by Feb 14.

    After SPX bottomed at our 2533 target, we set 2765 on Feb 14 as our initial upside target.  This was modified on Feb 12 to 2719.   Earlier this morning, SPX reached 2717.66 — a nice 184-pt bounce from our buy signal at 2533.  While a day late, this qualifies as pretty decent outcome.  And, we’re not done yet.

    My point in presenting the above isn’t to toot my own horn (okay, maybe just a little.) Rather, it’s to point out that by understanding the motives and methods of those pulling the levers, and paying attention to chart patterns, Fibonacci patterns and analogs, reasonably accurate forecasts can be made.

    I heard a financial commentator say, this morning, that higher interest rates must not be that big a deal.  The 10-yr was pushing 3% and stocks were soaring, so all the anxiousness we saw over the past couple of weeks was overdone.

    This is one of the silliest things I’ve heard all week.  To this, I would say don’t confuse the ability of algos (which, as we saw last week can push stocks in both directions) to rescue markets with an economically sound framework.

    The corollary, of course, is don’t confuse the market with the economy.  The US might well be way in over its head, with $100 trillion in obligations (most of which would cost more to meet if rates continue to rise), a growing budget deficit, and consumers who are piling on debt in order to keep up with actual inflation.

    But, that doesn’t mean the party is over — at least, not yet.

    continued for members…
    (more…)

  • CPI: The Charade Continues

    Maybe some day someone will draw attention to the many ways CPI data is falsified.  We’ve written about this extensively, most recently in December [see: Again with the CPI Games?] when gasoline prices, which had risen 20.3% YoY for November, were reported by the EIA as a 17.5% increase.

    Of course, by the time the BLS was finished massaging the data, gas prices had increased by only 16.5% and the “energy index” increased a measly 9.4%.  Combined with the ludicrous methodology in calculating shelter costs, the BLS was able to report headline CPI had increased only 2.2%.

    Equity buyers were thrilled.  SPX gapped higher on Dec 18th (the day CPI was released) and never looked back.  Bond buyers weren’t as sanguine.  The 10-yr, which had traded at 2.35 the day before, was up to 2.49 two days later.

    This morning, we get more of the same.  The EIA reported an 8% YoY increase in gas prices for January. (2.467 vs 2.285.)  It was reported by the BLS as an 8.5% increase.  There’s nothing, in particular, wrong with these figures….except that they’re a lie.

    Here are the closing prices for RBOB (gasoline futures) in Jan 2018 compared with Jan 2017.  The average close in Jan 2017 was 1.5772, compared to 1.8583 in Jan 2018.  That’s a 17.8% increase.

    The extent of the increase is immediately obvious from the RBOB chart below. The Jan 2017 range is shown in 2018 for comparison purposes.  There was zero overlap.EIA reported an average of 2.467 for Jan 2018.  Even a casual glance at the chart below shows that gas might have touched 2.467 only around the first of the month, spending most of its time much higher.My own data, taken from AAA’s daily gas price report, showed that gasoline was as low as 2.467 on exactly one day: Jan 1.

    Why the charade?

    I’ve been listening to the financial news this morning.  Pretty much every single commentator has opined that, while the 0.5% monthly CPI increase is “concerning,” the 2.1% annual increase means inflation is definitely not out of control (how bad might things have been without the manipulation?)

    S&P futures, which just dropped 48 points, beg to differ.  For once, even bulls are openly wondering whether the Fed has, indeed, lost control.  A dismal retail sales figure (the biggest decline in 11 months) hasn’t helped.

    Fortunately for them, VIX manipulation is alive and well.  Pay no attention to the momentary pop in the “fear index.”  It’ll be down to our targets soon enough.And, isn’t it great to see the mainstream financial media start to report on this?  MarketWatch, CNBC, Bloomberg, et al have stories out this morning on the whistleblower lawsuit alleging that someone has been manipulating VIX.  Gosh, really?

    I and many others have only been writing about this for, oh, 5 or 6 years, so it’s nice to see ace reporters jump right in — even if it is to point out how ludicrous the allegations are.  Bloomberg’s article appears to have been penned by the CBOE, which derives 25% of its profits from VIX trading and is quoted extensively throughout:

    The claim sounds dubious: the VIX, that index at the center of the stock market’s wild gyrations over the past week, is somehow being manipulated.  That allegation, made to federal authorities by an anonymous whistle-blower, captivated Wall Street on Tuesday, prompting both quick dismissals and more than a few raised eyebrows.

    I imagine most of the eyebrow-raising is related to who is doing to manipulation rather than how they’re doing it.  Ask yourself: who might have an interest in aggressively shorting VIX smack dab in the middle of a 4.5% futures flash crash?  Who would have the money, the mandate and the cajones?

    It’s the equivalent of writing thousands of homeowners’ insurance policies as the tornado sirens are spooling up.  Yet, this is exactly what happened on election night in Nov 2016 [see: The Fallout and Why the “Trump Rally” is a Fraud.]

    My conclusion all along has been that it was the Fed itself, shorting VIX then and at all the right moments since then to ensure that market volatility was limited to rallies, never declines.

    Yet, an explicit admission by then-Governor and now-Fed Chairman Jerome Powell in the Oct, 2012 FOMC transcripts has gone completely unreported in the media [see: The Fed’s Short Volatility Position.]  You’d think one of the intrepid “journalists” covering the current story might have found it relevant.

    While I’ve been ranting “someone” has been hard at work…shorting VIX.  It has fallen from its initial 25.72 highs to 20.21 (-21%) and has further to go.ES has recovered 34 of its 48-pt loss and is off a manageable 10 points.  If VIX continues dropping as I expect it to, the algos will soon turn the indices sharply positive.

    I’m certainly not complaining.  This is all perfectly in keeping with our analog from Feb 6 [see: Analog Watch] which has already produced nice gains in VIX, SPX, RB, CL and gold.  The currencies are just getting started.

    continued for members(more…)