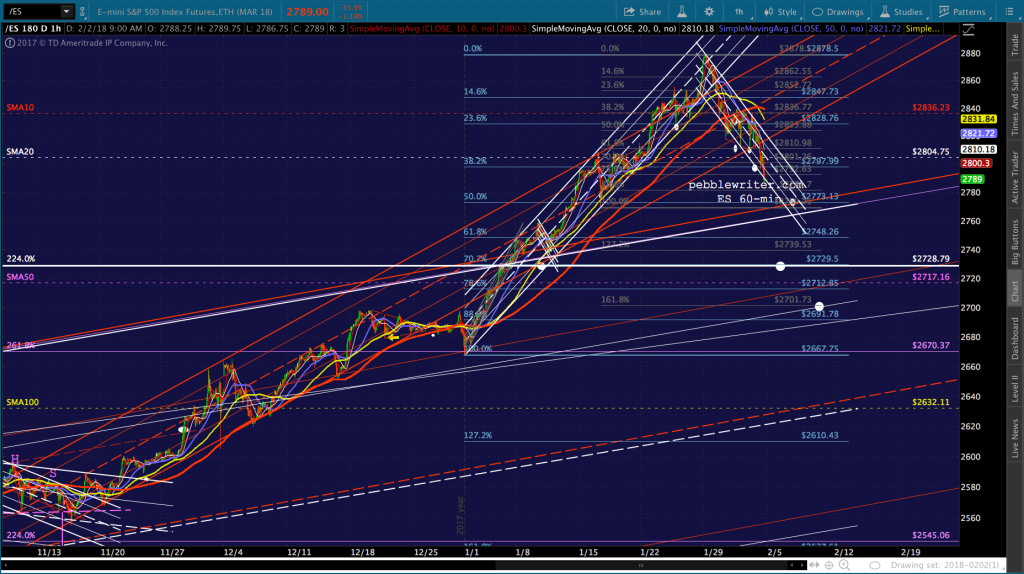
Despite yet another ramp job, ES fell overnight to our next downside target at 2797.99. It is currently holding just below its SMA20, with a very good chance of putting SPX in a position to at least tag its channel midline (2790ish.)  This is made possible by TNX which, at 28.43, came within 0.13 of our upside target…
 …and, ZN, which has reached our 120’315 target.
 One notable holdout in this morning’s TagFest is VIX — which is still languishing below 15. If our forecast is correct, it has further to go — as do stocks.
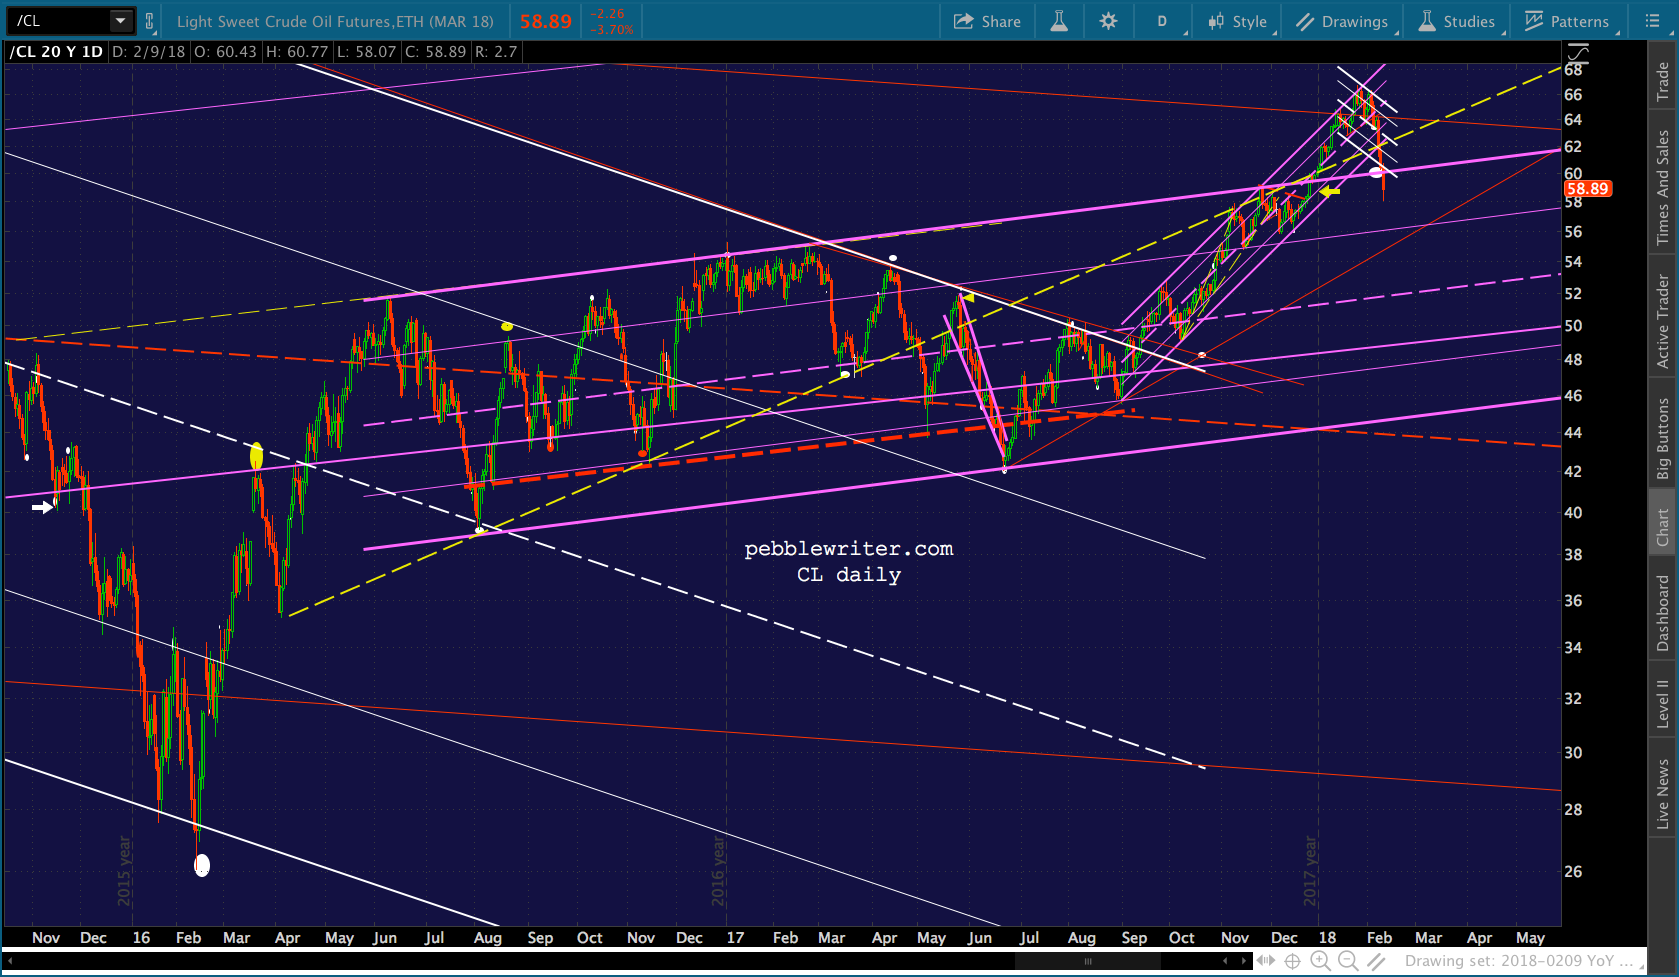
Keep an eye on oil and gas, which are also due for a tumble.
continued for members…
 SPX’s targets from yesterday — the “channel is holding!” headfake.
  UPDATE: 10:05 AM
TNX has reached 28.54 and SPX has reached the white midline. RB and CL are helping a great deal, though RB is at potential support and ES just reached its gray .786. We should see a bounce here.
 Should see a bounce here for RB, at channel support, and CL — to hold the white midline.

 Note that ES still has another 20 points to go in order to reach its channel top backtest at 2773. Since it and SPX are already down 30 points, I imagine we’ll get a bounce before it plumbs much lower.
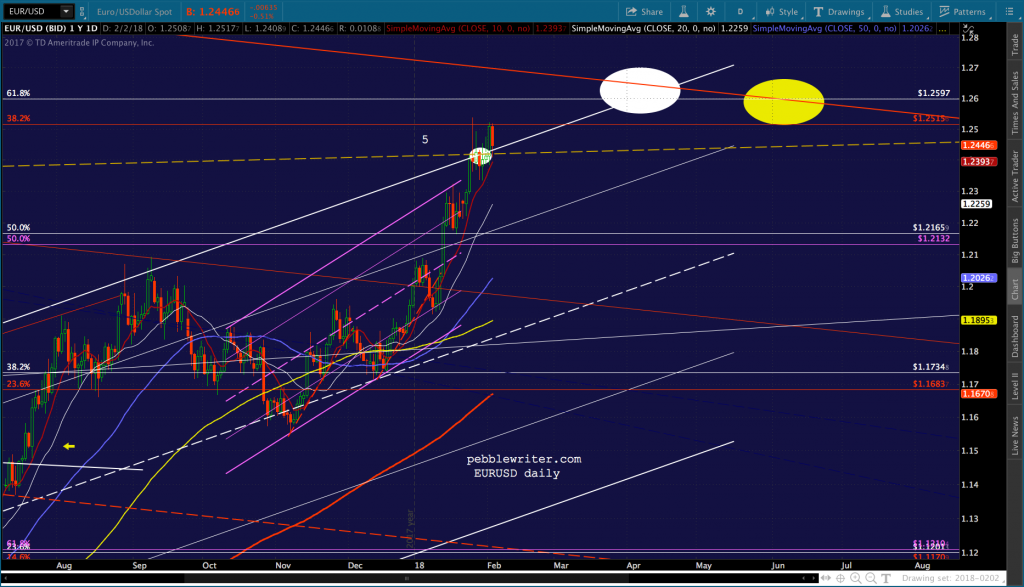
 There is still plenty of dry powder in the form of EURUSD, which is backtesting its neckline after pushing as high as 1.2521 yesterday…
  …and, DXY, which is pushing up past its white midline. As we’ve discussed many times, the question is timing. Will they rip the bandaid off or let things cool down a bit first?
 UPDATE: 12:00 PM
I’ve had a lot of charts point to Feb 12 as a potentially important date. Here’s another one. I believe this bounce is probably going to fail, and we’ll get more downside next week. For brave souls, I’d consider staying short with relatively tight stops.
 On the assumption that DXY is going to make another dip, I’d also take a chance on GC bouncing here and revert to long. Probably early, though…
 The tricky thing is VIX. If it tags 16.13 today, where does that leave it with respect to an 86+ point drop? I don’t believe it could accommodate that without blowing out of the falling white channel that it’s already poking out of. I had assumed it would snap back into it after reaching 16.13. At this point, that assumption is looking iffy at best.
 Updates on the rest…
 Note that USDJPY has bounced back into the rising white channel, but has backtested the red TL connecting recent lows. For nimble traders, this probably represents interim resistance — especially if DXY is going to complete a trip to 87.26-87.45.
 UPDATE: 13:23 PM
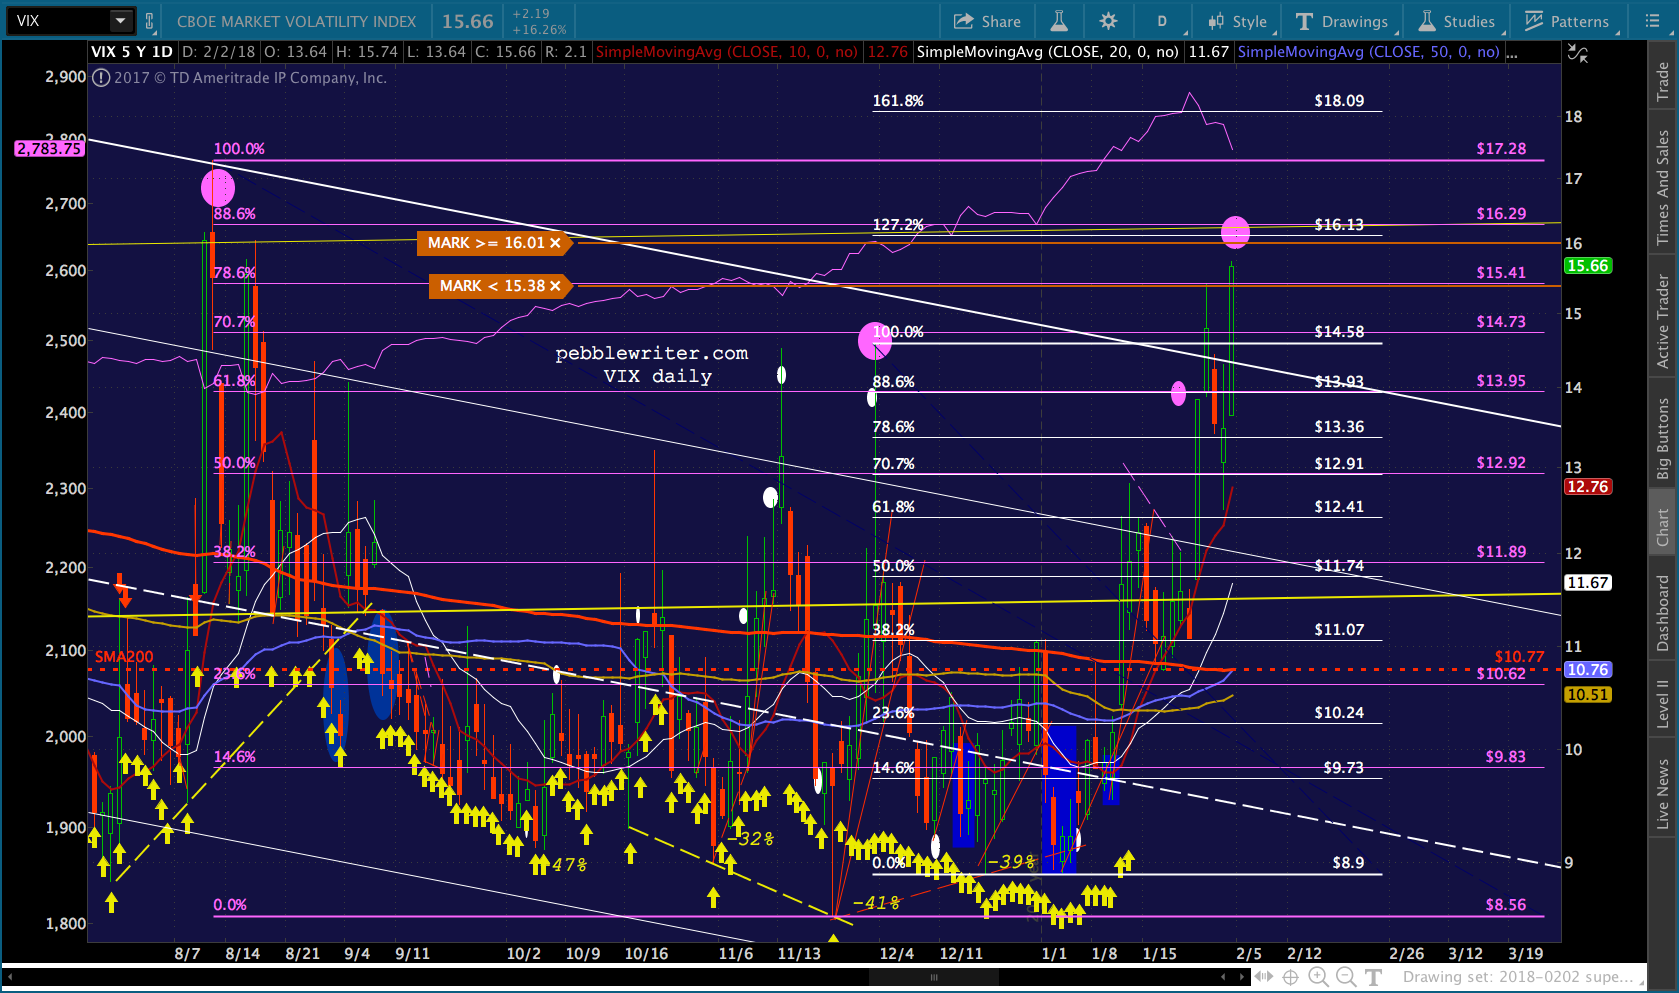
A look at the daily chart on VIX. If we’re going to reach SPX 2703, a breakout in VIX might be just the ticket. Still, cautious traders might want to either take profits at 16.13-16.24, or at least consider trailing stops.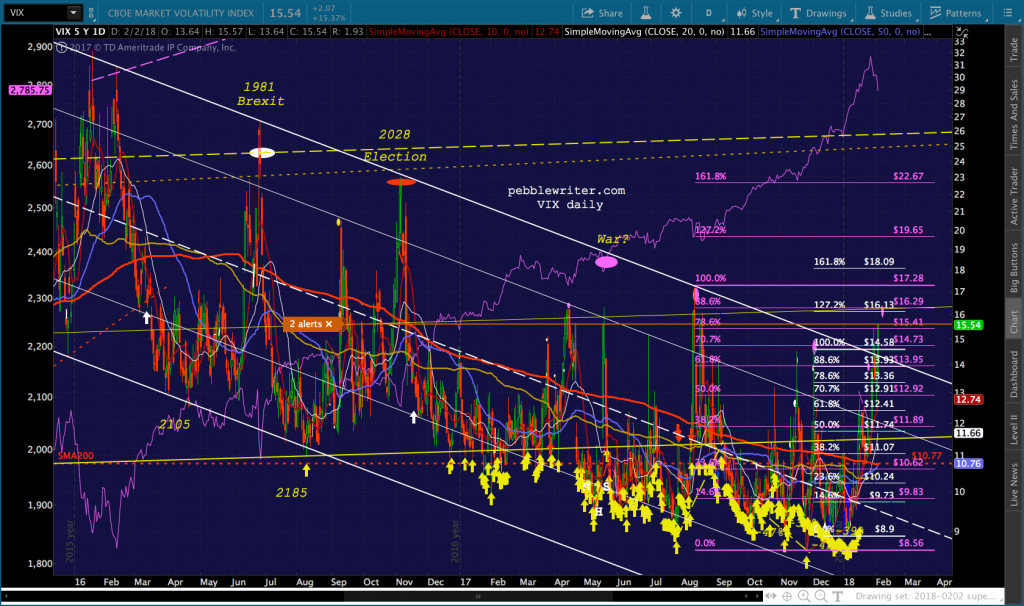 The biggest problem with SPX 2703 is ES 2728.79 — the 2.24 extension of its decline between 2007-2009. It’s the equivalent of 2729 in SPX — a good 26 points away from Fib support. Looking at it the other way around, reaching 2703 on SPX would mean 2700 on ES — pretty much no man’s land in terms of Fibs.
Sure, we could get an overshoot after hours — happens all the time. Just know that there’s a conflict there. The easier, safer course for TPTB would be to hold SPX at the white midline — about 2787, or even let it drift down a little lower in order to get the VIX tag before snapping it back above the midline by the EOD. But, judging from VIX, they might have either misjudged it, or even lost control.
UPDATE: 2:00 PM
Keep a close eye on VIX. I don’t trust it to hold these levels and worry that it’ll retreat to 14.33 into the close in order to close below the channel top — perhaps to pop up to 16.13 on Monday?
We originally got in at 9.33, so this is a pretty nice 68% gain already — especially since almost all of you got in with options or futures. At the very least consider some stops.
UPDATE: 2:24 PM
Probably a decent place to exit if you’re not planning to hold short over the (long, risky) weekend. VIX is at 16.21 — right between our two upside targets — and ES just tagged our next downside target. I’d be right back to short, though on any move through these levels.
 Though I haven’t mentioned it today, remember that EURUSD and DXY could complete their moves after-hours either today or on Sunday. VIX also “trades” for 15 minutes after SPX closes. In other words, there’s no guarantee that any of these will have any effect on SPX. Would it surprise anyone if SPX bounced back to the white midline (2789ish) in the final hour?
UPDATE: 3:00 PM
Well, here we go! Just broke below 2770 in ES and SPX with VIX popping above 16.29 (next stop 18.09.)

 Next support is 2760, followed by ES 2748, 2728, 2712 and 2701. SPX: 2760, 2749, and 2703. If 2703 doesn’t hold, things will get very ugly. The next major support is the SMA100 at 2632, and then the bottom falls out: the SMA200, currently at 2533.
Trailing stops are strongly advised at 2770ish, as we don’t know when the PPT will cry “uncle.” If VIX crashes back to 14.30, SPX/ES could backtest 2790.
 Unfortunately, I have to run out for a meeting. So, I’ll be watching from my laptop. Best of luck everyone.
UPDATE: 6:00 PM
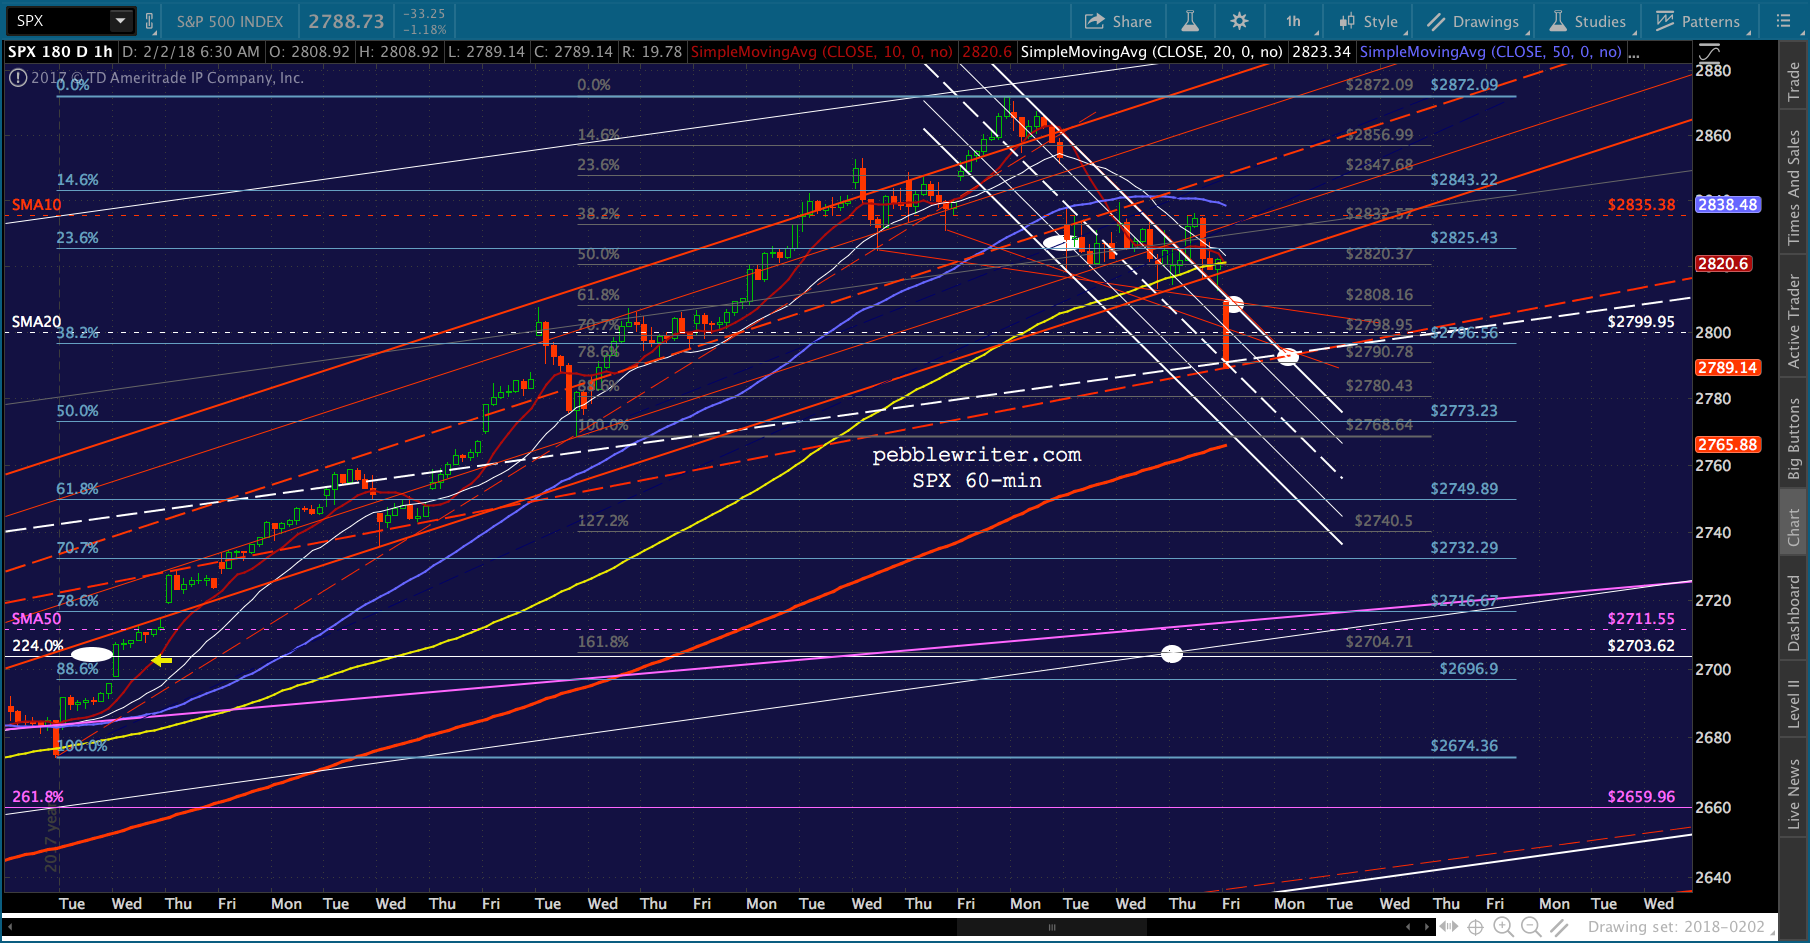
Nice acceleration into the close, but ES stopped at the purple TL — meaning the jury is out on follow through on Monday. Here’s the picture on SPX…
We start with the large purple channel from 2009… …within which we have the more steeply rising white channel which originated at the 1823 stick save (the 1.272)…
 …within which we had the rising red channel that lifted SPX past the white 2.24 at 2703. SPX closed Thursday at the bottom of that channel. It went on to break down today.
Also breaking down, the white channel midline. This is important, because the next stop on a drop through a midline — especially after the .786 line is tagged — is usually the .236 line. In this case, that .236 line just passed through the 2.24 Fib at 2703. Right behind it is the purple channel .786 line that SPX broke above via the red channel. The purple channel .786 line passes through 2703 next Friday. And, a falling channel (white) which contains the recent highs and a reasonably significant low intersects with 2703 next Friday.
Bottom line, a drop to 2703 would backtest the 2.24, the bottom of the falling white channel, the purple channel .786 line and the white channel .236 line. That’s a lot of support. The only problem with that scenario, as we discussed earlier, is that 2703 on SPX would mean a drop through ES’ 2.24 at 2728.
So many times, ES takes precedent over SPX — especially when it reaches support ahead of SPX. If we get capitulation, ES’ SMA200 is around 2532, roughly in line with SPX. Unless VIX reverses immediately, I’d say that’s a very good possibility.


 …and USDJPY dipping toward the 106.50 target we had in place prior to the analog. Is this the time shift we had contemplated or something more?