

They did it again. The EIA just reported that the average price of regular gasoline for the month of November was 2.474.  This is all well and good, except for the fact that gasoline only sold for 2.474 one day during the month of November – the 1st.
 Why the charade? Energy is one of the most volatile components of CPI. The Fed ignores it for many of its economic assessments. But, for consumers, it’s a very real and unavoidable expense. It shows up in everything from the cost of heating your home and driving your car to the price of groceries and manufactured goods.
By using 2.474 as the average price of gasoline, the YoY increase from Nov 2016’s average price of 2.105 was 17.5%. Had the actual average price been used, instead, the annual increase would have been 20.3%. And, if Nov 2016’s average price hadn’t been artificially inflated by the Nov 1 Colonial Gas Line explosion (the yellow arrow below), the YoY increase would have been even higher. It doesn’t seem like a huge difference, but it matters. Note, for instance, that Feb 2017’s 32% YoY increase in gasoline correlated with the highest CPI print in recent years: 2.7%.
In October, when the EIA reported an annual gas price increase of 11.1%, the BLS reported an increase of 10.8%. Fuel oil and gasoline registered the biggest price increase of any CPI component. But, by understating the actual price increase, reported CPI was limited to 2%.
 As we’ve discussed many times, central bankers talk a good game when it comes to inflation. For all their bellyaching about wanting higher inflation, they know full well that the resulting cost of living increases and higher interest rates would simply be unaffordable for a country that can’t even make ends meet with ZIRP (and, a tax cut in the works.)
So, they continue to walk this fine line. Between errant calculations and periodic changes in how inflation is measured, they’ve managed to keep the headline number low enough. But, higher oil and gas prices — which keep algos happy and stocks on the rise — can result in rather inconvenient inflation. They can try to crash oil prices, again. But, that almost blew up the oil industry.
And, with the end of the year around the corner, they have to worry about tanking the stock market. Instead, they’re using falsified data to sell investors on the notion that inflation is non-existent or, to use their favorite term, “transitory.”
Now, for a few charts and our new price targets for CL and RB.
continued for members…Remember, the December YoY comps won’t be as tricky as November’s.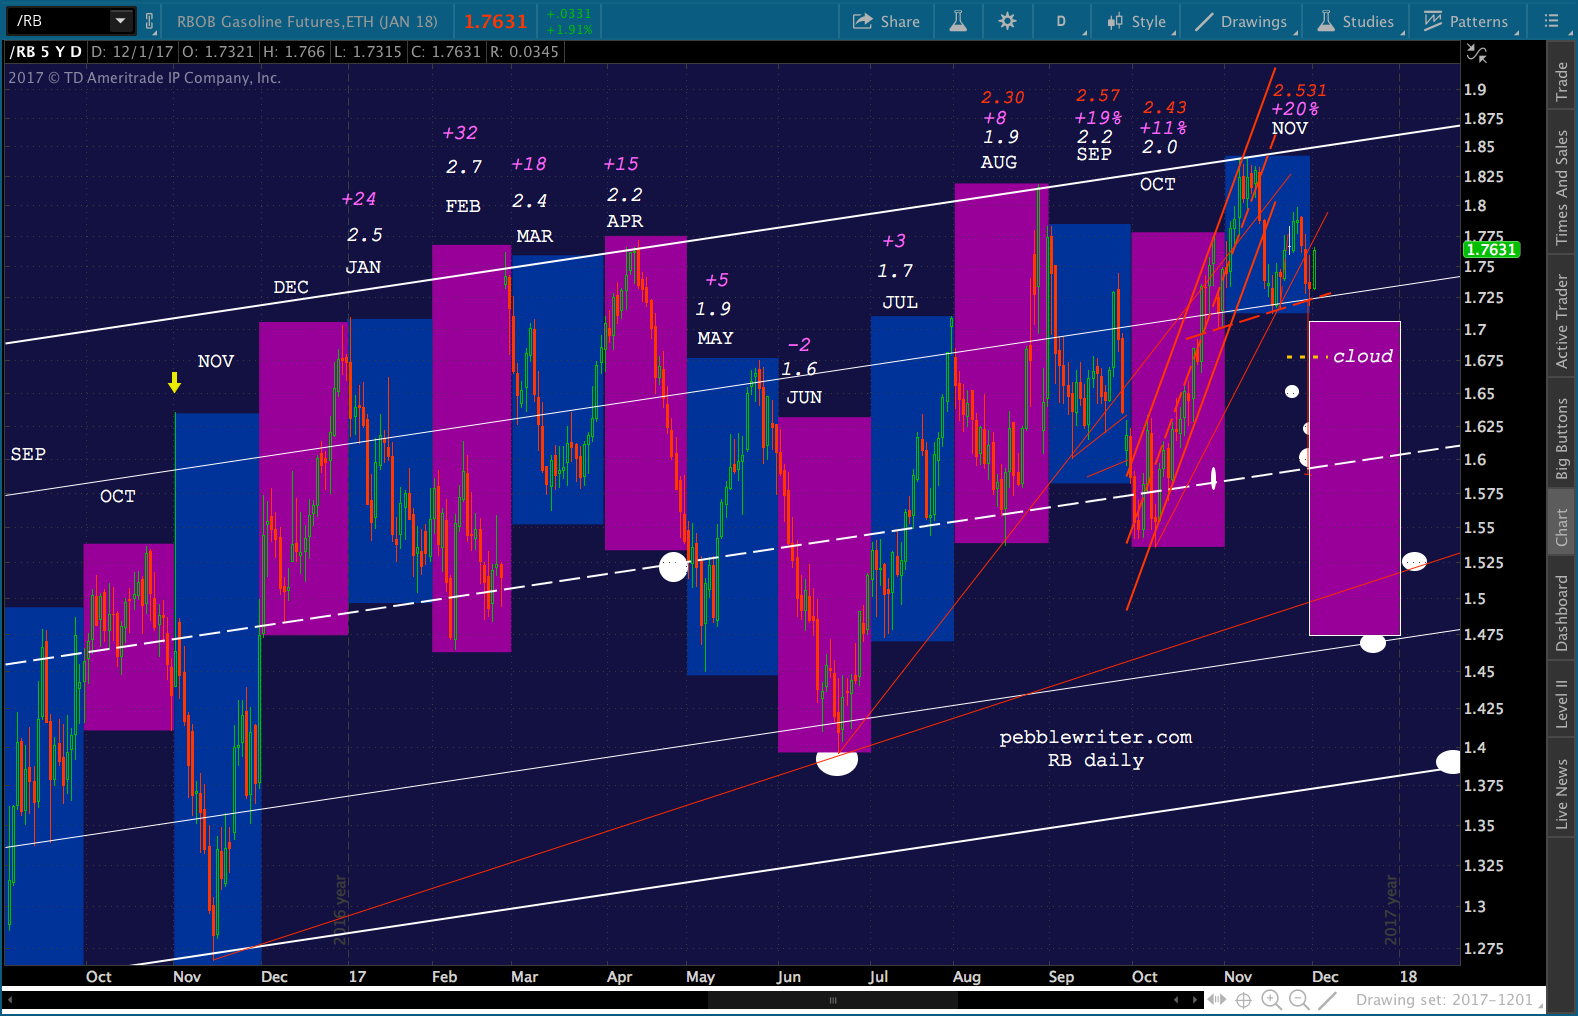
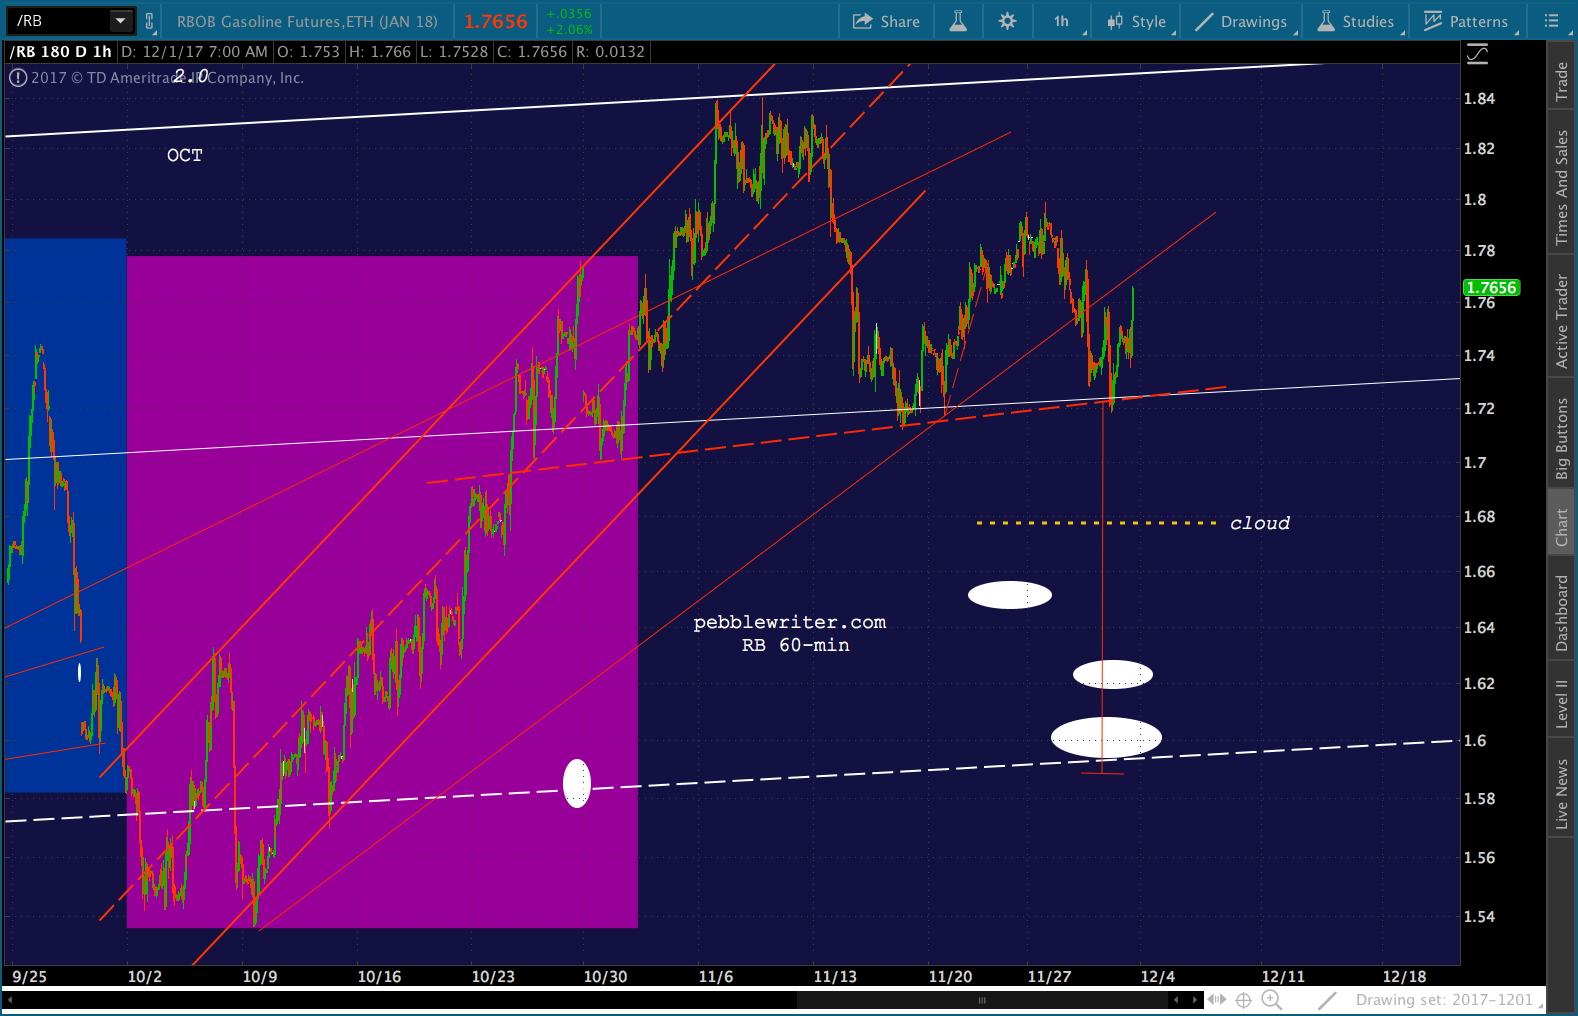 RB bounced back above the neckline yesterday, which was a pretty clear signal to cover our short position — except that it’s a head fake. CL needs to remain elevated to prop up stocks. And, given that the YoY comp isn’t so onerous, it can do so without generating significant inflation. I’d therefore stay long as long as it doesn’t make lower lows. But, RB’s situation is quite different.
As long as RB can remain above the neckline, it’s safe to be long. But, when (not if) it drops through the neckline, currently 1.7243ish, then it’s a pretty clear signal to be short – with the same downside targets listed yesterday. The first is the cloud top at 1.68.
Note that if RB can hold out a few days, the cloud top rises to meet it. If it drops through the cloud top, then the cloud bottom lines up nicely with the red TL and SMA200 at 1.6261 or with the white midline just below at 1.59-1.60.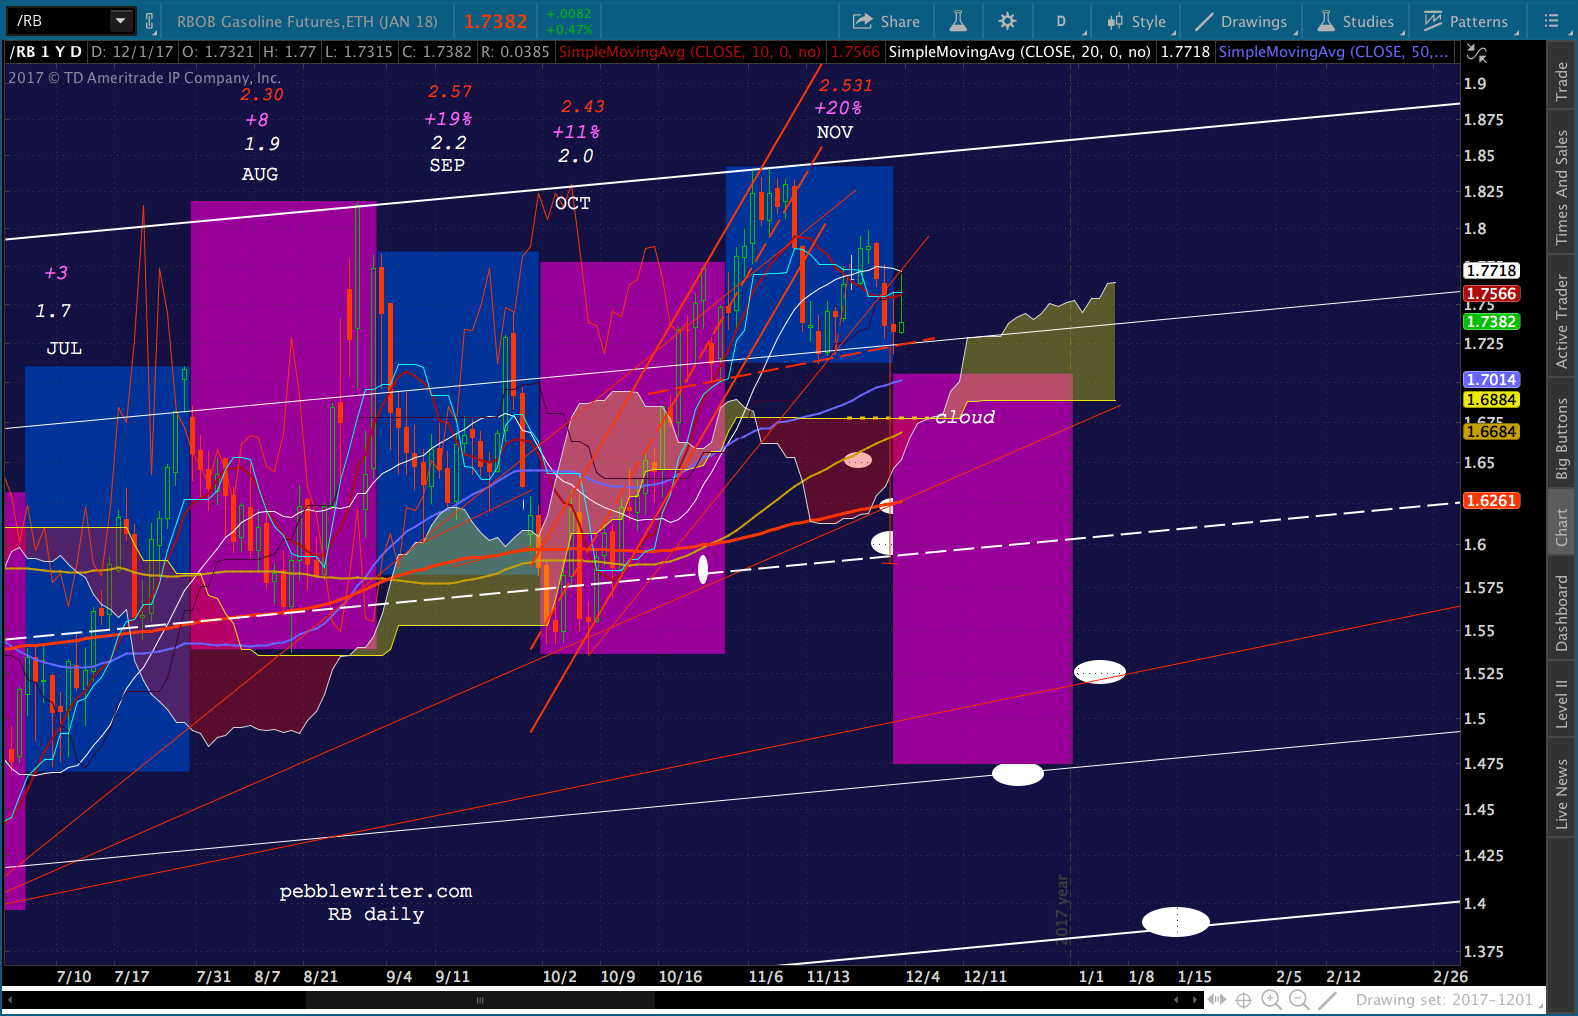 As we’ve discussed before, CL is in the clear now that we’ve reached December. Nov 2016 plunged dramatically, but Dec 2016 started (Dec 1) at 48.89 and never looked back, reaching as high as 54.51 on the 12th. With CL currently at 58.35, there will be little impact from oil price increases unless CL breaks out of the rising white channel.
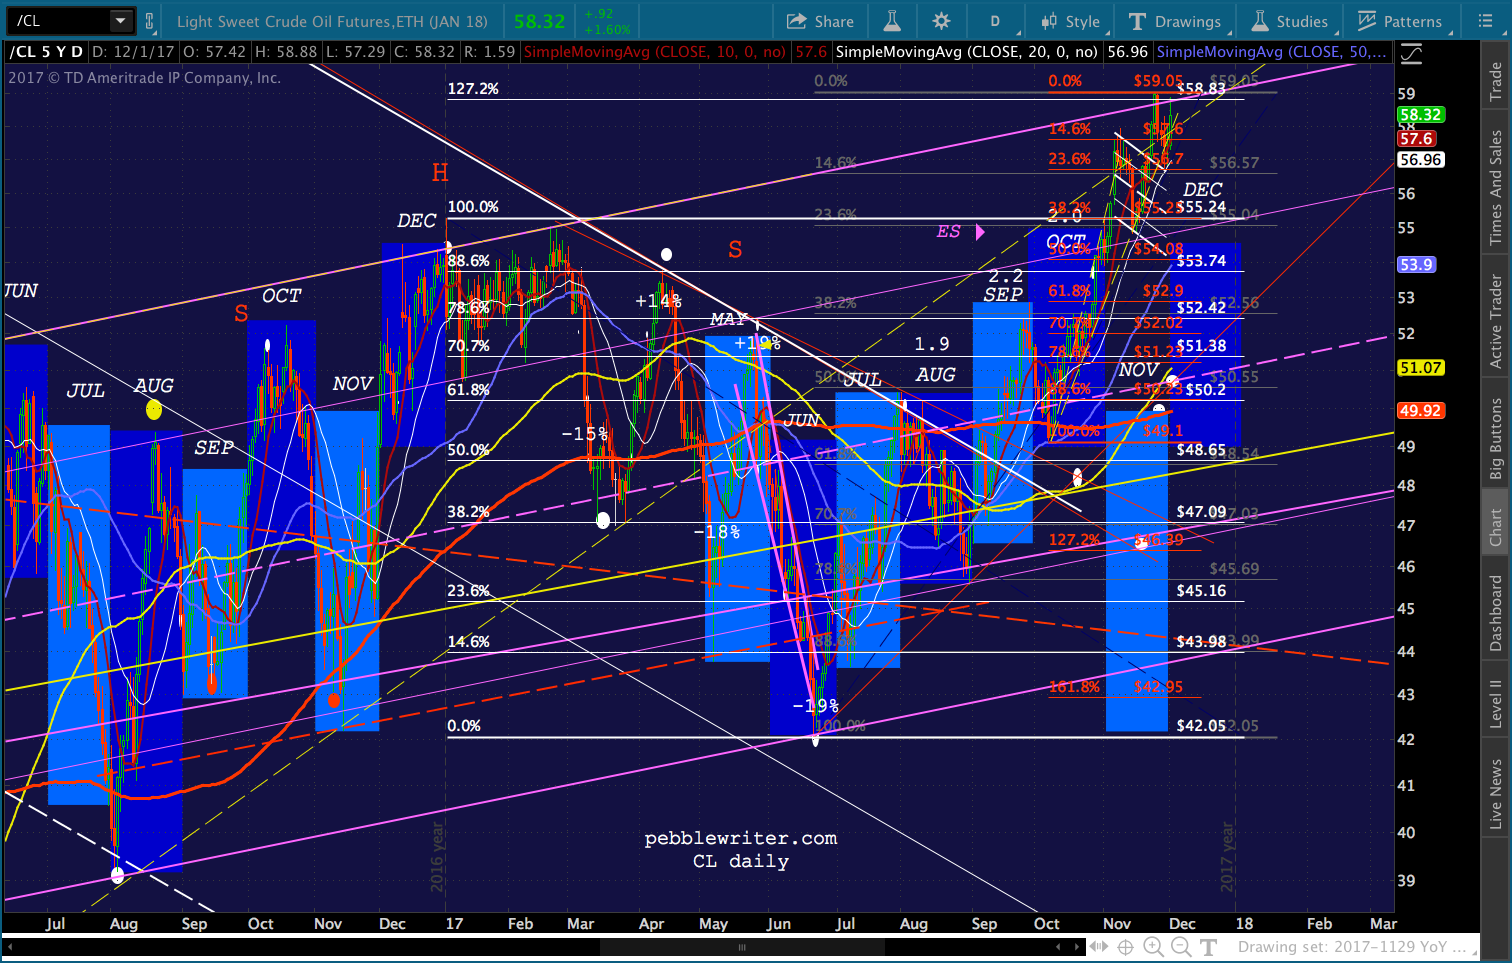 I’ve highlighted in 2017, above, the price range for Dec 2016. It shows quite clearly that, while Nov’s YoY price increase was significant, December’s will be quite mild. Should they wish to, the Fed can legitimately argue that November’s inflation was transitory.
Absent any dramatic fundamental influences (an important caveat – e.g. Russia, rig counts, war…), CL should hold its ground through the end of the year — not breaking down, but maybe not breaking out either. Last December was very much the same, with the SMA10 providing much of the guidance necessary.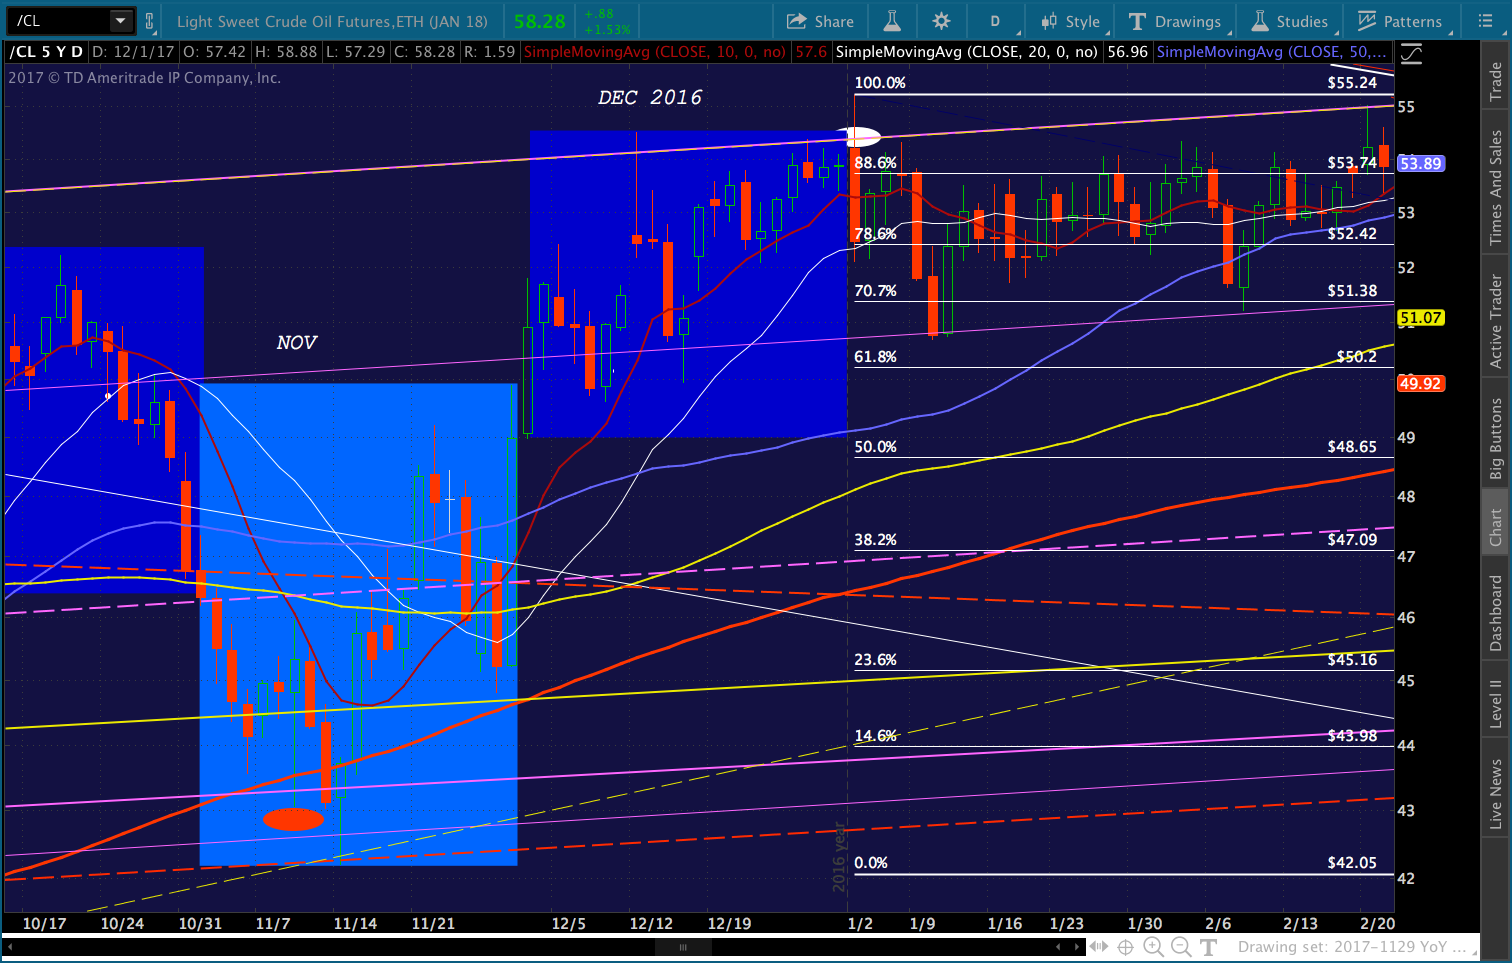 Bottom line, look for a bunch of chop – with nice gains like today when the market needs the help, and sideways or resetting when the help isn’t as critical.
Here’s a closeup of the way it’s hugged a TL from early October. I’d stay long for as long as it can remain above that TL.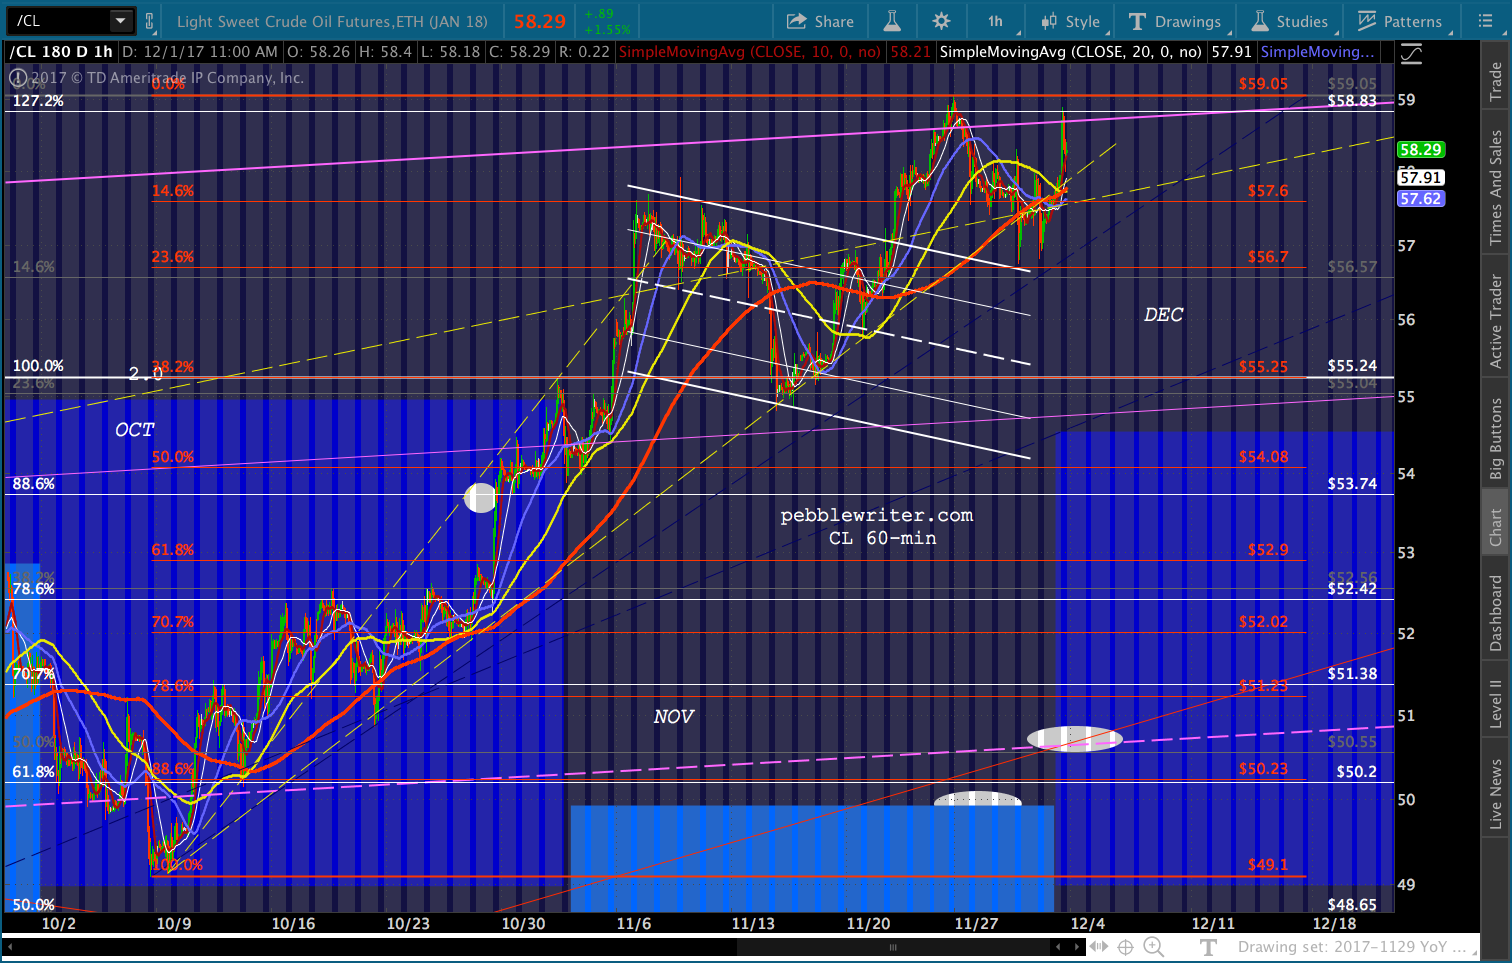 What could go wrong? If Congress or the Fed fumbles between now and Dec 31, CL might be pressed into service more aggressively to prop up stocks. If so, we’d look for the 1.272 at 58.83 to be broken in establishing new highs. Otherwise, I suspect sideways and/or a slight gain are about all we can suspect.
Other targets I updated on the Current Forecast page today:
VIX reached our middle target of 14.29 today before being slammed back down to 11.25. Although it still has potential to 16.12, this is a nice 47% profit from our long position at 9.69 on Nov 21.
USDJPY broke out of the falling white channel yesterday, tagged our 112.75 target and reversed to test the SMA100 and SMA200 again. While I’m comfortable staying short the DXY below the SMA10, USDJPY is a special case. Even if the tax deal falls apart and/or Trump is impeached, etc., you can count on the BoJ to play games with this pair. As such, I think I’d short only if it drops back through the SMA100/200 currently around 111.56.
Someone wrote me to point out that our RUT forecast turned out pretty nicely. I suggested a short at 1514 with targets of 1480 and 1454. It reached 1480 on Nov 7 and 1454.17 on Nov 15. I’d feel comfortable being long north of 1454 (with reasonable stops) into year end.