

The 10Y yield has clearly broken trend as expected, with a couple of Fib tests the only things standing between it and our downside targets. Our 28.56 upside target from Jan 10 [see: China – It’s Not Me, It’s You] has officially yielded.  This is what stocks were waiting for — a sign that interest rates’ climb past 3% wasn’t as certain as most analysts suggested. ES broke out of its slump and pressed on to new highs, finally joining SPX in regaining its 2.24 Fib extension.
This leaves our analog on track with our next targets easily in reach. It also confirms the time adjustment that was suggested by the most recent dip and the redrawing of VIX’s (and everything else’s) path for the next six weeks.
continued for members…
Recall that unlike in 2007, our recent bottom and VIX spike left several options. We originally labelled the analog days according to VIX’s spike to 50.3 – the night of Feb 6. ES had tagged its SMA200 the night of Feb 5, but SPX didn’t reach its until Feb 9. Since then, we’ve seen SPX lag our originally scheduled turning points by three days — telling me that the analog should probably be shifted 2-3 days into the future.
Our initial high (Day 6) for SPX was supposed to be Feb 14, based on VIX reaching a low on that date. It occurred, instead, on Feb 16. This was to be followed by a low on Day 8, Feb 16. The low occurred instead on the 22nd, 3 days late (excluding the holiday.)
The next high was to occur on Day 12, which was last Friday the 23rd. Moving it forward 2-3 days means tomorrow or Wednesday.
 Making a similar adjustment through Day 39 would look something like this.
 I like this timetable much more than the previous one — mainly because it aligns Day 22 with the Feb CPI release (within one day.) This fits very well with my expectation that CPI will be much lower than expected, interest rates will collapse, and VIX will collapse as it did on Sep 18, 2007.
 Speaking of VIX, this adjustment helps its chart look a lot better, too. Recall that we discussed adjusting the original large moves to a series of minor new lows.
 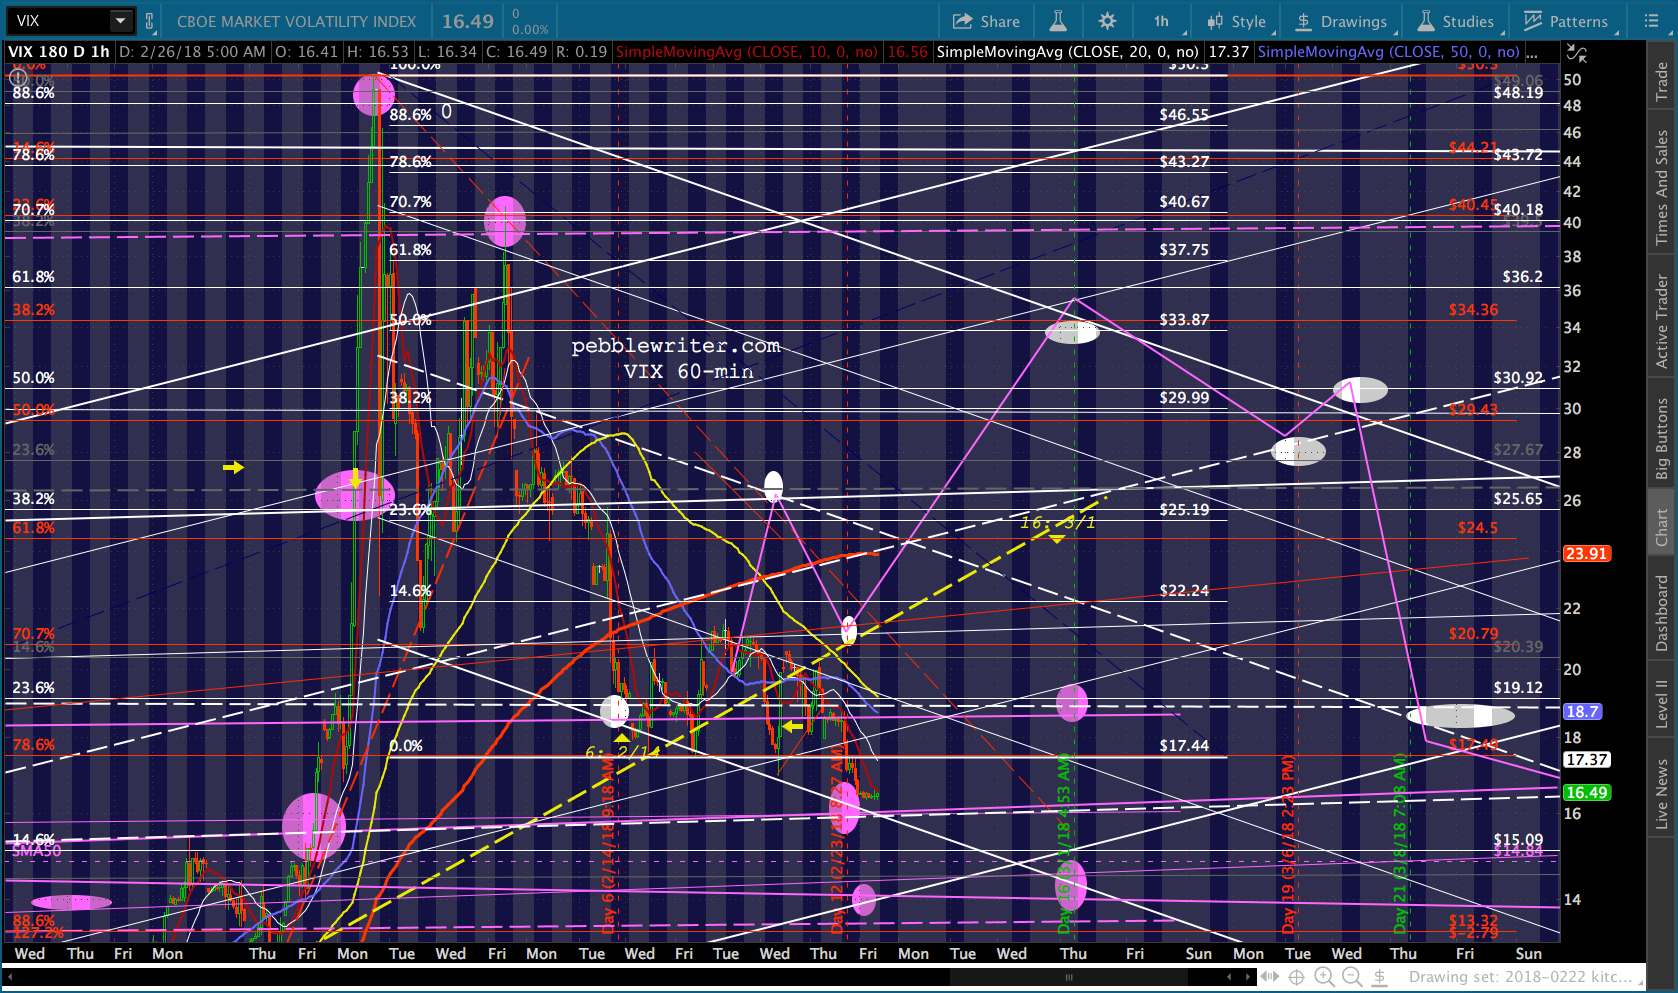 Changing the timing makes a lot more sense, as it allows a backtest of the falling purple channel, a bounce up to backtest the broken (then) white channel, and a drop through to the rising white channel bottom on Day 22. Day 39 would take it even further, down to channel support at 7.90 – 8.60.
If the purple channel bottom holds here at 16.49, look for VIX to backtest the yellow TL where it intersects the purple midline (23ish) or the white midline (26ish.)
 This is obviously different from the 2007 pattern, but we already noted that a few days ago when it became obvious that even a slight bump up in VIX was enough to send SPX down to support.
I’m going to spend the rest of the day working on currency and commodity charts, adjusting them as necessary. I’ll check back in if anything really strange happens.