

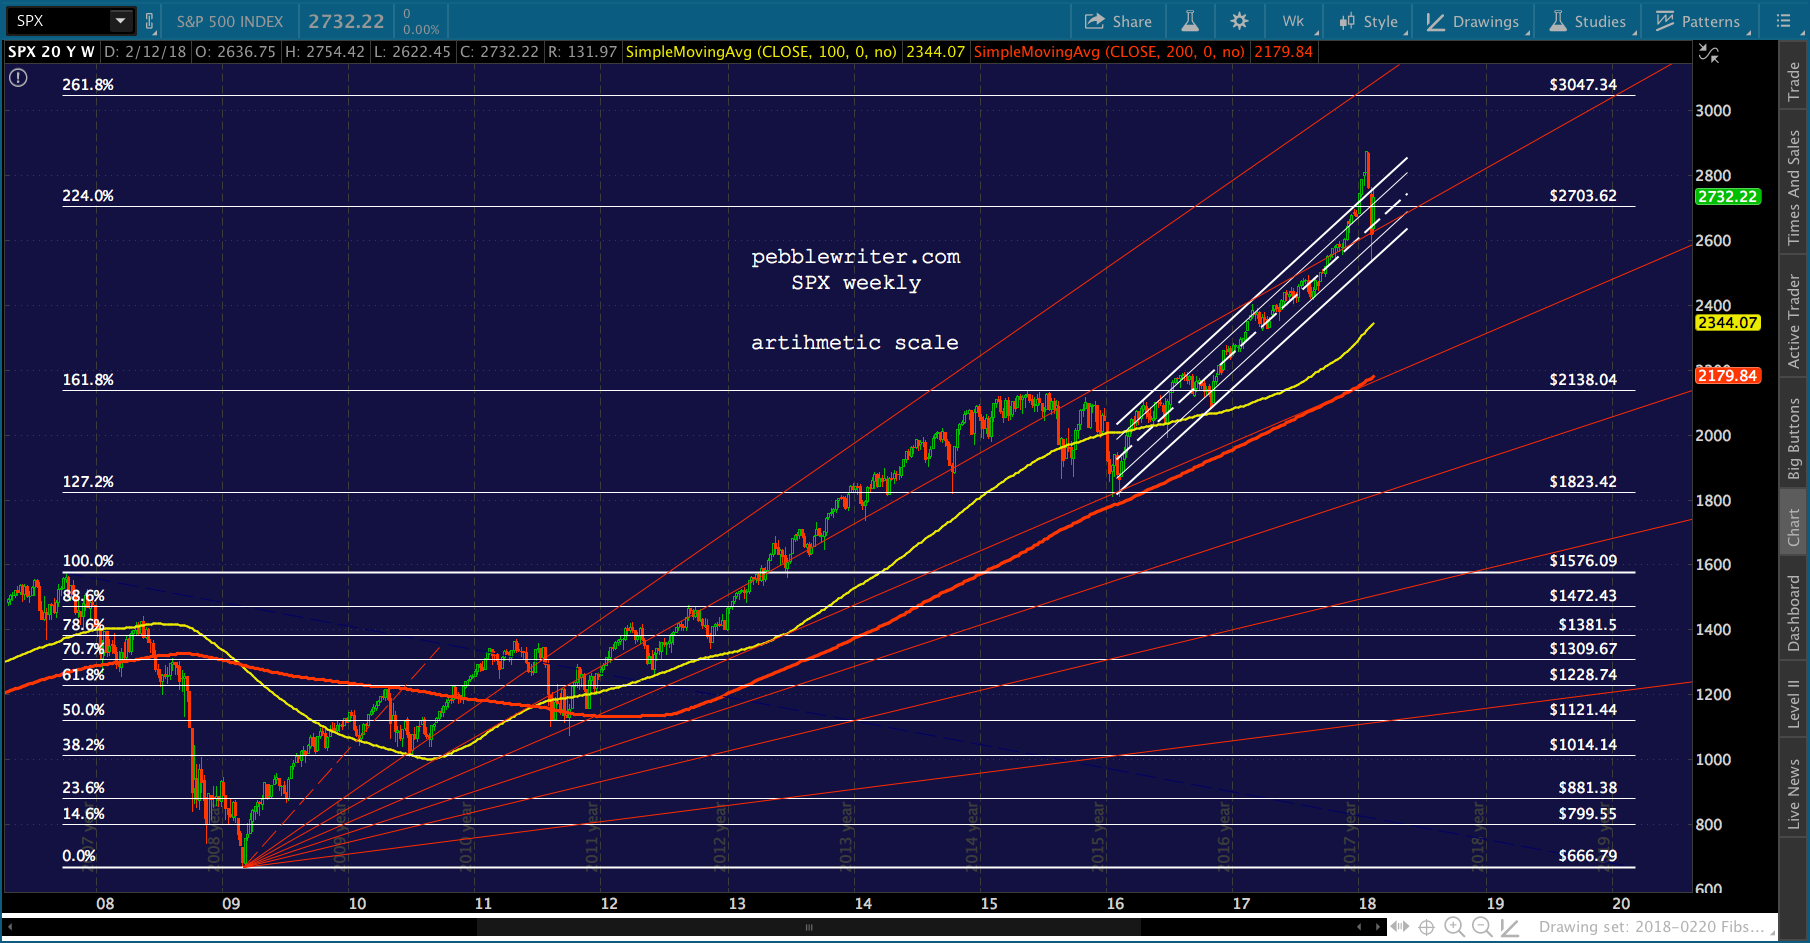
The chart below usually stops charting skeptics cold in their tracks. We can argue all day about whether Fibonacci levels should matter. But, it’s pretty obvious they have.
The reversal in 2010 at the .618 Fib resulted in a drop tot he .382. The tag in 2011 at the .786 Fib yielded a drop to the .500.  The most recent large reversal came in 2015 at the 2.618 at 2138, resulting in additional backtests of the 1.272 at 1823.
 We can also see the importance of moving averages — with the 100-day (yellow) and 200-day (red) figuring prominently over the years. And, of course, channels have been extremely helpful in identifying periodic tops and bottoms.
I tend to chart in logarithmic scale because, besides making more logical sense to me, it offers earlier warnings of breaks in trend. According to the chart in log scale above, SPX has bounced (off the SMA200) to the midline of the rising white channel — often a point where reversals occur.
But, if we map a channel to the past couple of years in arithmetic scale, we get a very different result: a wild overshoot that corrected and is now back to the channel top — a moment of truth for the bulls.
 Today is Day 9 of our analog, so we have a pretty good idea what to expect.
continued for members…Note that both show SPX above the 2.24 Fib — indicating they’re in the clear for now. Fib levels aren’t affected by the log/arith choice.
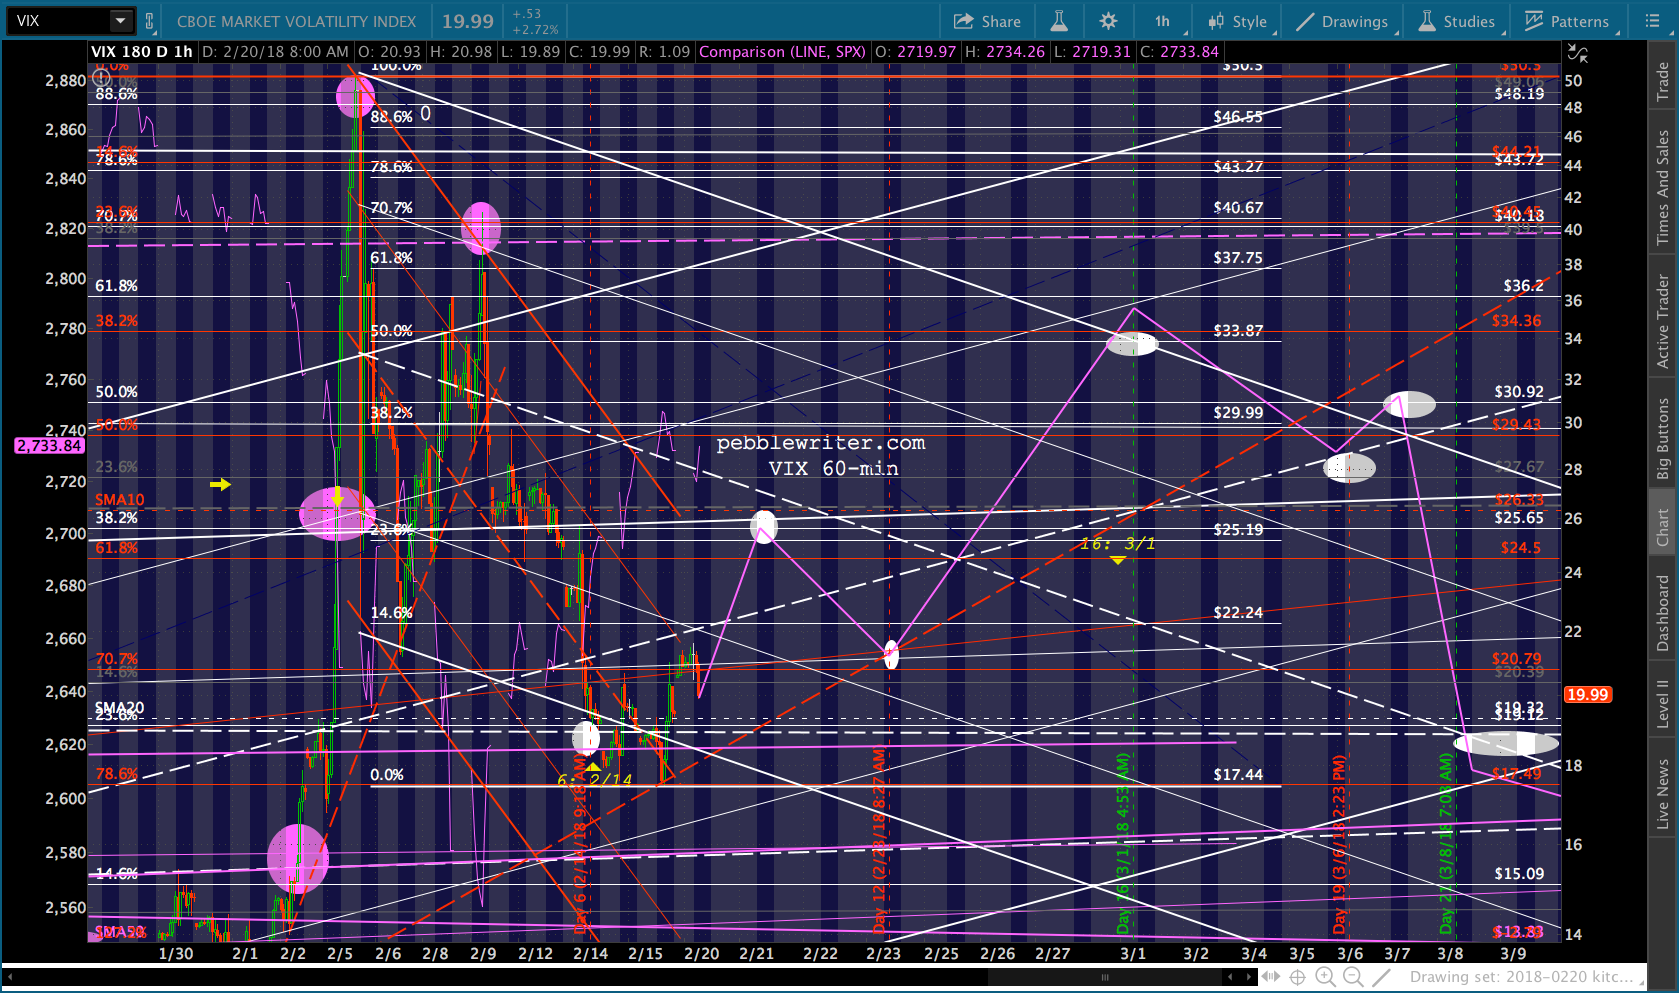
 So, while we had several downside targets from which to choose in our last analog update, I’m leaning toward SPX’s 2.24 at 2703.62 and have moved the white dot denoting it to the rising white channel midline tomorrow.
 A reminder of the 2007 top VIX action and how it affected stocks.
 Our Day 6 is clearly off a little, as SPX’s bottom didn’t happen at the same time as ES’. But, if we count forward from SPX’s bottom, we get a low on Day 8 as VIX reaches an interim high.
At that point, VIX should make another drop to a higher low that produces a large gain in SPX/ES by Day 12. It could be as high as the .886 at 2834 at the top of the rising white channel. But, the .786 would work just as well. Ideally, this would be accompanied by a large move in USDJPY — the backtest we’ve discussed.
 UPDATE: 11:39 AM
Updated SPX and VIX:
 BTW, I have to be out for the remainder of the day. And, I plan on being out most of the day tomorrow and Thursday. I should be able to post each morning and do a follow up after the close.
UPDATE: 2:10 PM
Quick look at where things are headed. ES is still on track, but SPX jumped out of the falling white channel on the back of the SMA5 200. I expect it to drop back in any second based on ES’ chart. ES suggests the tag will take place as early as at the close. Alternatively, it could be on tomorrow’s open.
 It’ll be nice to get this bump in VIX so I can fine tune the channel somewhat…
 Thanks to Tommy for the question re Day 39 down below. First of all, I should point out that the next FOMC meeting is two weeks before that. The rate decision will come on Mar 20 at 2pm EST.
On Mar 3, Day 39 itself, we will get a boatload of economic data. If things go off the rails, this is where it might happen. In 2007, the Fed was in full panic mode over the coming mortgage meltdown. It injected $80 billion in the days around SPX dropping through its SMA200. The ECB injected over 200 billion euros. On top of that, there were two FOMC rate decreases.
 Day 39 was the Oct 11, 2007 top. But, it took quite a bit of doing to get it there. Today, it obviously takes very little in the way of algo action to get SPX up past resistance.
Our analog says it’ll be the result of a big drop in VIX — as occurred in 2007. But, we don’t really know what will be happening in the currency markets, as things are already different from 2007.
Back then, the dollar was under pressure relative to the euro and the yen from a growing awareness of the mortgage mess. After Day 16, however, the dollar began strengthening against the yen… …even as it continued to weaken against the euro.
 The net effect on DXY was neutral through day 16, at which point the euro’s outsized influence drove the index lower — breaking horizontal support.
 The 10 yr had already dropped 100 bps from its June highs, and Day 16 was the day rates began a 5-week bounce — which turned out to be only a backtest.
 Here’s a closeup:
 Take a look at what the yield curve was doing at the time…rising sharply off of being inverted…
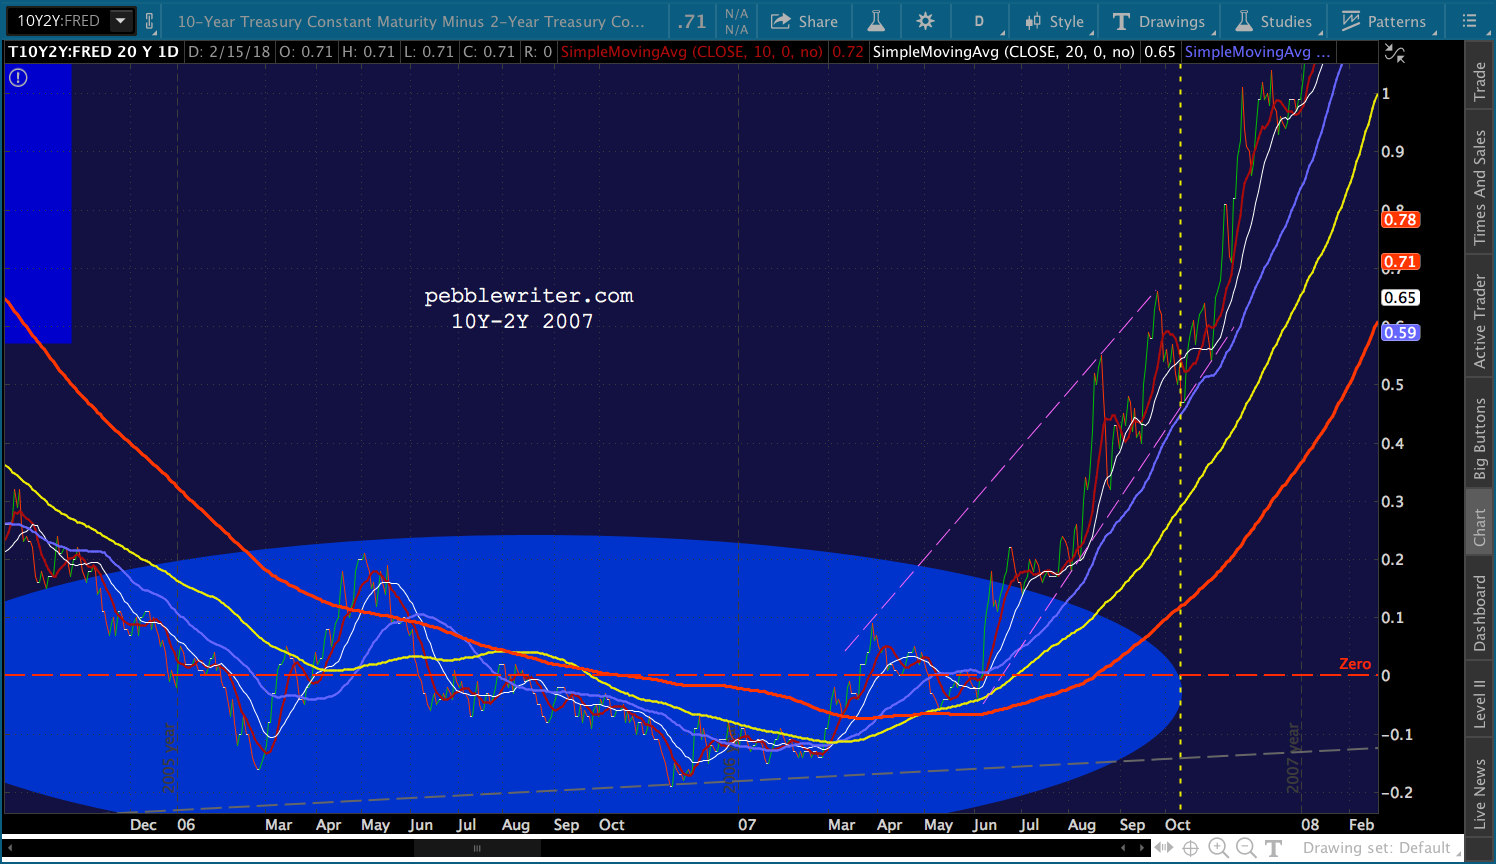 …following a significant flattening.
 As we discussed at the end of the year [see: Should You Fear the Yield Curve?] the danger isn’t from a negative curve so much as it is when the curve is steepening after a period of flat or negative. The curve has definitely steepened, but where’s the overhead resistance? Is it enough that we have many trillions more debt than back in 2007, and a move over 3% in the 10Y would be scary?
Looking at the curve vs the dollar is also interesting. I’ve mapped the analog dates on the chart below. Note that DXY broke down shortly after Day 16. The spread spiked higher at the same time. The two yellow arrows represent when SPX (after having peaked) dropped back through its SMA200 and, then, backtested it. This is also when the spread broke out above the TL connecting the previous highs since early 2007. Compared to present time, we can see the spread has already broken out, and is in the process of backtesting. If it continues to widen, the charts suggest we’ll see continued weakness for DXY.
UPDATE: EOD
So, apparently tomorrow morning…

Comments
One response to “Fibs, Fans and Logs”
PW, a large move of USDJPY from today till day 39 , would mean a boost of dollar (while yen is further weakening). This implies rate hike in USD to get a strong dollar. However, at the same time, the rate hike effect is punishing stocks.
Day 39 (when it plays out) would be an interesting scenario. I am trying to figure out how stocks would ignore the rate hike effect around Day 39 when USDJPY reaches your target.
Thanks!