Maybe some day someone will draw attention to the many ways CPI data is falsified. We’ve written about this extensively, most recently in December [see: Again with the CPI Games?] when gasoline prices, which had risen 20.3% YoY for November, were reported by the EIA as a 17.5% increase.
Of course, by the time the BLS was finished massaging the data, gas prices had increased by only 16.5% and the “energy index” increased a measly 9.4%. Combined with the ludicrous methodology in calculating shelter costs, the BLS was able to report headline CPI had increased only 2.2%.
Equity buyers were thrilled. SPX gapped higher on Dec 18th (the day CPI was released) and never looked back. Bond buyers weren’t as sanguine. The 10-yr, which had traded at 2.35 the day before, was up to 2.49 two days later.
This morning, we get more of the same. The EIA reported an 8% YoY increase in gas prices for January. (2.467 vs 2.285.) It was reported by the BLS as an 8.5% increase. There’s nothing, in particular, wrong with these figures….except that they’re a lie.
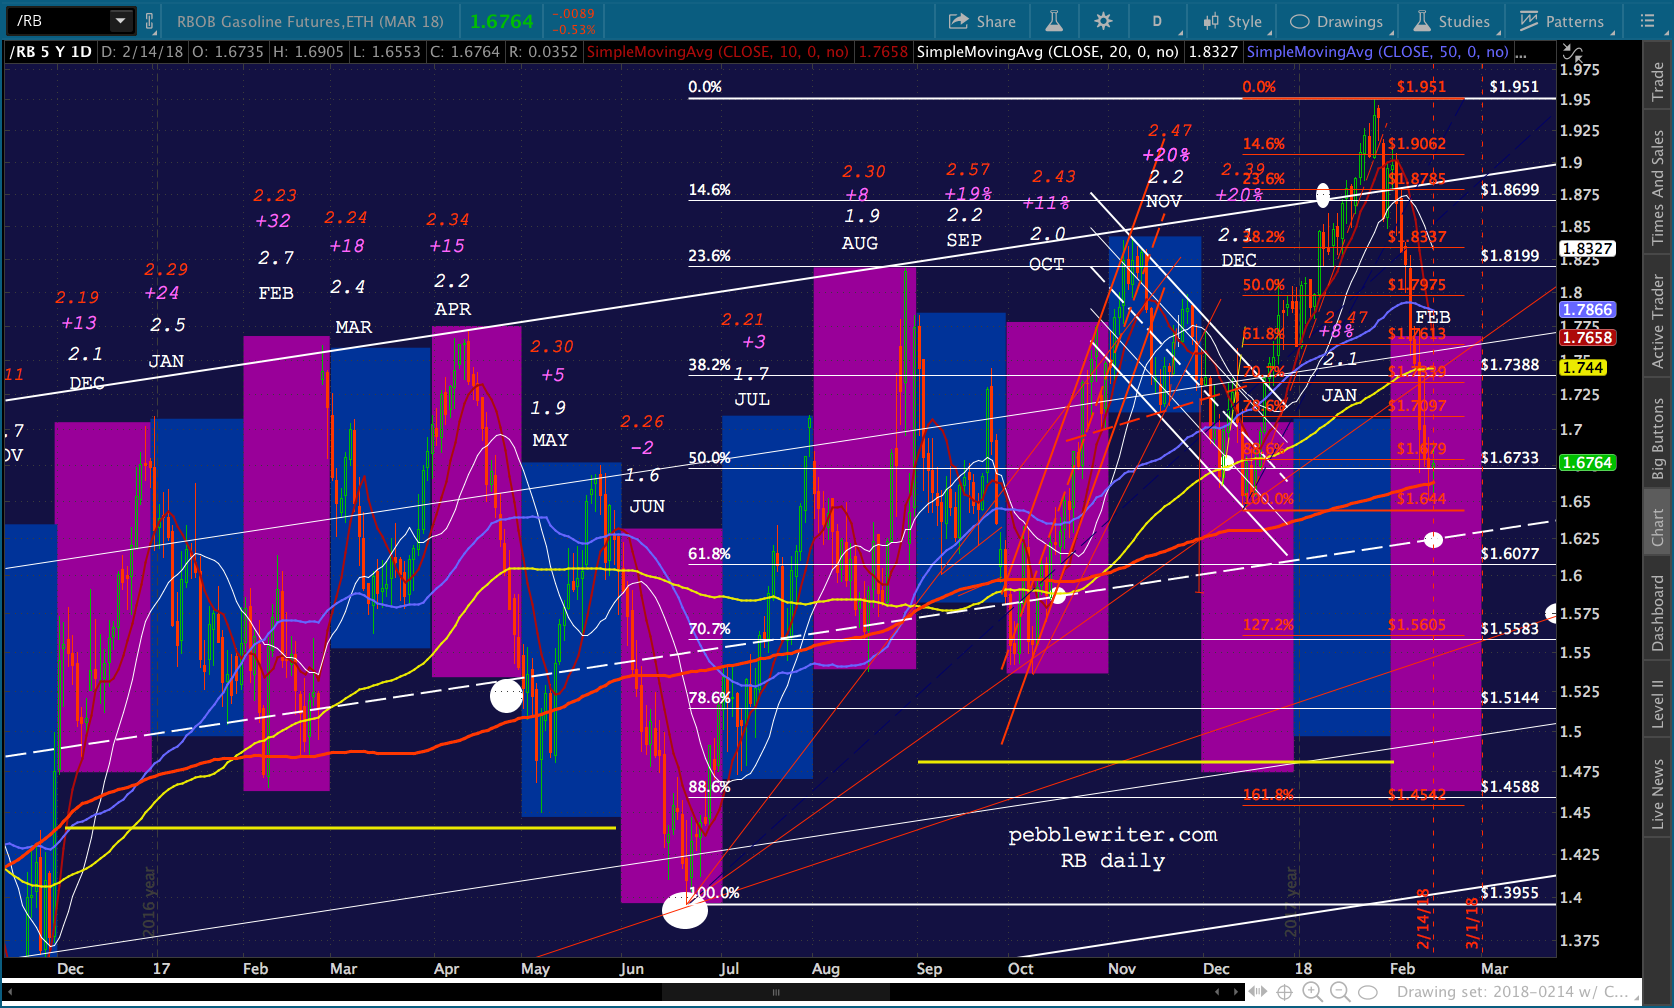
Here are the closing prices for RBOB (gasoline futures) in Jan 2018 compared with Jan 2017. The average close in Jan 2017 was 1.5772, compared to 1.8583 in Jan 2018. That’s a 17.8% increase.
 The extent of the increase is immediately obvious from the RBOB chart below. The Jan 2017 range is shown in 2018 for comparison purposes. There was zero overlap.
 EIA reported an average of 2.467 for Jan 2018. Even a casual glance at the chart below shows that gas might have touched 2.467 only around the first of the month, spending most of its time much higher.
 My own data, taken from AAA’s daily gas price report, showed that gasoline was as low as 2.467 on exactly one day: Jan 1.
Why the charade?
I’ve been listening to the financial news this morning. Pretty much every single commentator has opined that, while the 0.5% monthly CPI increase is “concerning,” the 2.1% annual increase means inflation is definitely not out of control (how bad might things have been without the manipulation?)
S&P futures, which just dropped 48 points, beg to differ. For once, even bulls are openly wondering whether the Fed has, indeed, lost control. A dismal retail sales figure (the biggest decline in 11 months) hasn’t helped.
Fortunately for them, VIX manipulation is alive and well. Pay no attention to the momentary pop in the “fear index.” It’ll be down to our targets soon enough. And, isn’t it great to see the mainstream financial media start to report on this? MarketWatch, CNBC, Bloomberg, et al have stories out this morning on the whistleblower lawsuit alleging that someone has been manipulating VIX. Gosh, really?
I and many others have only been writing about this for, oh, 5 or 6 years, so it’s nice to see ace reporters jump right in — even if it is to point out how ludicrous the allegations are. Bloomberg’s article appears to have been penned by the CBOE, which derives 25% of its profits from VIX trading and is quoted extensively throughout:
The claim sounds dubious: the VIX, that index at the center of the stock market’s wild gyrations over the past week, is somehow being manipulated. That allegation, made to federal authorities by an anonymous whistle-blower, captivated Wall Street on Tuesday, prompting both quick dismissals and more than a few raised eyebrows.
I imagine most of the eyebrow-raising is related to who is doing to manipulation rather than how they’re doing it. Ask yourself: who might have an interest in aggressively shorting VIX smack dab in the middle of a 4.5% futures flash crash? Who would have the money, the mandate and the cajones?
It’s the equivalent of writing thousands of homeowners’ insurance policies as the tornado sirens are spooling up. Yet, this is exactly what happened on election night in Nov 2016 [see: The Fallout and Why the “Trump Rally” is a Fraud.]
My conclusion all along has been that it was the Fed itself, shorting VIX then and at all the right moments since then to ensure that market volatility was limited to rallies, never declines.
Yet, an explicit admission by then-Governor and now-Fed Chairman Jerome Powell in the Oct, 2012 FOMC transcripts has gone completely unreported in the media [see: The Fed’s Short Volatility Position.] You’d think one of the intrepid “journalists” covering the current story might have found it relevant.
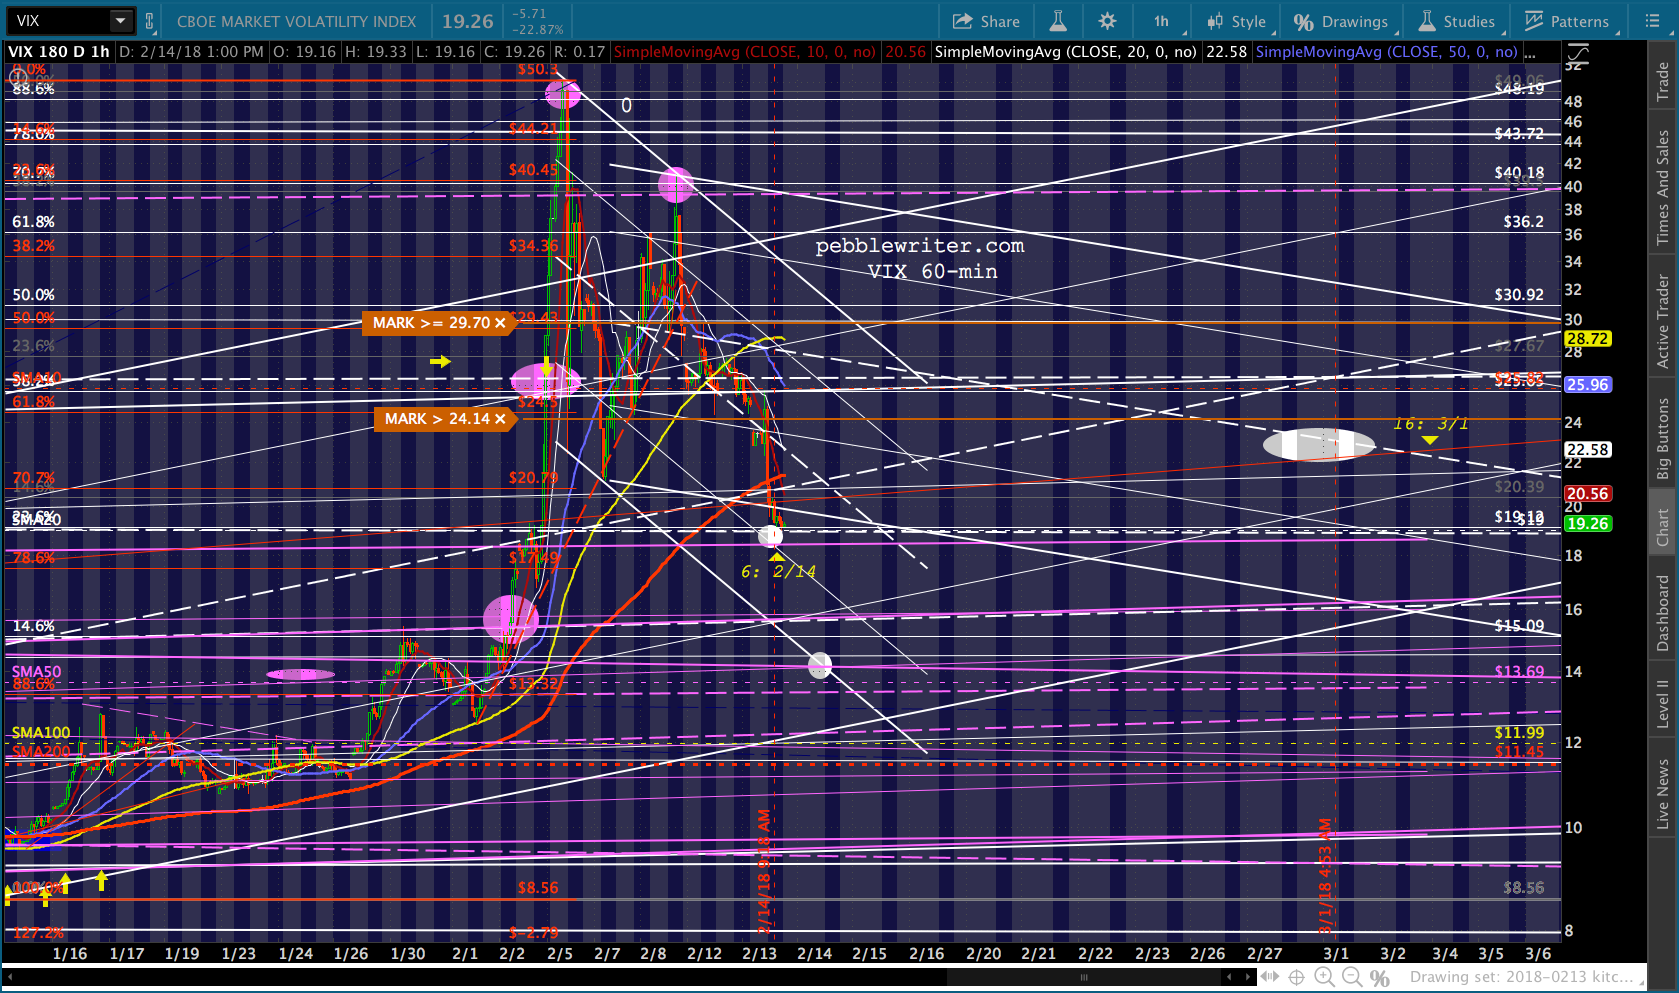
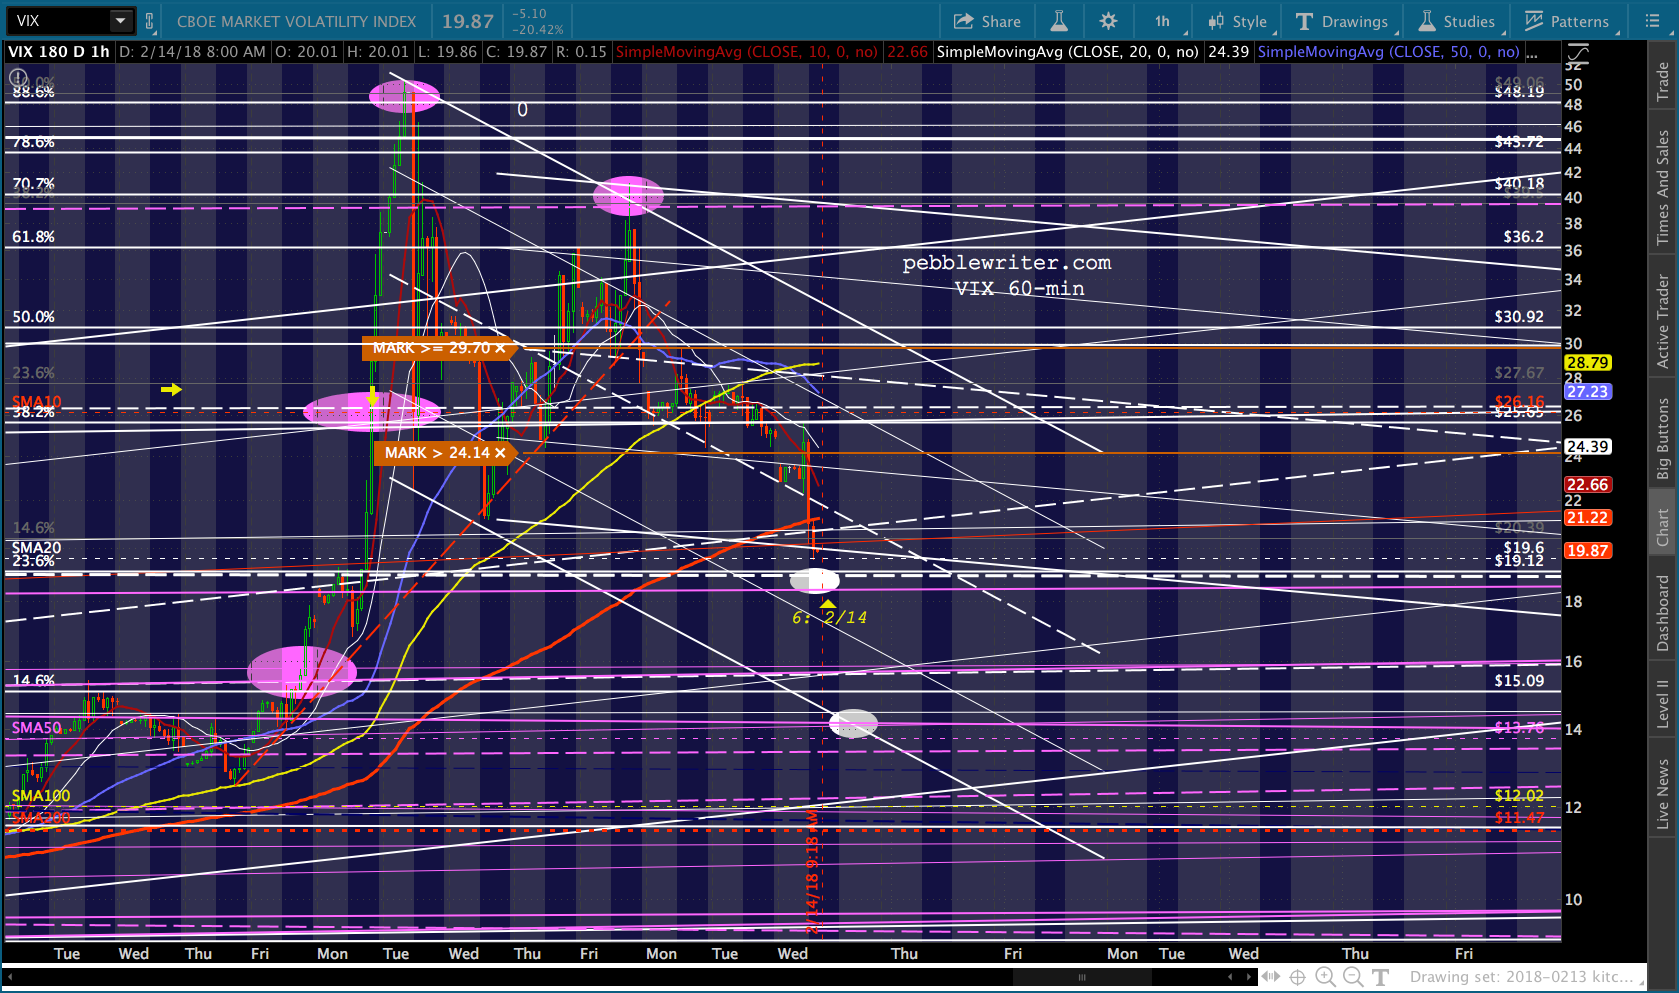
While I’ve been ranting “someone” has been hard at work…shorting VIX. It has fallen from its initial 25.72 highs to 20.21 (-21%) and has further to go.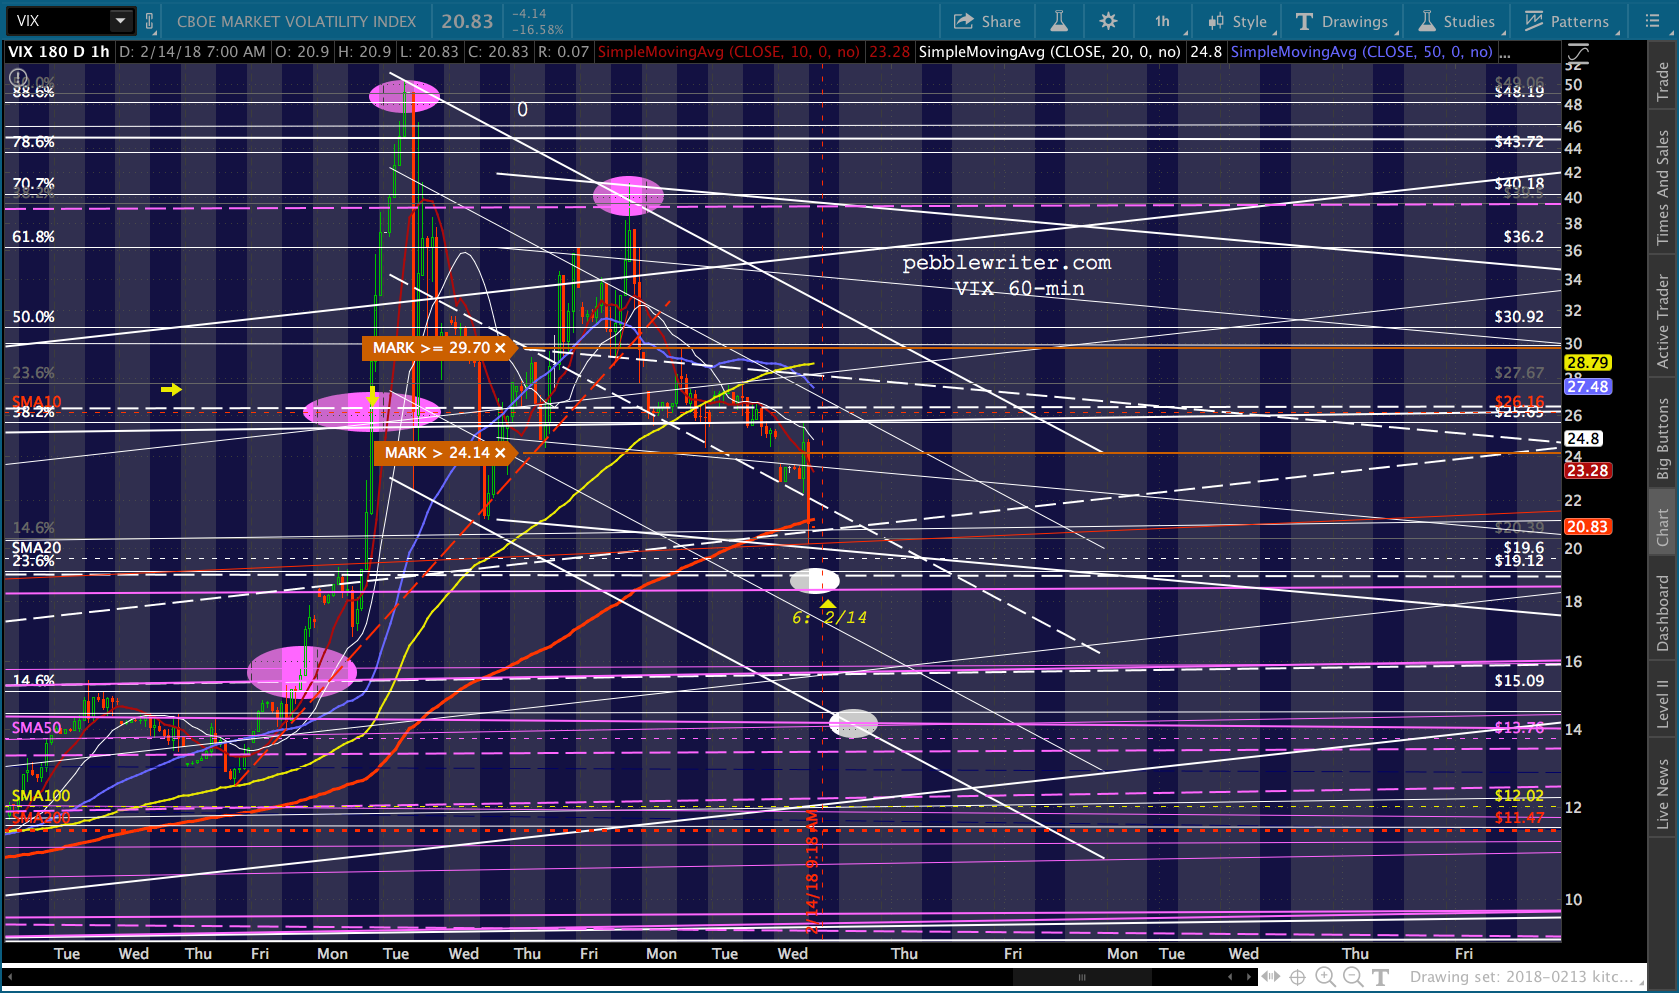 ES has recovered 34 of its 48-pt loss and is off a manageable 10 points. If VIX continues dropping as I expect it to, the algos will soon turn the indices sharply positive.
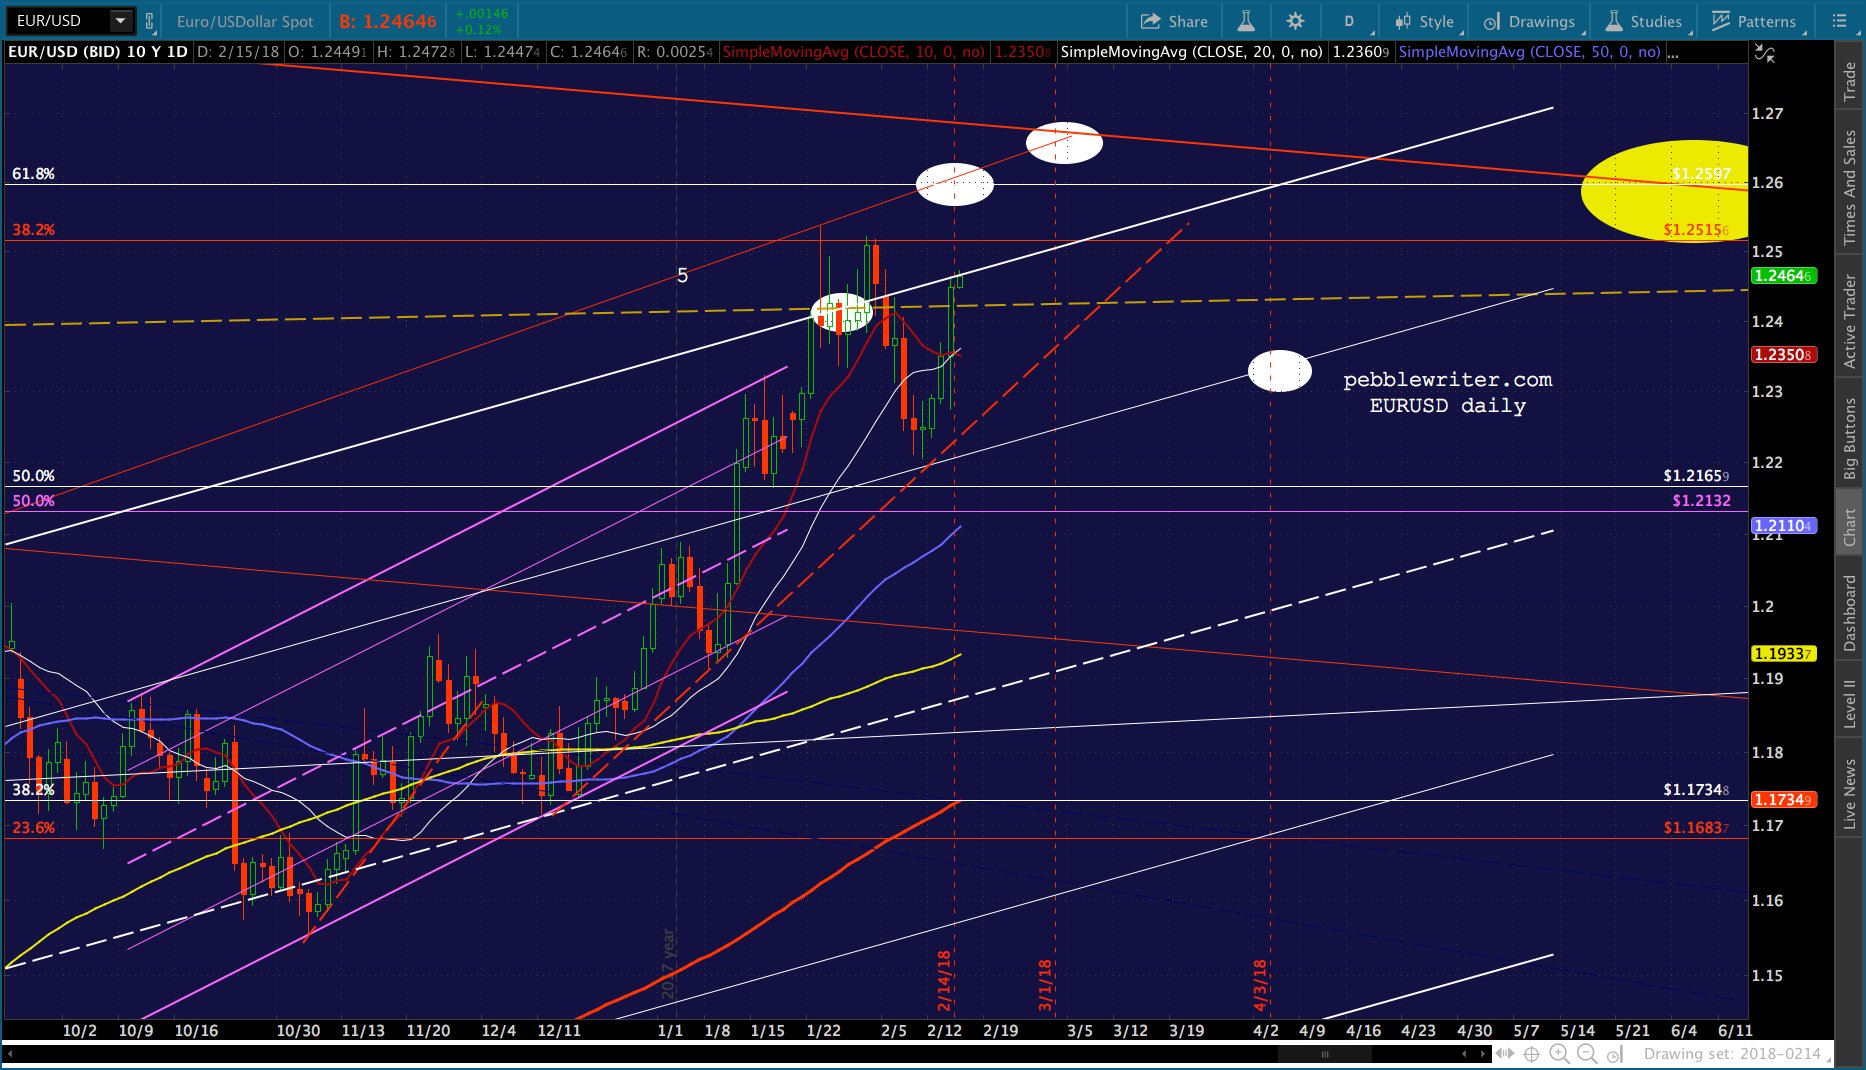
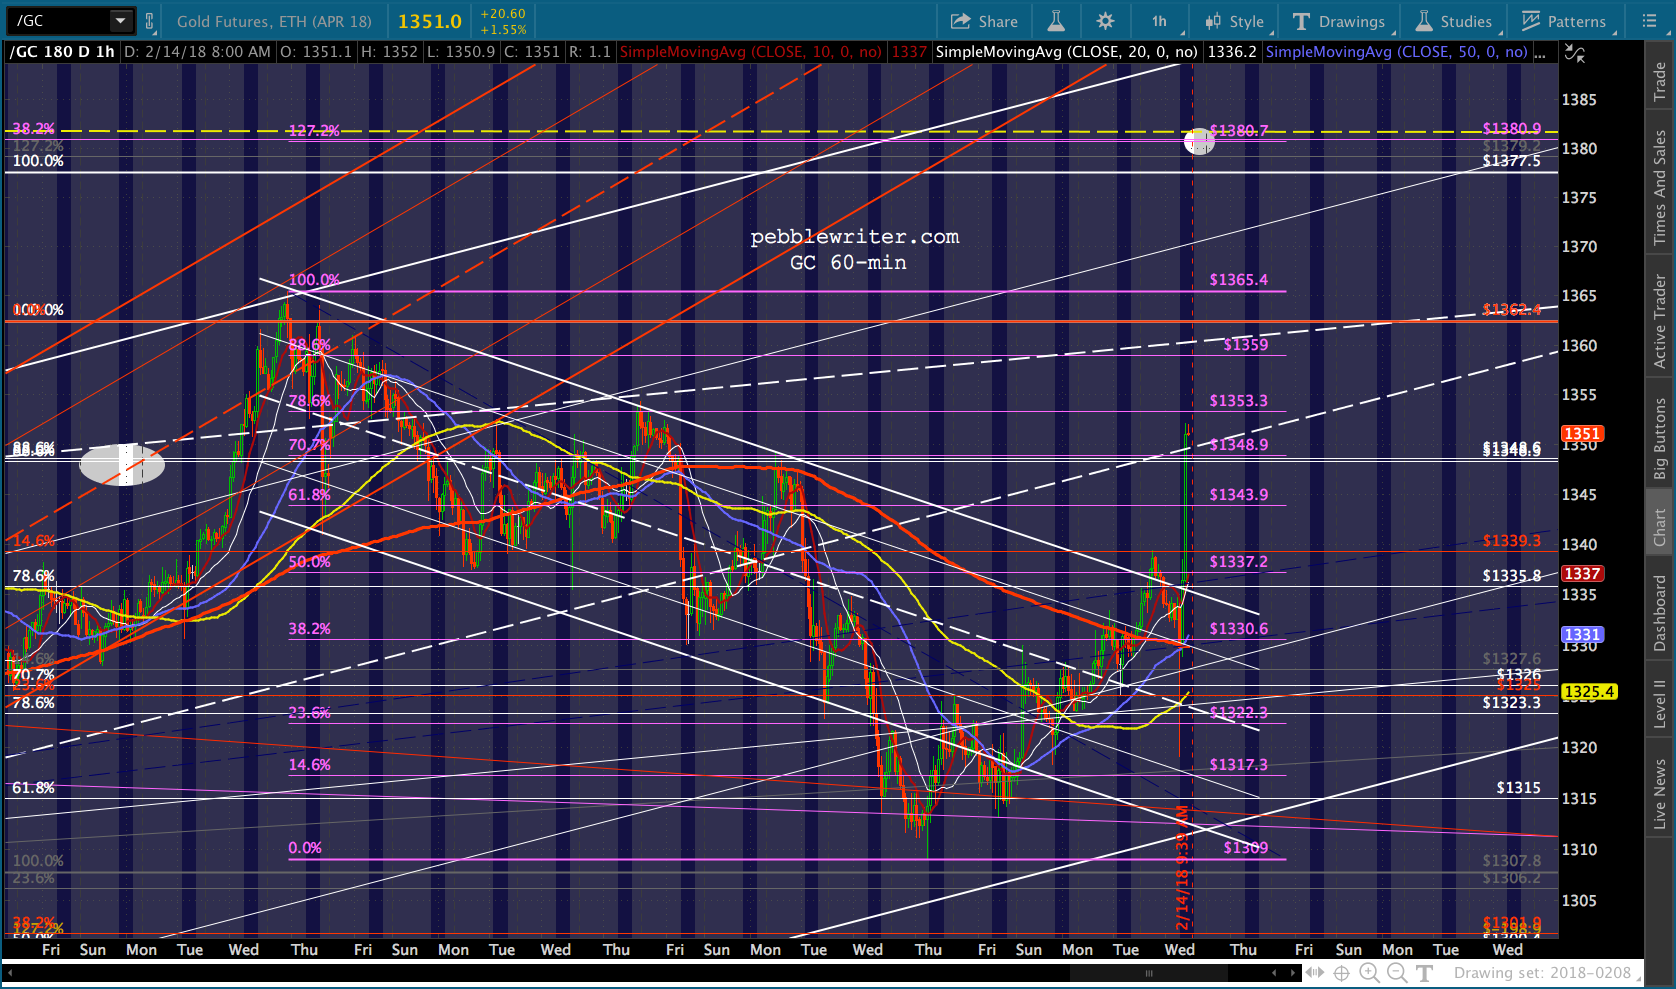
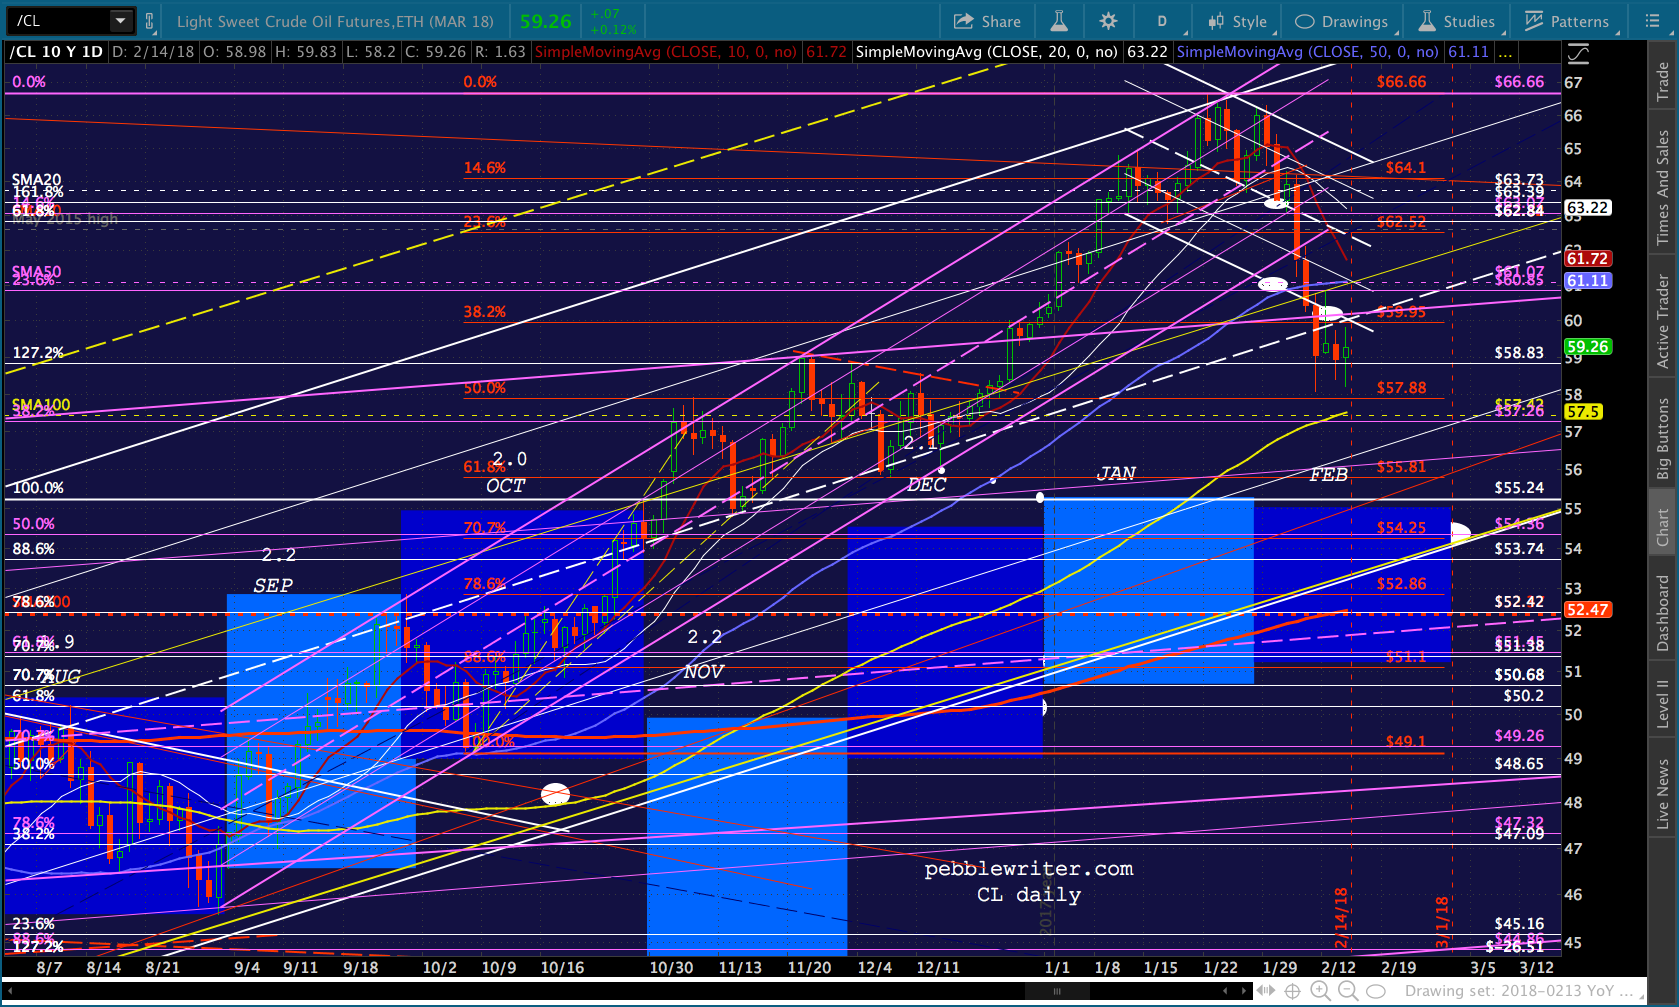
I’m certainly not complaining. This is all perfectly in keeping with our analog from Feb 6 [see: Analog Watch] which has already produced nice gains in VIX, SPX, RB, CL and gold. The currencies are just getting started.
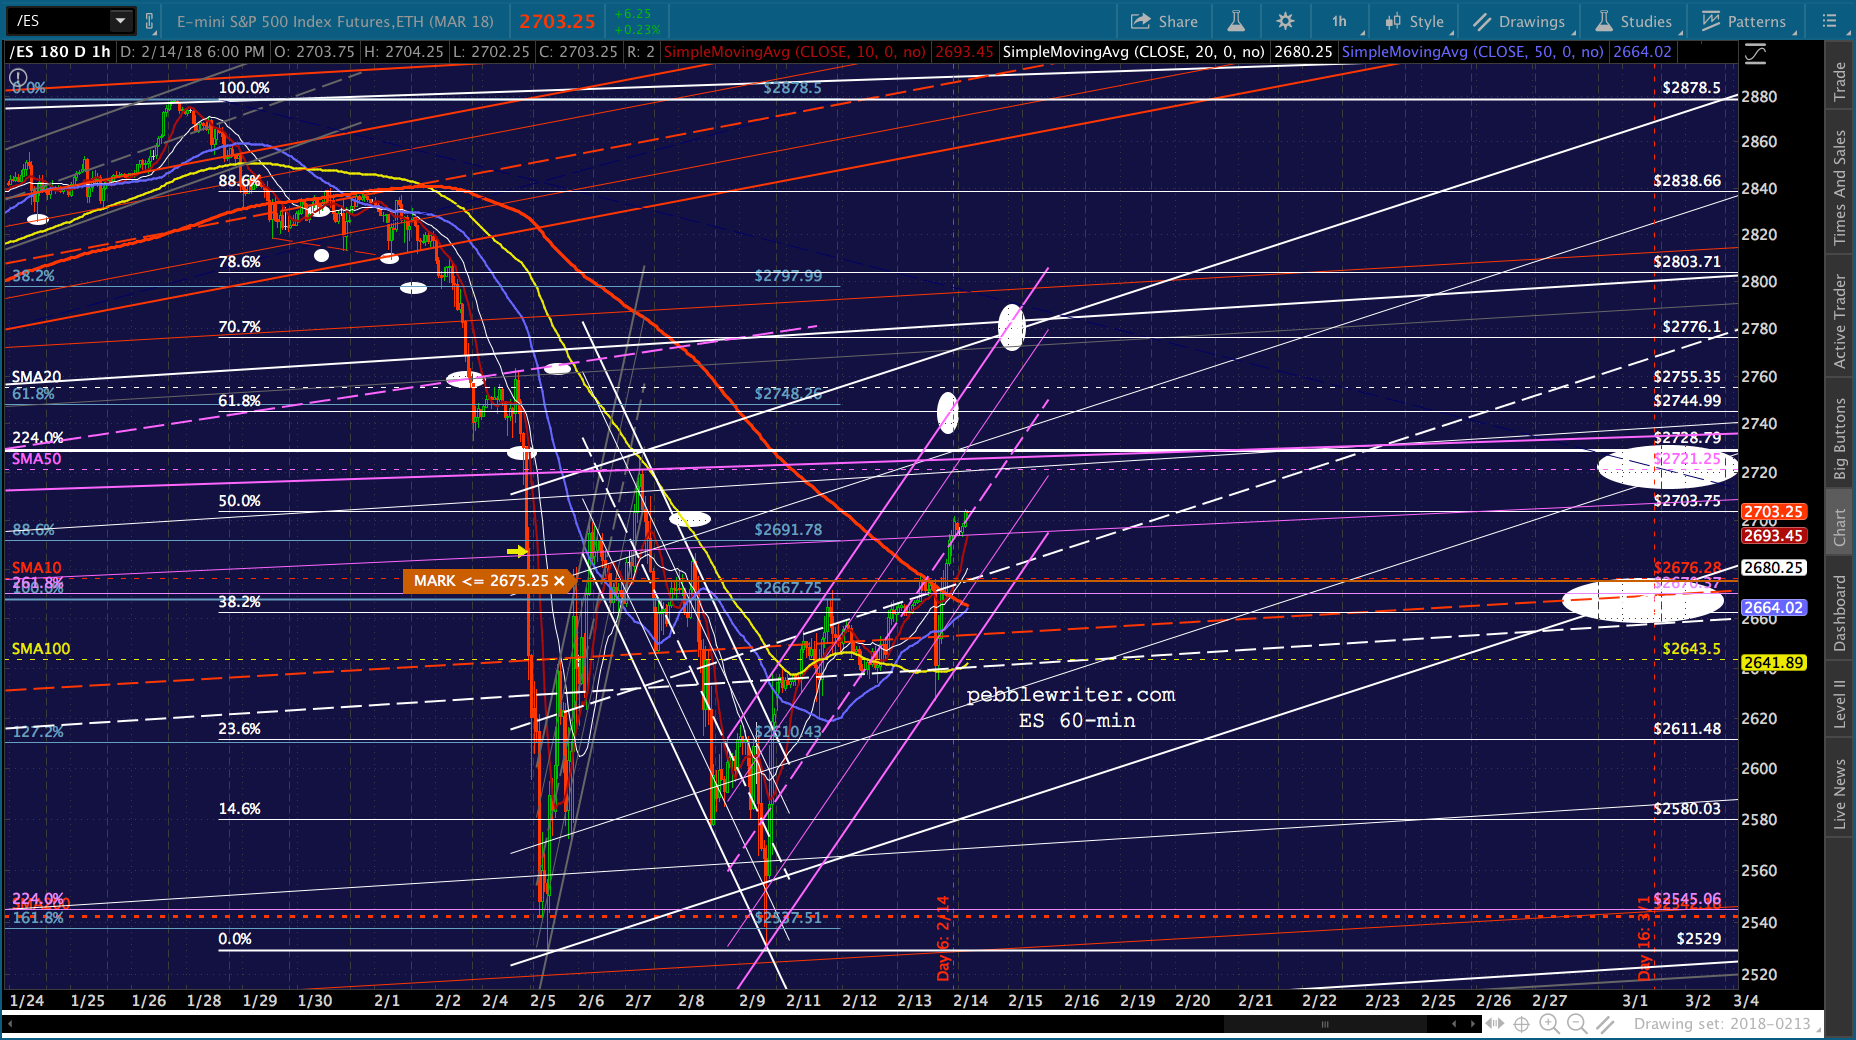
continued for members…The initial sell off in ES took it only to the bottom of the rising purple channel.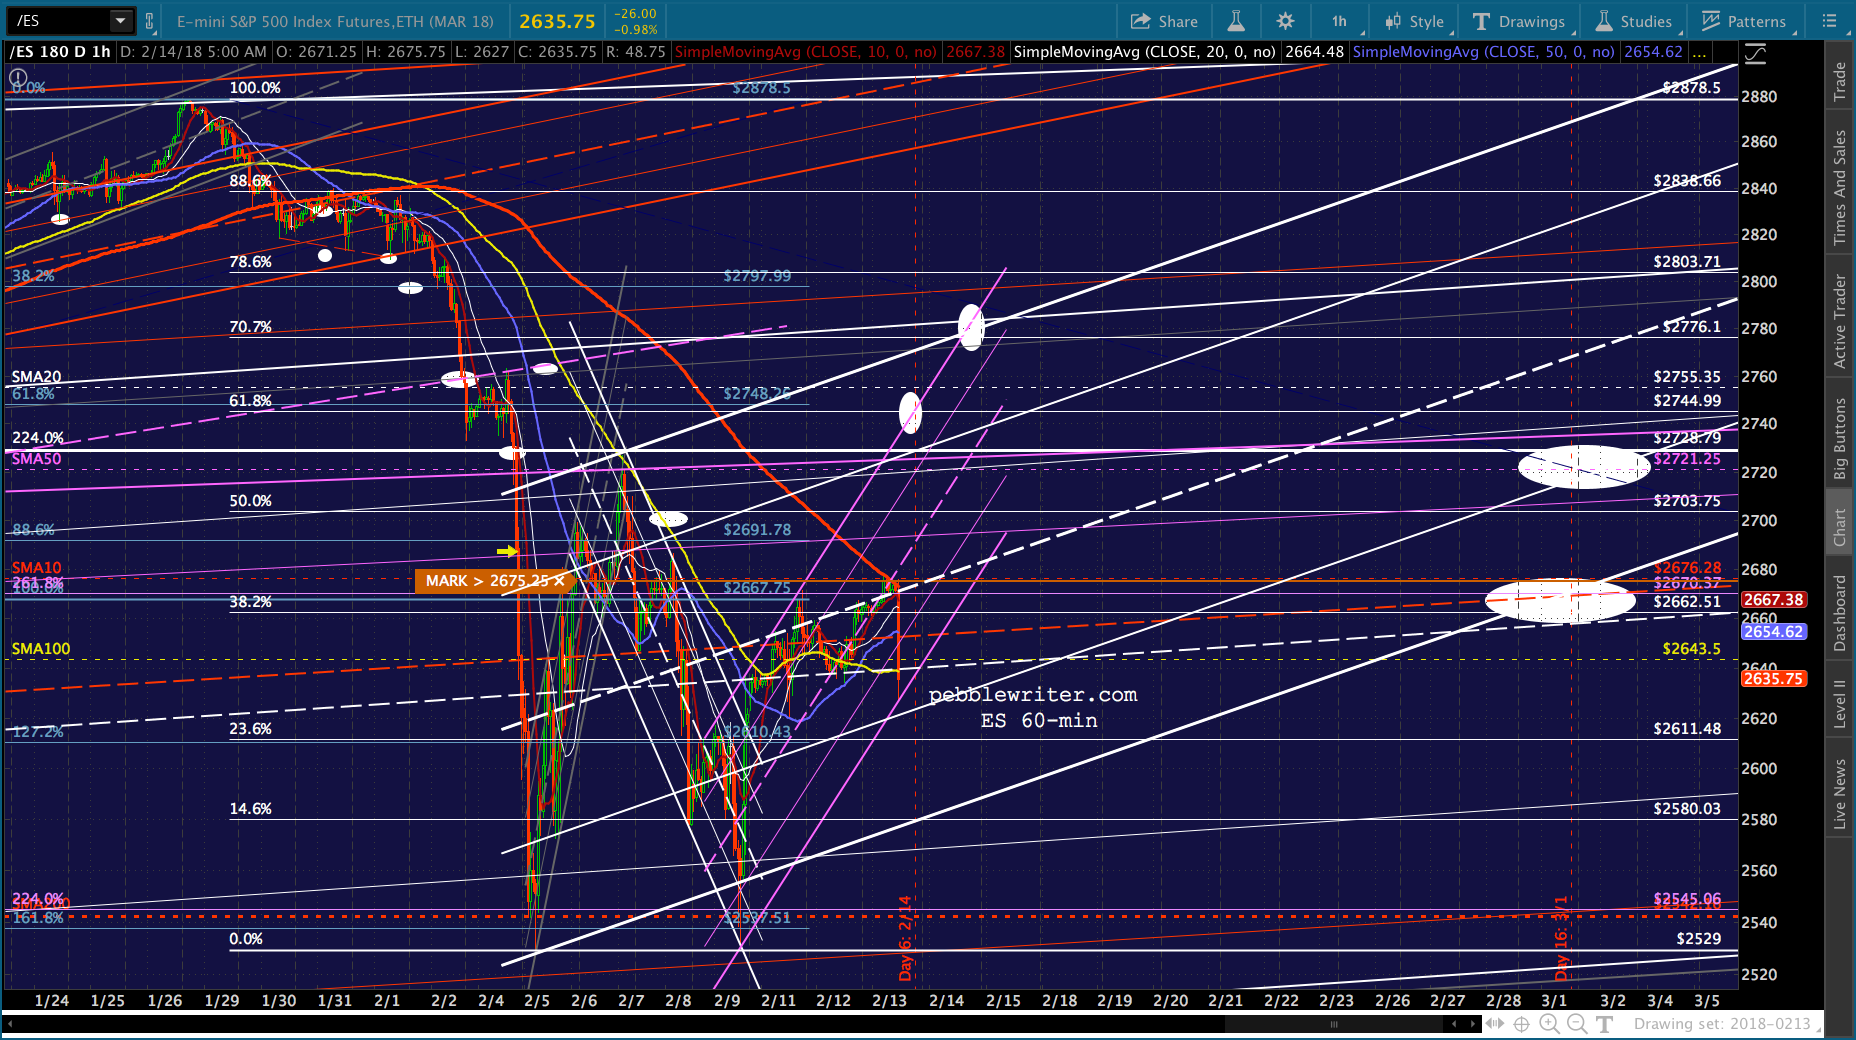 UPDATE: 11:00 AM
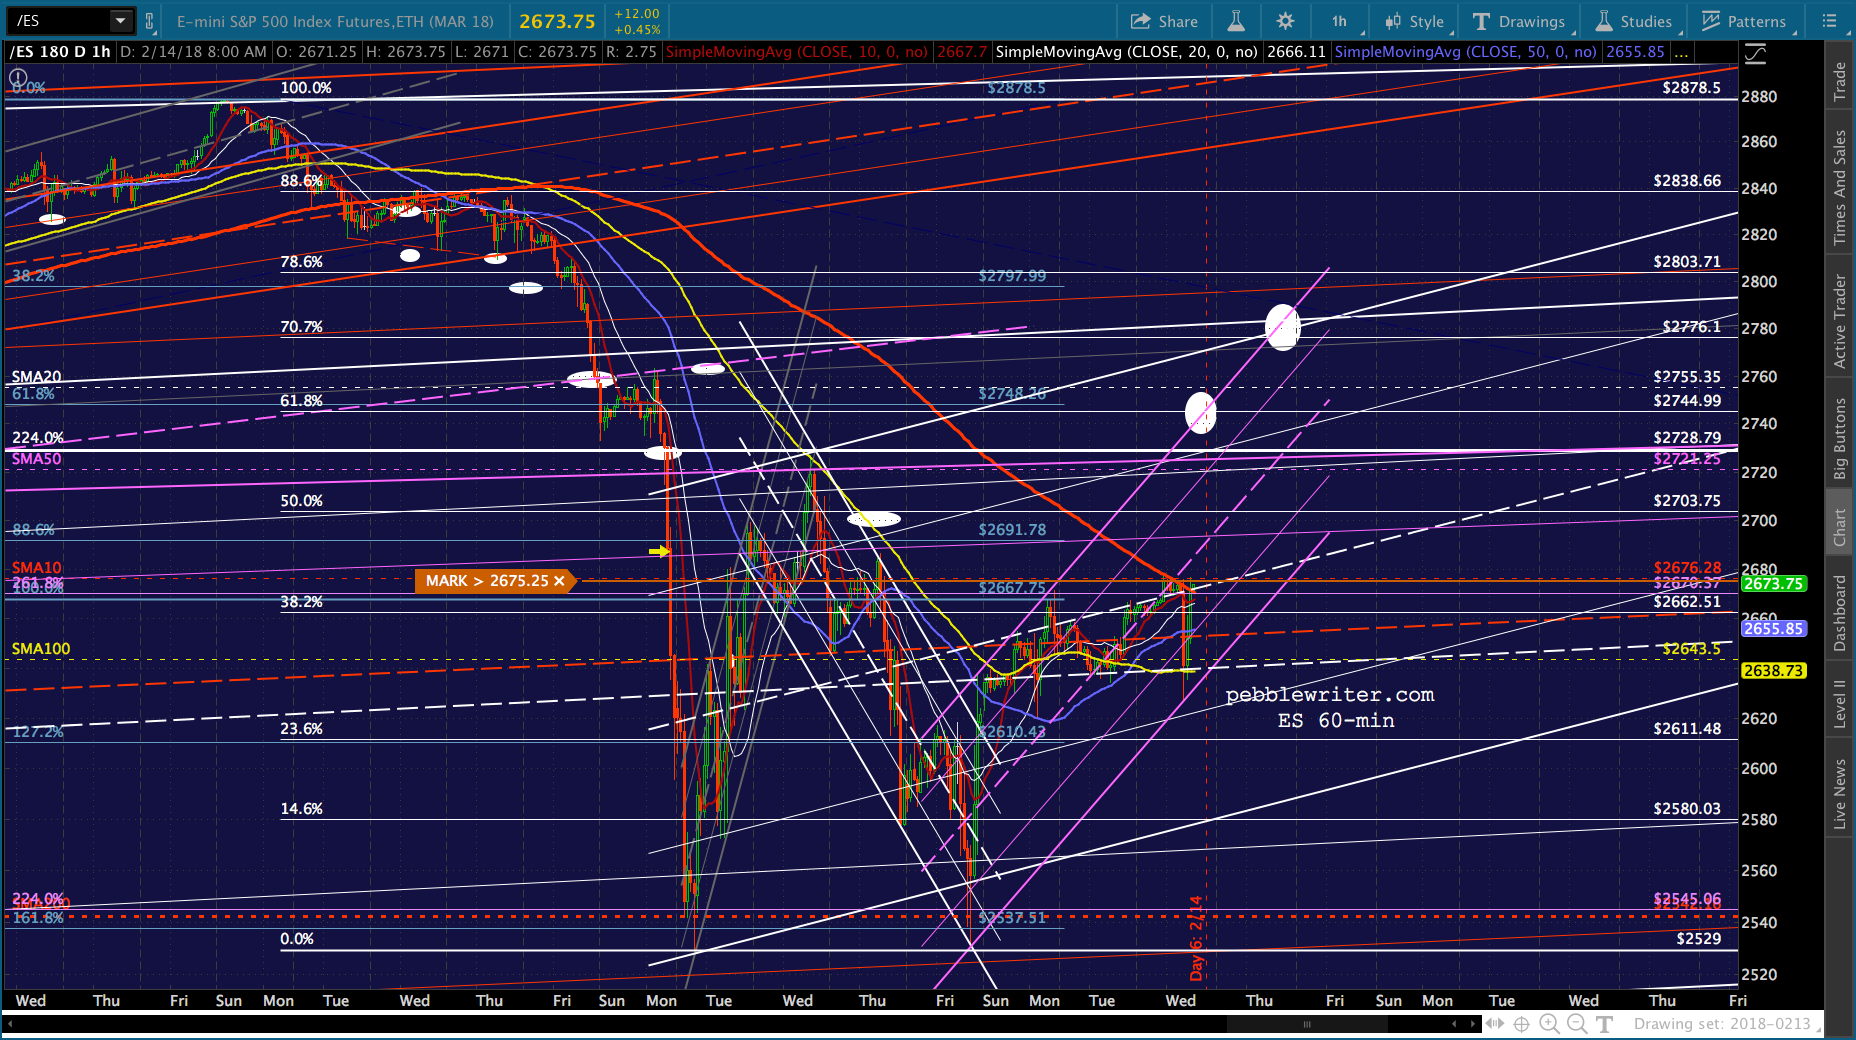

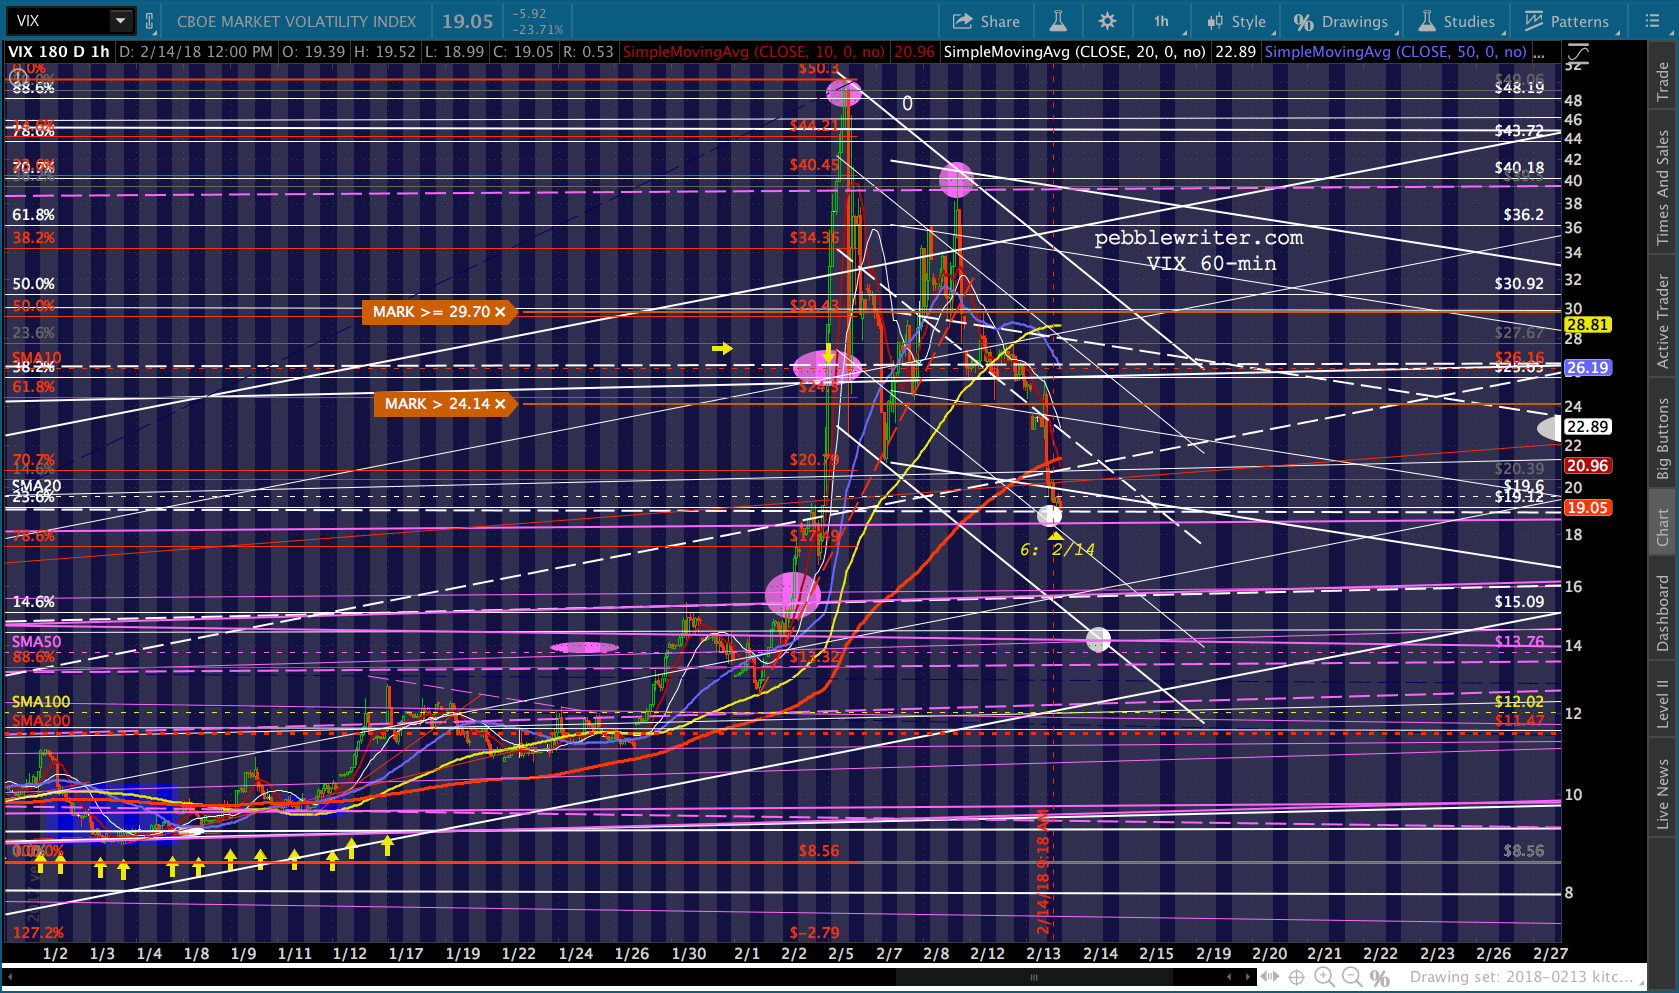
 UPDATE: 1:15 PM
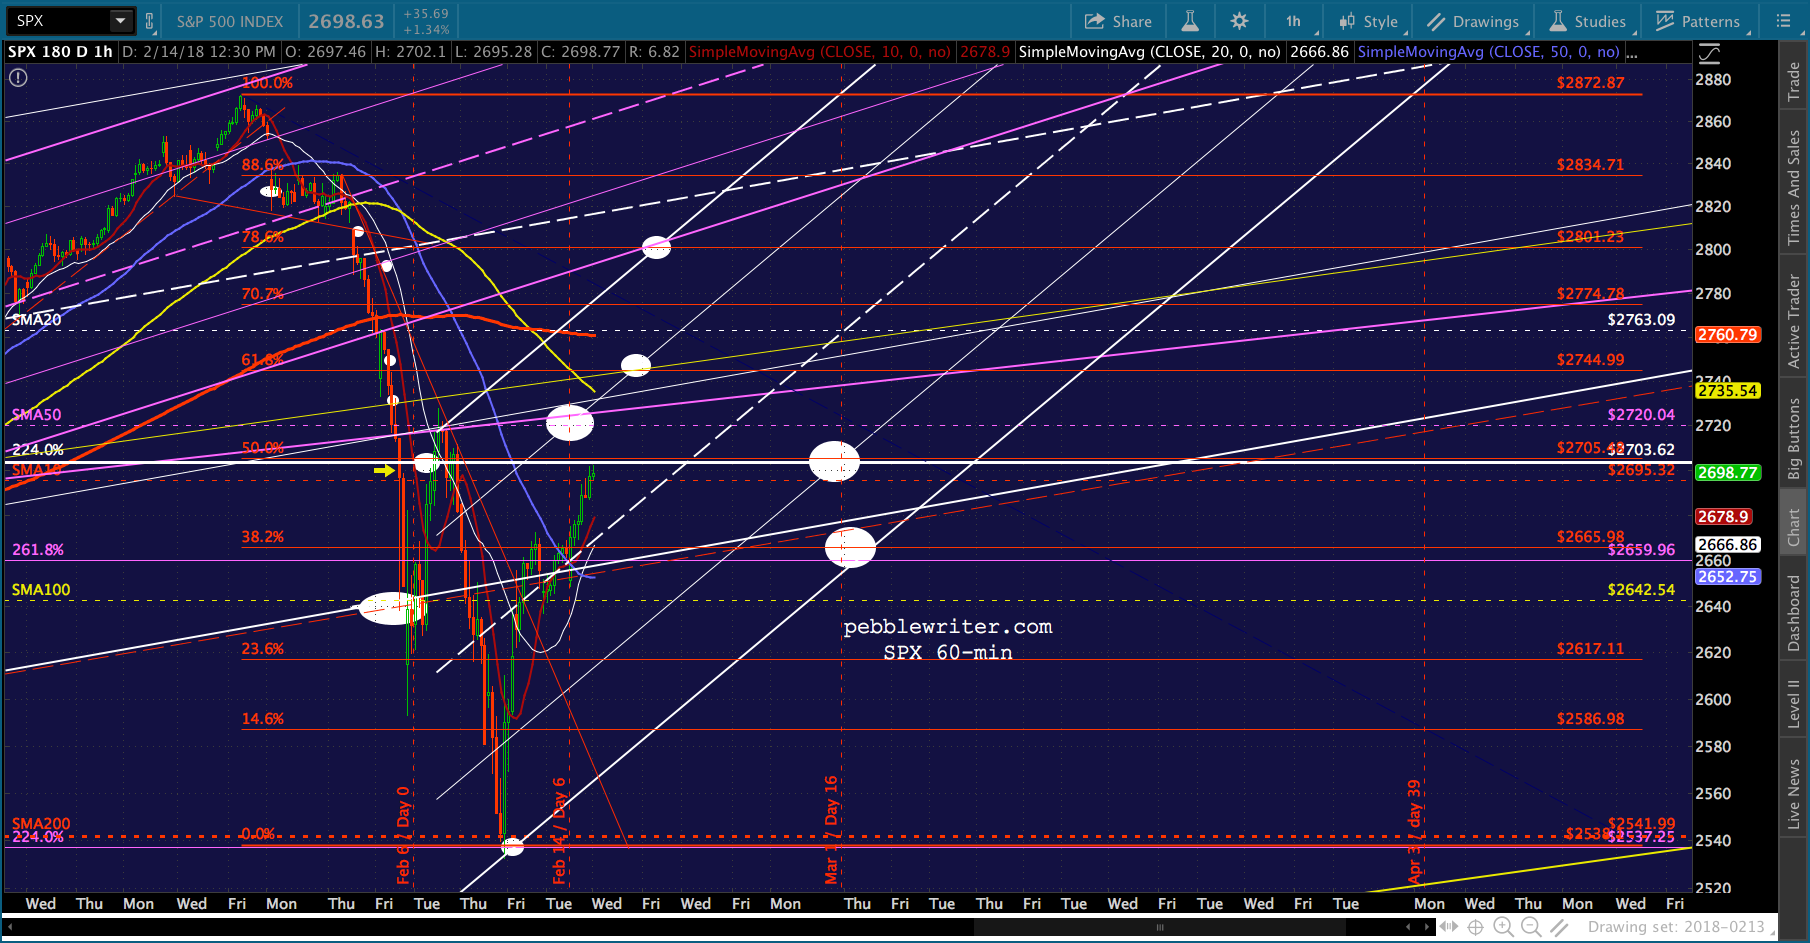
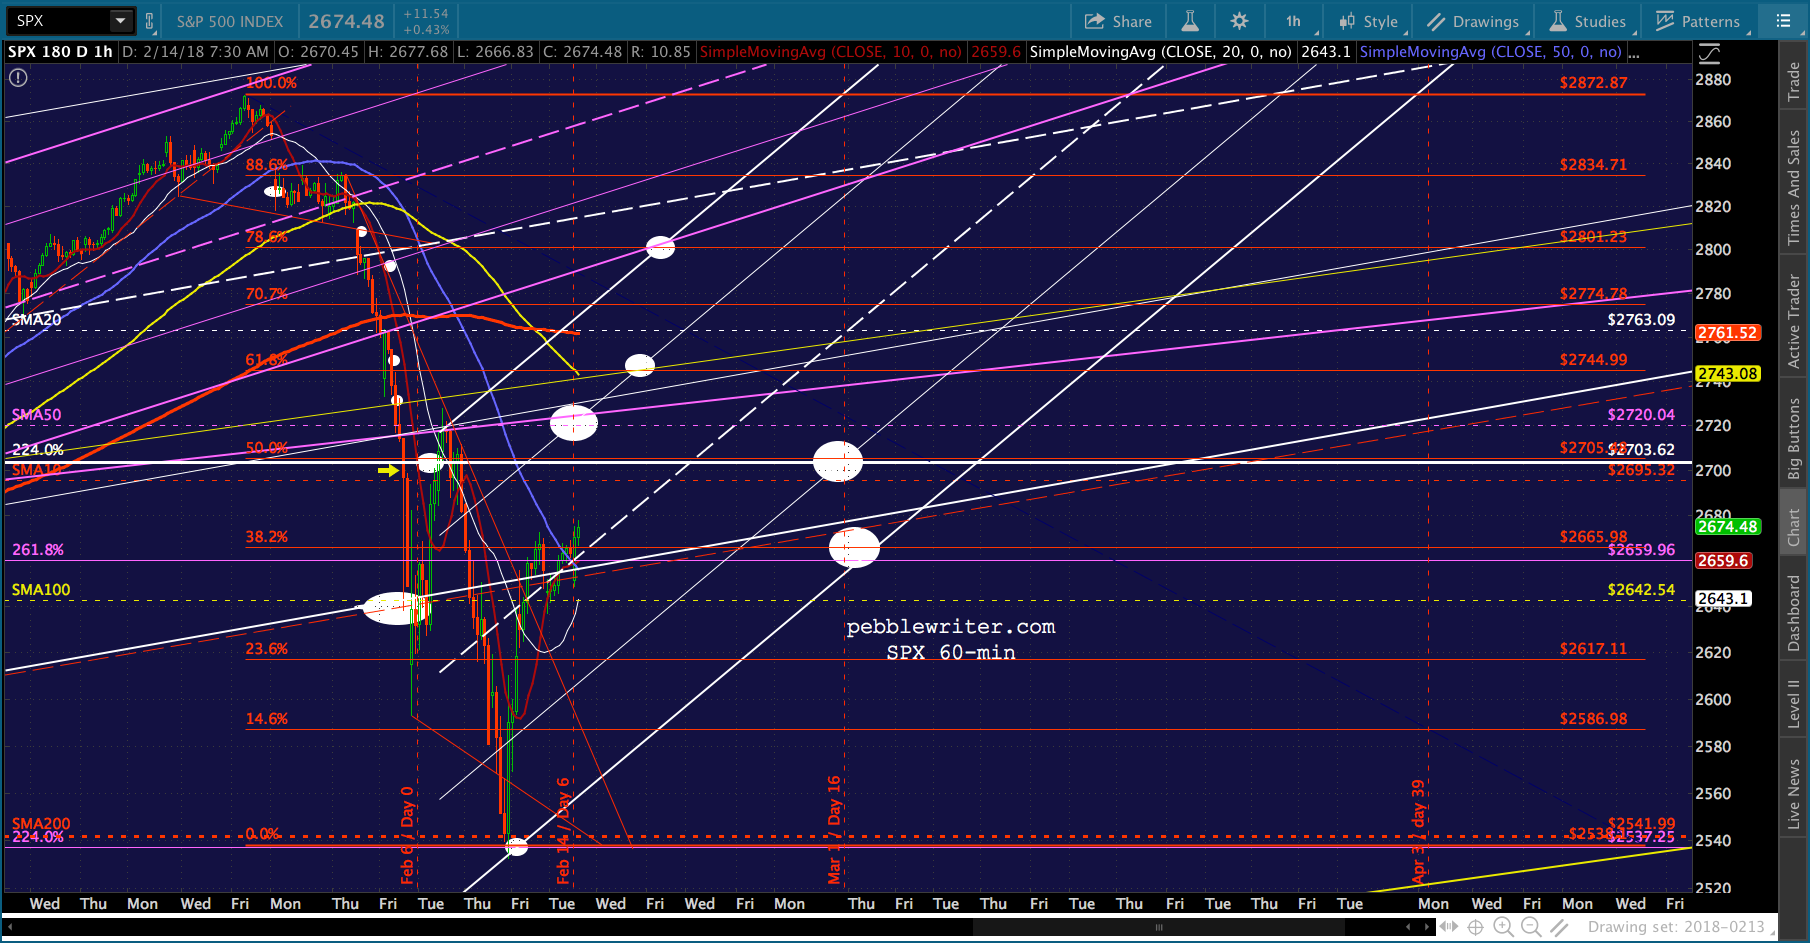
VIX has reached our initial target: the .236 Fib and SMA20. We posted this back on Feb 8 as part of our post Analog Details, so it’s perfectly in keeping with expectations. 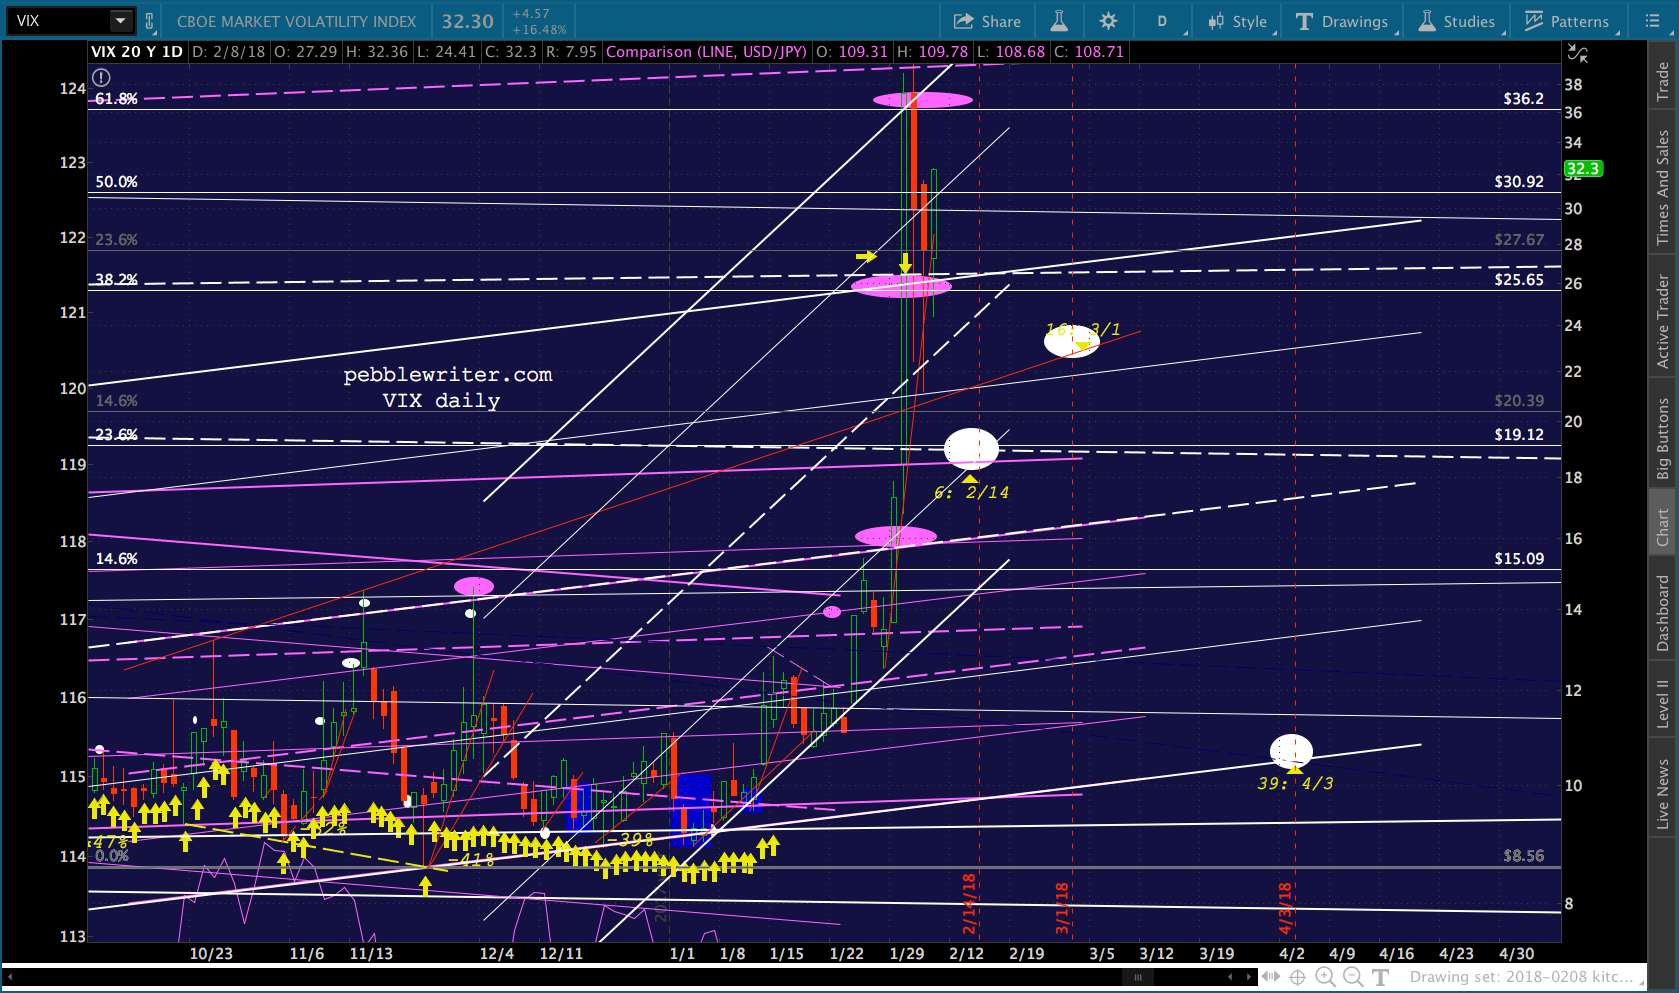 SPX isn’t back over its 2.24 (2703.62) yet, so it’s entirely possible VIX will head on down to the lower target (14.13ish) today rather than tomorrow. SPX has a good head of steam, and it would be a shame to ignore the momentum.
 But, I slightly favor the .618 being reached tomorrow on a dip by VIX to flesh out the falling channel bottom.
There is a middle ground: VIX dropping to 14.50 – 15.50 — the bottom of the falling white channel. With SPX sitting just below the SMA10 and 2.24, this is a pretty like scenario. Again, why leave those strong overhead resistance levels to chance?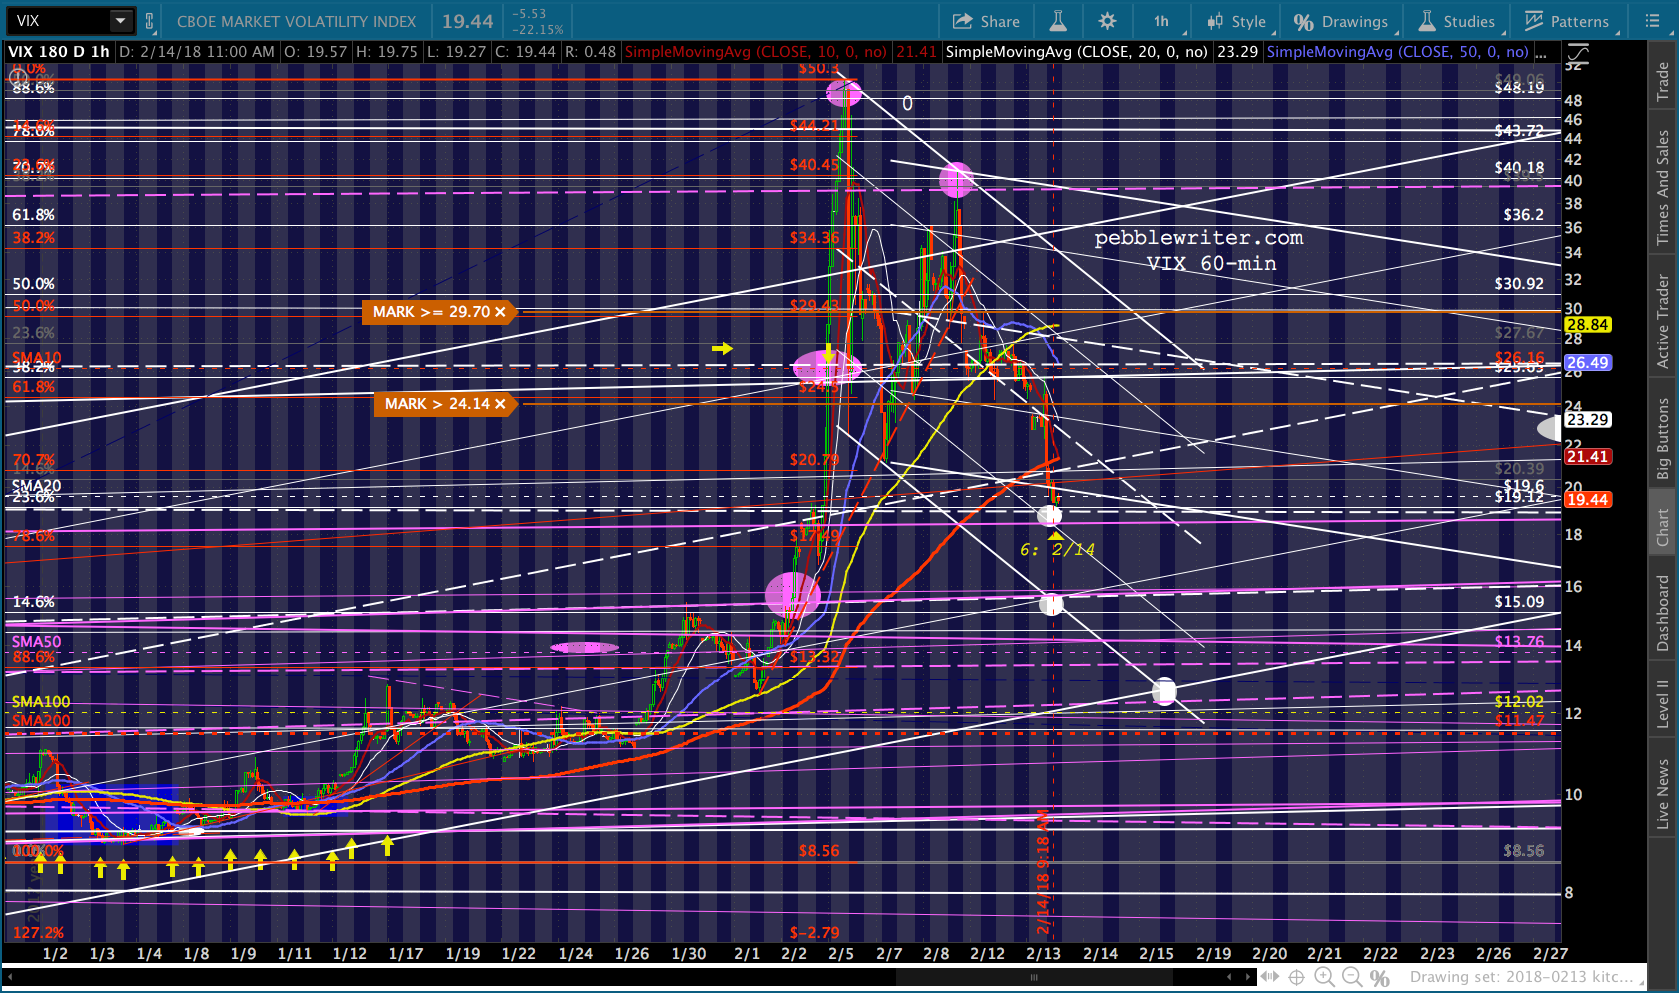 UPDATE: 3:50 PM
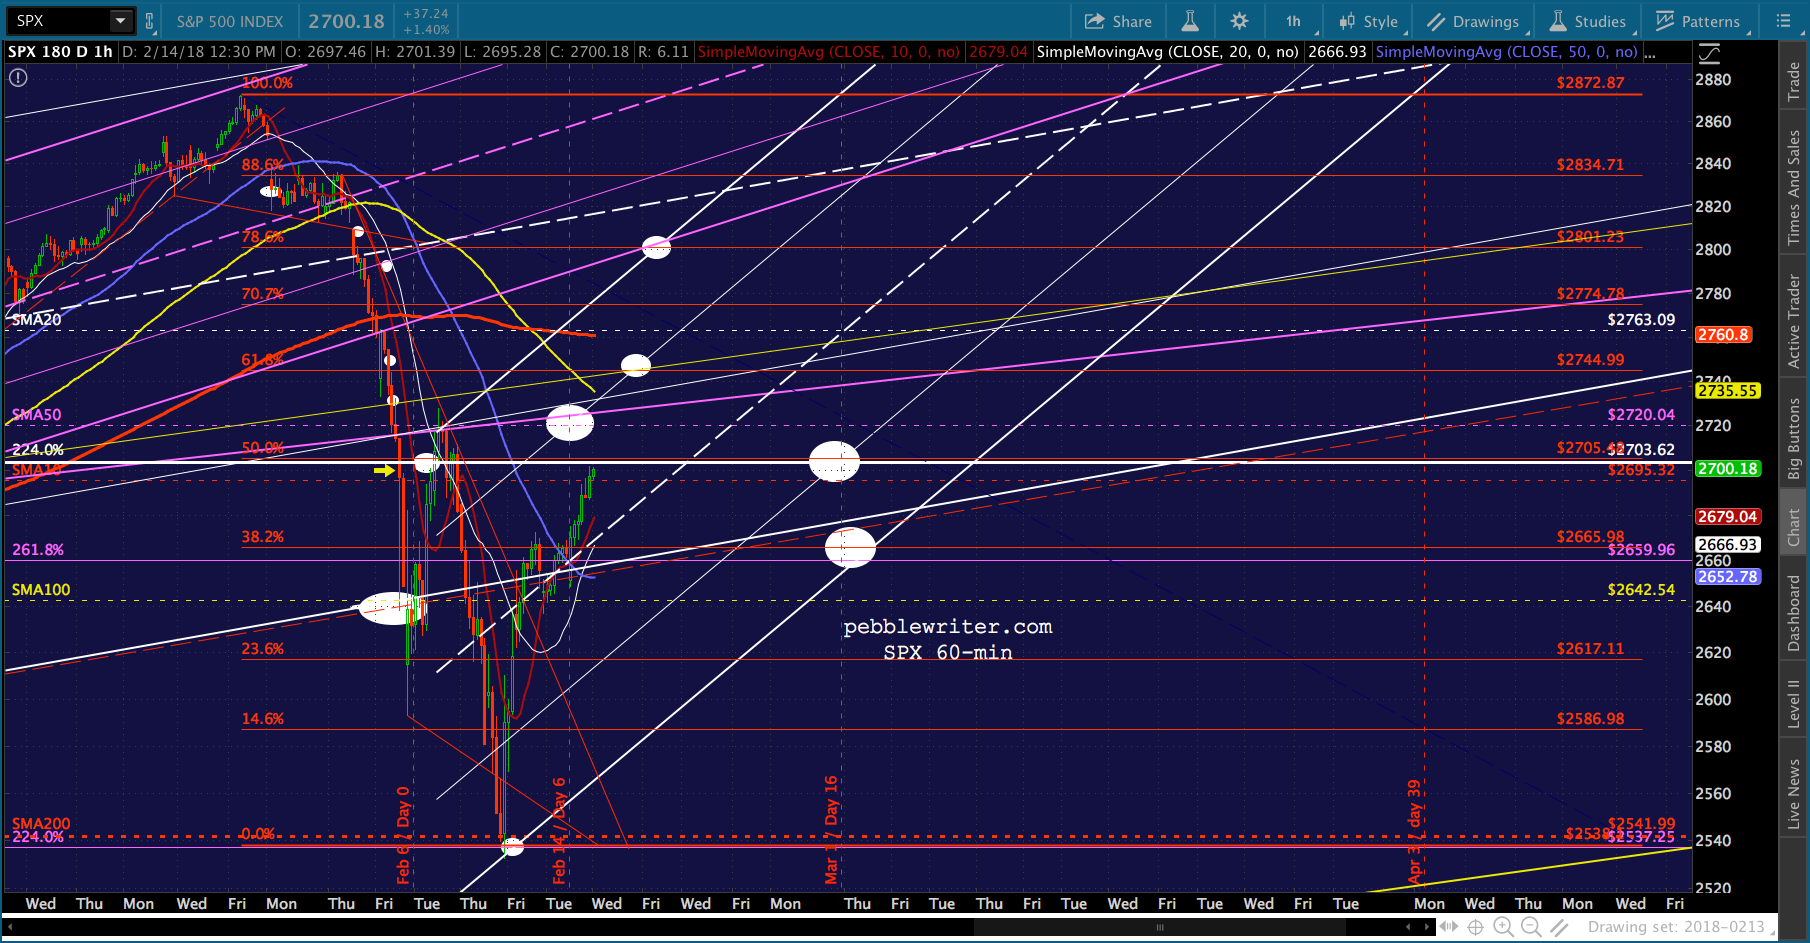
SPX is all the way up to the 2.24, with VIX in perfect position to help it punch through. Don’t know whether it’ll happen today or tomorrow.
But, again, I wouldn’t leave it to chance if I were in a position to decide. I’d punch through now to the SMA50, then backtest the 2.24 in the morning and run on up to the .618 or .786.
I have to punch out early today. Hope to post later tonight based on the close. GLTA.
 UPDATE: 9:45 PM
VIX dipped as low as 18.99 and has gone sideways ever since. SPX reached 2702.10 before closing at 2698.63. Futures are currently up 6.50, which would gap SPX above the 2.24 in the morning if it holds. Note that ES’ 2.24 is still 24 points away.
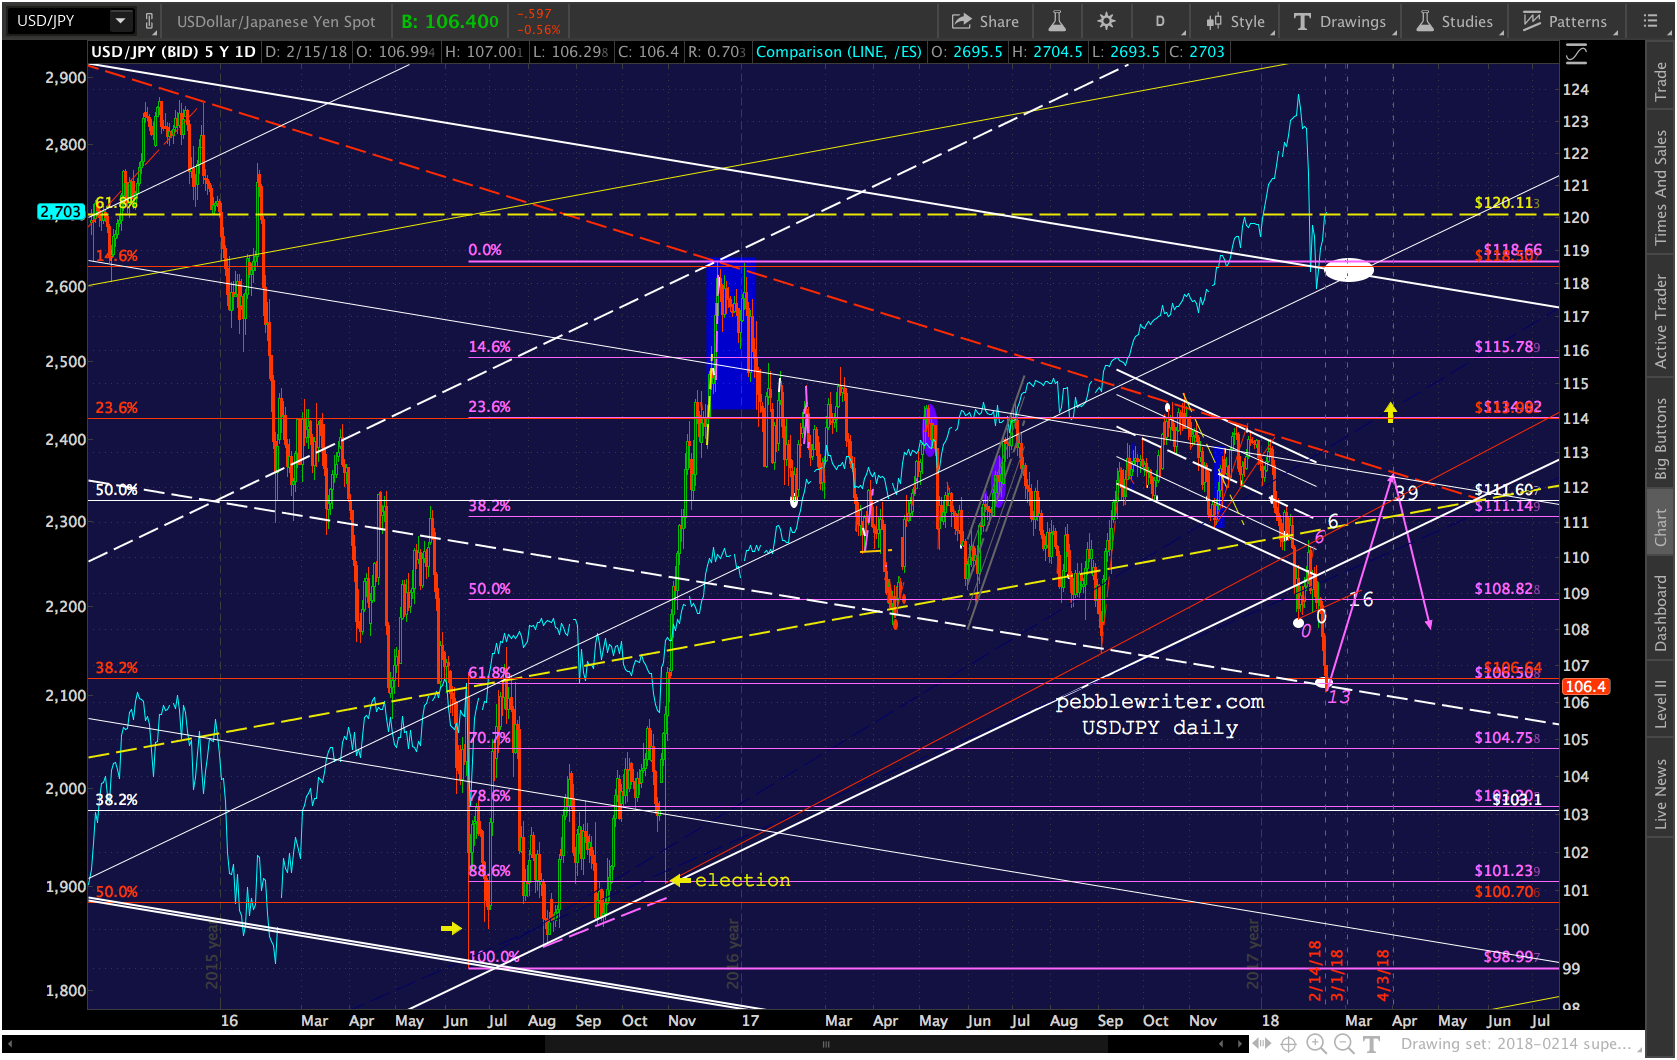
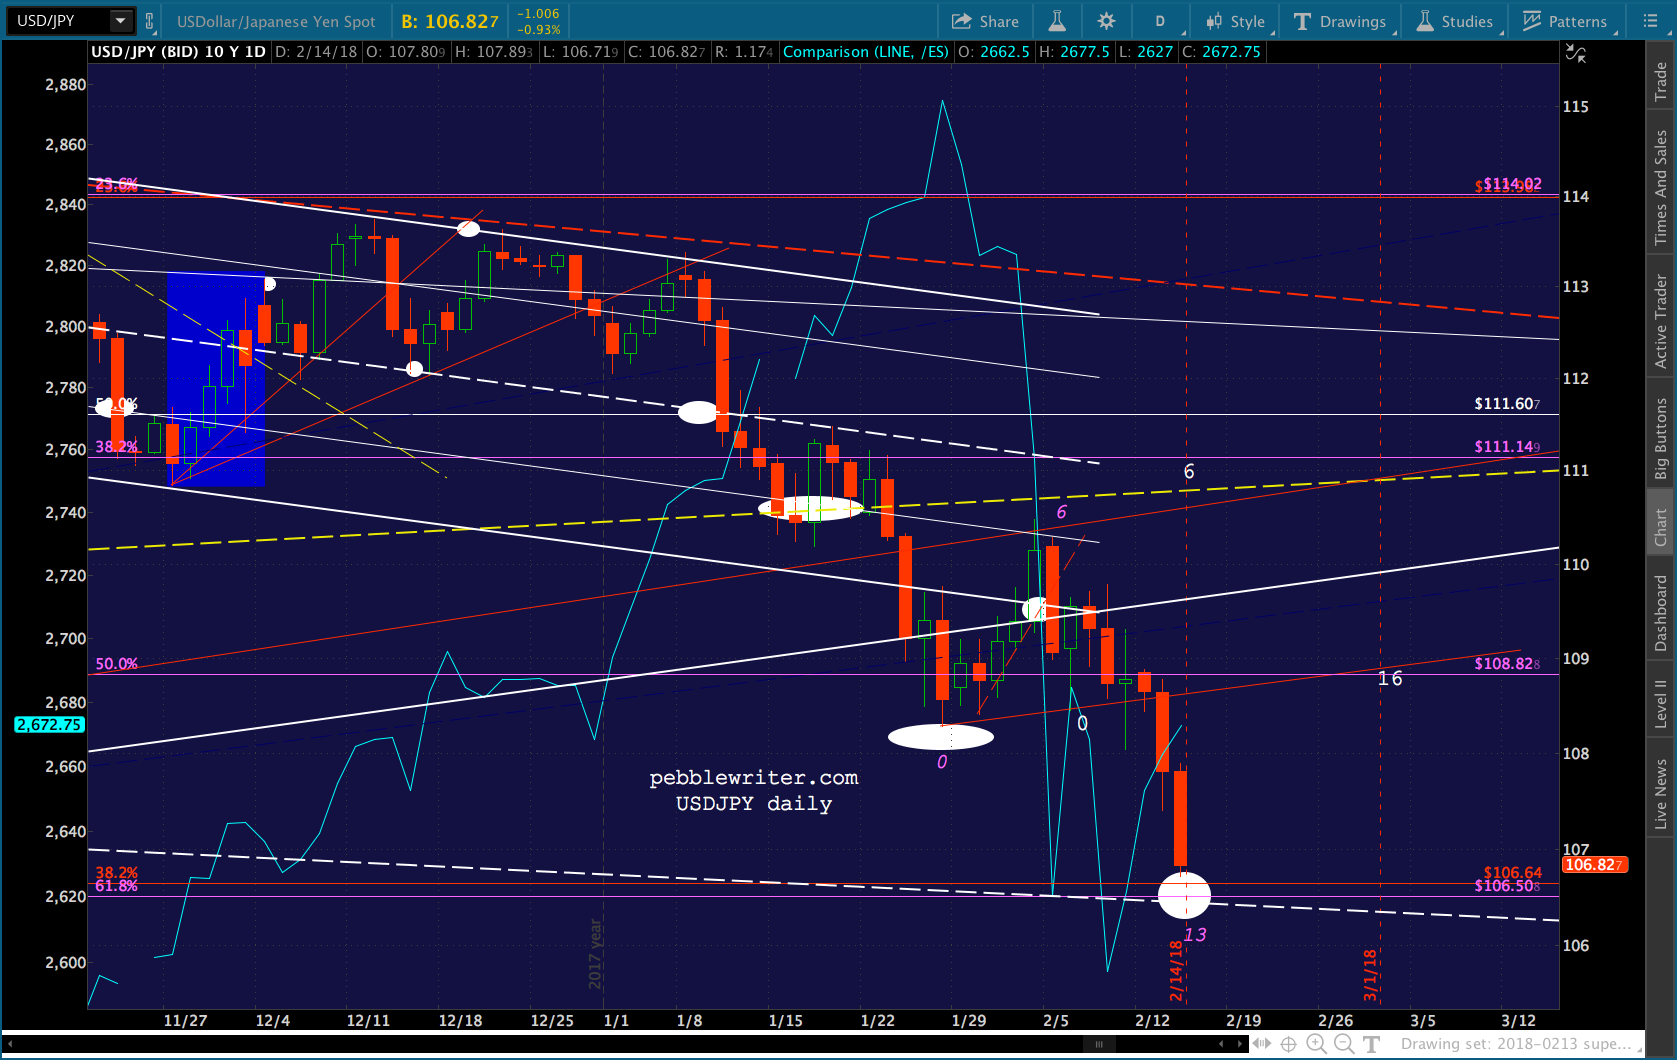
USDJPY just reached our 106.50 target. If it bounces here, it could support SPX/ES even if VIX eases off the accelerator — which the analog says it should do beginning tomorrow (even though the chart suggests it’ll go a little lower first.) Looking like 13.32 is a reasonable target.
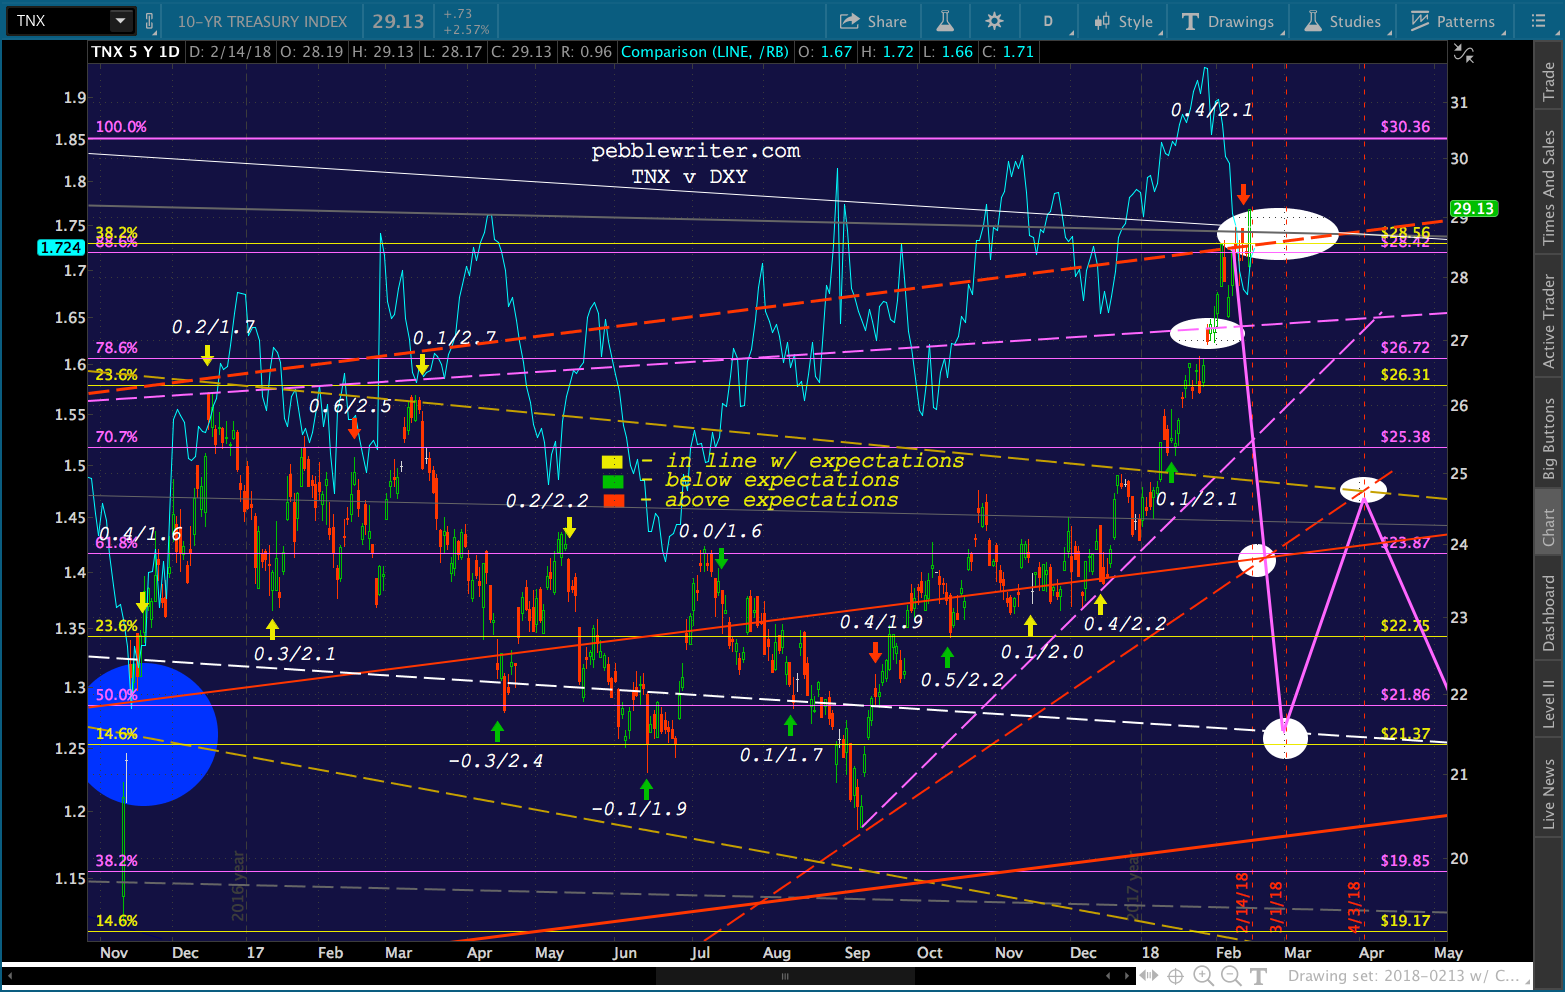
Big mystery is whether TNX is an overshoot or it’s breaking out. I’m guessing an overshoot, though we should find out very soon. We haven’t had a lot of big MoM CPI figures that were also below expectations. The most recent one I can find were on Oct 13, a big down day for TNX which was followed by a strong rally — not much help as an example.
Like USDJPY, ZN is ignoring the analog and doing what we thought it would do before the analog came along. It seems to be making a beeline for the yellow or white channel bottom, which would almost certainly drive TNX above current levels. Stay tuned.