

See if you can spot the point at which TSLA disclosed its purchase of $1.5 billion in BTC.
 Yes, in a world where seemingly everything is making new highs, BTC joins the party – courtesy of Elon Musk.
continued for members… (more…)
See if you can spot the point at which TSLA disclosed its purchase of $1.5 billion in BTC.
Yes, in a world where seemingly everything is making new highs, BTC joins the party – courtesy of Elon Musk.
continued for members… (more…)
In another obvious show of how easily this market can be manipulated, ES’ final bearish Head & Shoulders Pattern was busted in the final five minutes of trading yesterday. This morning, SPX’s H&S Pattern will also be busted with a burst higher in the wake of another disappointing jobs report.
 And all it took was for the “Bad News is Good News” algo to pin futures to their ramp job highs until 9:31. The BN=GN algo, of course, has nothing to do with additional stimulus.
We already know $1.9 trillion is on the way to some who desperately need it and countless more who don’t. It also has nothing to do with additional QE. That’s an ongoing $120 billion per month, rain or shine.
No, it is about the usual tricks employed by central banks and their proxies: shorting VIX… …shorting bond futures…
 …ramping WTI futures…
 …and shorting the yen.
  They have all been employed over the past week just to make sure that any lingering bearish patterns were undeniably busted.
 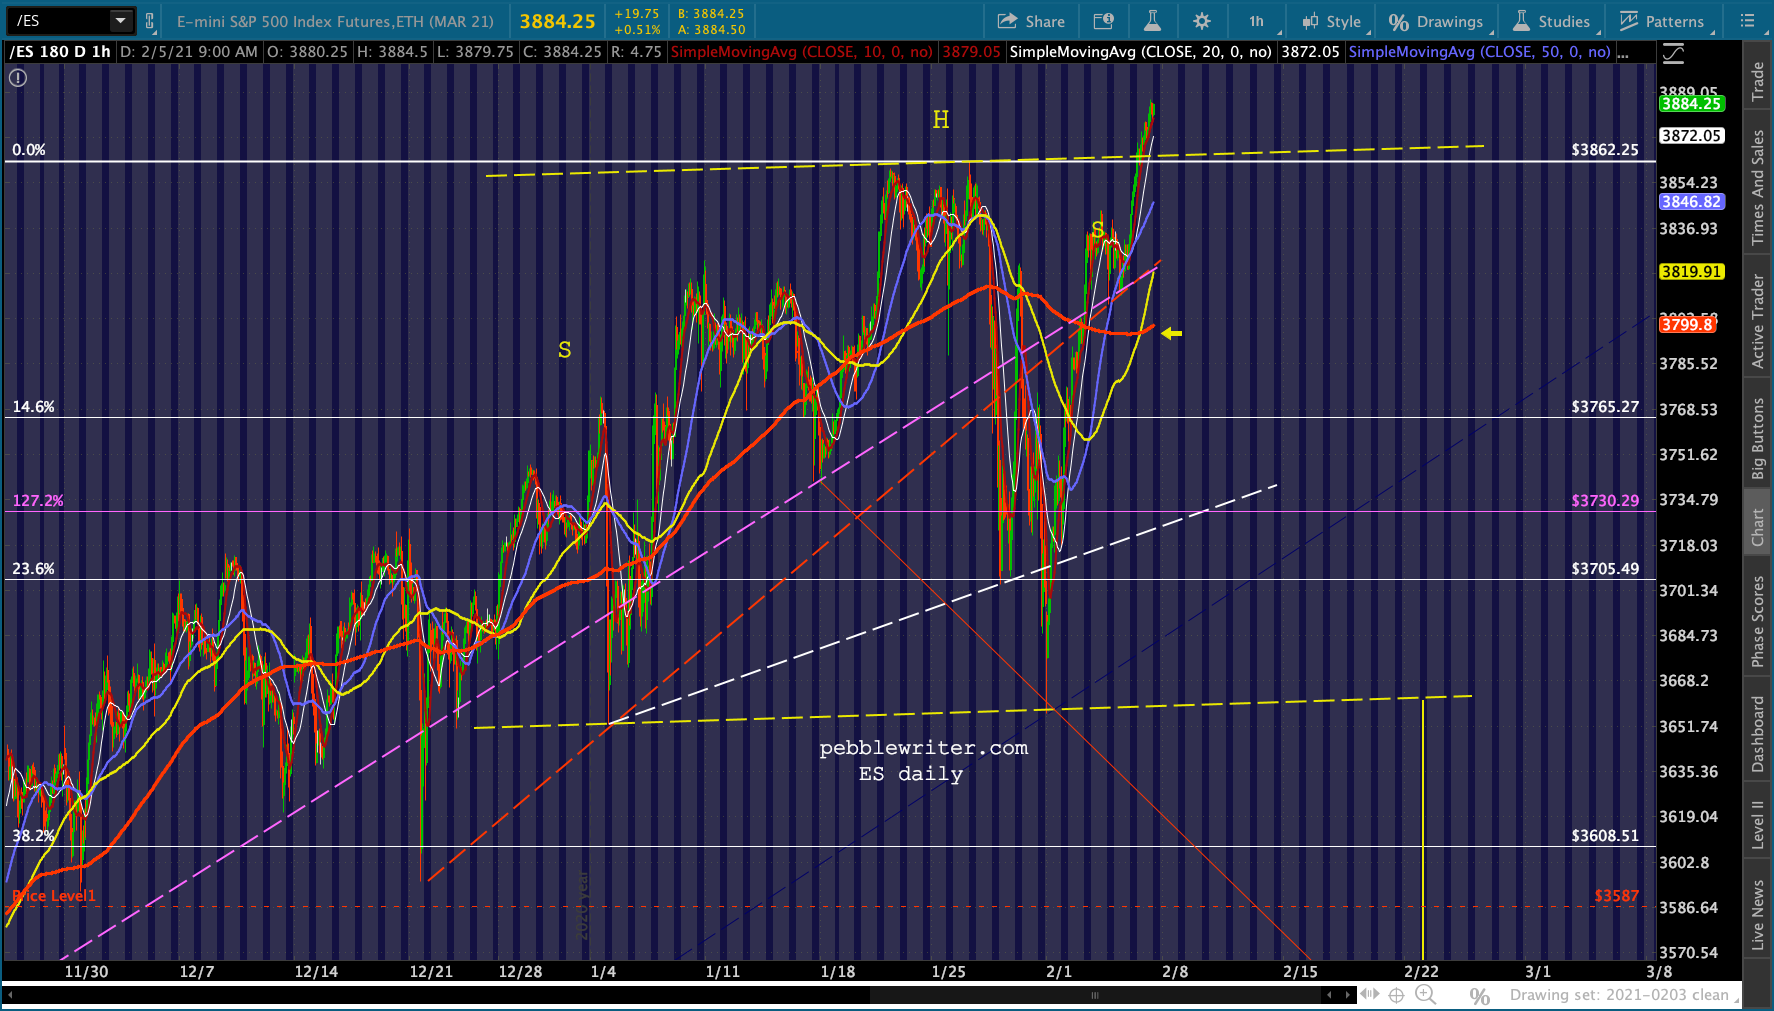 Just another day in the “markets.”
continued for members… (more…)
In Friday’s post VIX: Back From the Dead we noted that VIX had recovered from the breakdown below trend dating back to Nov 27. This morning, it’s testing overhead resistance from Jan 4 and, if it’s able to break through, will likely take on resistance from Dec 21 or even Oct 29.  Bears might want to hold off on the champagne just a bit longer, though. One of VIX’s favorite tricks is to race up to resistance in the pre-market so it has someplace to reverse lower from.
The FOMC will issue its latest pearls of wisdom on Wednesday. And, as ES’s chart aptly illustrates, they are loathe to allow a significant decline in the lead-up to these exercises in obfuscation.
Here’s the chart we posted Friday evening.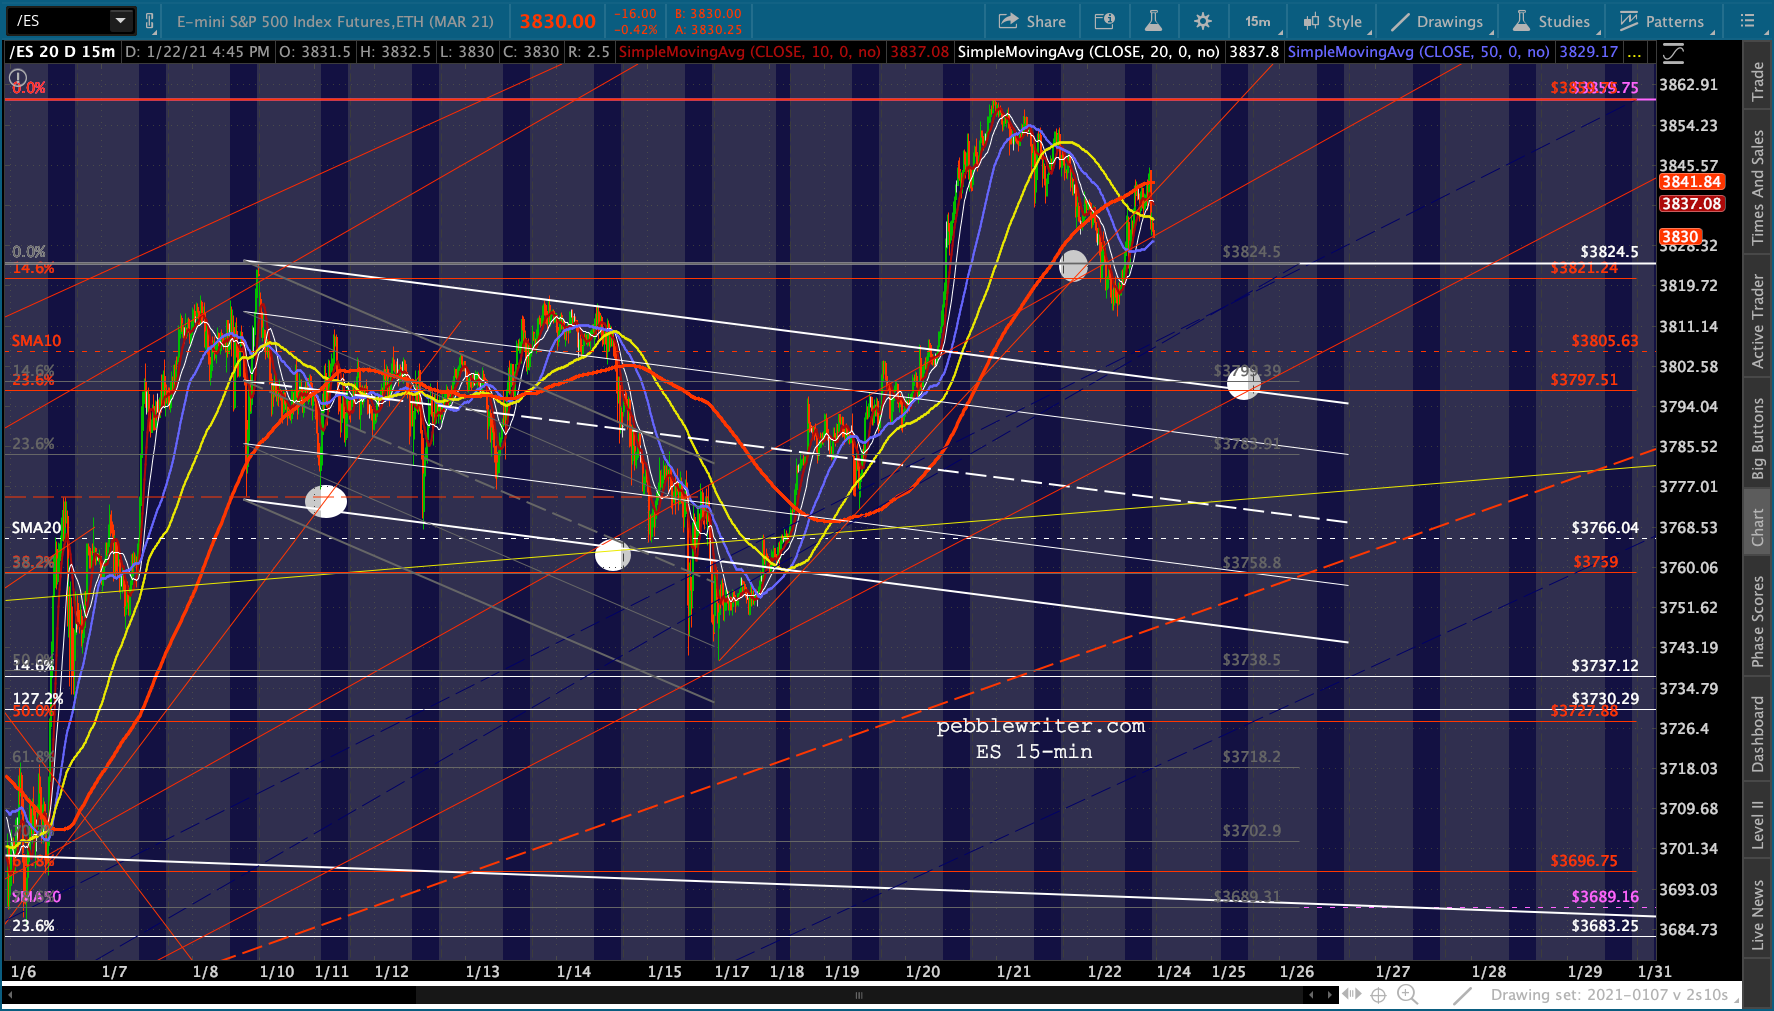 continued for members… (more…)
The last time we were this bearish on oil and gas was on October 3, 2018 [see: VIX Takes the Plunge.] Our reasoning at the time:
CL and RB [have] not only reached overhead resistance by our measure, but must deal with inflation that’s too high, bearish API data, another round of Trump tweeting, and a large build in EIA inventory. I think the time has finally come to revert to short…
WTI and RBOB both tumbled about 40% over the next three months.
At nearly 3%, inflation had been too high – sending the 10Y to 3.5%. Highly correlated, both had recently broken out of long-term downtrends: CPI above the black dotted line and the 10Y above the blue dotted line. Historically, this might have been perfectly acceptable. But, as we were shouting from the rooftops at the time [see: Why Rising Rates Are a Problem This Time] rising rates with a $1 trillion deficit and debt soaring past $20 trillion was completely unacceptable.
 And, inflation was too high primarily because energy prices were too high. The correlation with the YoY rise in gasoline prices, in particular, has been quite strong over the years.
 No doubt the Fed saw the writing on the wall – as did the White House. Trump had been tweeting about oil prices being too high for months. His tweets had taken on a decidedly desperate tone.
 Yet Saudi Arabia politely ignored him, and oil prices continued higher – until Crown Prince Mohammed bin Salman slipped up in a very big way.
 It took about 5 minutes for virtually everyone to connect Khashoggi’s murder with MBS – who suddenly found himself without friends. Except for one who, coincidentally, needed a favor. As we wrote in Coincidences and Consequences at the time:
It’s interesting how Khashoggi’s murder top-ticked oil and gas prices…and, so soon after Trump’s latest demand that OPEC lower oil prices. As Churchill famously said, “never let a good crisis go to waste.”
Some were aghast that we would insinuate such a thing. But, Bob Woodward’s excellent Rage recently shed some light on the topic… But, we digress. Oil and gas prices crashed 40%. Inflation and interest rates receded.
  The story might have had a happy ending, but the Fed and White House had apparently forgotten about the strong correlation between oil/gas prices and the stock market. When RB plunged 42%, SPX gave up 20%.
Not coincidentally, they both bottomed on Dec 24 (when Treasury Secretary Mnuchin convened the Plunge Protection Team – but that’s another story.) Trump probably texted to MBS…something to the effect of “jk!!! LOL!!!  ” because oil and gas prices rebounded sharply.
 Wait, you’re probably wondering, what about interest rates? Bond yields drop for all kinds of reasons. Sometimes it’s because inflation is dropping. Other times, it’s because a stock market crash scares the crap out of equity investors who sell everything that isn’t nailed down and pile into bonds.
While the PPT’s volatility crush gathered momentum, the Fed announced that the recent round of rate hikes was kaput and began cutting. Stocks were thrilled.
The occasional mini-crashes in the stock market helped drive rates even lower, until the 10Y finally bottomed out at 1.43% on Sep 3, 2019 – down sharply from its 3.25% October 2018 highs.
 Oil and gas, which had nudged stocks back to their September 2018 highs, could take a breather. Their ascent had been way out of line with the fundamentals, and the charts strongly suggested a reversal. As we wrote on April 22, 2019 [see: Oil Fails to Rally Stocks]:
One of the more effective factors in prompting algos to buy stocks is the price of oil. Yet, as we’ve been discussing, higher oil prices are a double-edged sword as they can drive inflation to levels which prompt uncomfortably high interest rates. The oil and gas picture shows RB and CL have both run out of room. It’s time to short again.
CL, which closed at 75.04 that day, fell 15% over the next six weeks. It bounced around in in the 60-70 range until January 2020, when it finally broke down. RB, which closed at 2.13 on Apr 22, fell 32% before stabilizing somewhat. It finally broke down in March 2020.
The culprit this time, of course, was the coronavirus pandemic. As we noted on February 20 [see: Buckle Up] the stage was set for the algos to keep pushing stocks higher. But, as we had discussed on January 6 [see: Middle East Tensions Escalate] the repeated failure to break out in response to numerous opportunities was itself a strong sell signal.
CL has tagged its white .886 and, having broken out above the red TL, will threaten the April highs if it breaks 64.77. If it can’t break the April highs, it will be very susceptible to a downturn. Remember, if the rising white channel breaks down, we could be looking at a major crash. Meanwhile, RB failed to break out past either its SMA200 or the red TL from the April highs. For those not already short, this is the place.
It certainly was.

continued for members… (more…)
ZN broke down from its rising red channel back on the 6th. Since then, it has found support in a falling channel – from which it is now threatening to break down. This is a moment of truth for bonds and the many correlated assets such as GC, shown above. Stocks might not be amused.
 continued for members… (more…)
Maybe Warren Buffett can get through to Congress. In a CNBC interview aired this morning:
“It’s so important that small businesses, which have become collateral damage in a war that our country needed to fight, but we, in effect, voluntarily had an induced shut down of parts of the economy, and it hit many types of small businesses very, very hard… We made some provision for that in March in terms of the CARES Act, but then nobody really knew how long this self-inflicted recession would last with this particular effect on small businesses, so we need another injection to complete the job.”
Congress, the Treasury and the Fed have done a terrific job of “saving” corporations that already had access to plenty of cheap capital and whose stock prices could then vouch for the strong recovery from the pandemic. The rest of the economy? Not so much.
For all the independent restaurants, mom and pop stores, non-big box retailers, things are dismal. And, to all the unemployed folks barely hanging on to their house or their apartment, it will get much worse if Congress doesn’t act in the next few days to prevent them from being evicted during the depths of winter in the midst of a pandemic.
Naturally, futures are up 25 points. According to VIX, it probably won’t last.
continued for members… (more…)
One of my favorite market indicators is our yield curve model. It has warned us several times in advance of significant correctionsthis year.
Warnings over the past few years have included:
July 16, 2018: The Yield Curve Update – We were a little early. SPX closed at 2798 that day, rose to 2940 before crashing 20% by Dec 26. The final 13% was signaled on Dec 5: The Yield Curve’s Warning.]
April 25, 2019: The Yield Curve Model Warns Again – SPX gained 21 points over the next four sessions before quickly shedding 226 points.
February 20, 2020: Buckle Up – SPX (which had topped out the day before) crashed by over 35% over the next month.
August 25, 2020: Update on AAPL – We were about a week early, but the model signaled a correction which saw SPX fall 11%, followed by another 9% the next month.
The recent breakout of the 2s10s is clearly a bearish signal – though it hasn’t yet paid off. Is the model still working?  First, a little history. Among other things, the model holds that breakouts above significant resistance are bearish for equities.
If we plot the 2Y and 10Y together, we can see that significant sell-offs in stocks were marked by more rapid declines in 2Y yields than in 10Y yields (i.e., a widening of the spread between the two.)
The shaded areas below illustrate the period during which stocks experienced their most significant corrections between 2000-2013. Though the 2Y and 10Y both declined during these periods, the 2Y yields clearly fell faster.
 But, as we saw in 2015-2016 and again in late 2019, not all corrections involved a steepening. These selloffs occurred without the yield curve model signal being triggered.
  Did the model stop working? Hardly. The decline earlier this year was a stark reminder of its predictive power.
  What made these corrections different? More importantly, what is the model signaling now, and how likely is it to play out?
continued for members… (more…)
Almost 8 months ago I posted our first outlook on BTC [see: FOMC Embraces MMT.] We noted at the time that the FOMC was “officially in the short-squeeze business” after ES came within 19 points (trading was halted there) of our 2155 target and the Dow was set to test the Nov 8, 2016 (election day) lows.
This was the perfect time to assess what unleashing massive amounts of liquidity might do to crypto. We noted at the time that BTC should bounce from its triangle bottom (on the arithmetic chart) and return to test the top trend line at around 9,925. We also noted that BTC had rebounded back above a TL on its log chart – an encouraging sign that supported the fundamental outlook.
  We left off with the note:
If you believe that BTC will necessarily rise (as gold will) as QE explodes, the charts support a continuing bounce. If you believe the FOMC will do whatever it takes to support the USD and crush surrogates such as BTC and GC, then keep an eye on that TL (5,000ish) as a fairly clear stop level.
As it turned out, BTC did return to the triangle top where, as we noted in our May 28 Update on Bitcoin that it had an important decision to make. Having reached 10,074, it had held an important trend line on its arith chart…
 …but had failed to break out above a fan line on its log chart.
 Our outlook at this point was that price action should determine the next move.
Is BTC a buy here on a potential breakout? Maybe. But, given the fact that it’s barely off its April highs, cautious types might want to wait for an actual breakout. If it occurs, there would be a small opportunity loss from not getting in here. But better to give up a few percent than lock in a trade with a lot more downside.
The alternative for more nimble types: go long but watch that rising TL from Mar 16 on the arith chart like a hawk. If BTC drops below it, run for the hills.
It took over three weeks, but BTC eventually broke out and, in the process, completed an IH&S pattern we’ve been watching and, just this morning, tagged the pattern’s 17,150 target well ahead of our target date in mid-December. After exploding 2.65X since Mar 23, what’s next?
continued for members… (more…)
Futures remained slightly lower following lower than expected initial claims (709K vs 740K consensus) and CPI – which came in at 1.2% annual and 0.0% for October. Note that it took a plug number outlier +1.2% pop in electricity to keep CPI from going negative.

One would think if the economy were really all that healthy, especially with the flood of liquidity still being thrown at it, we’d see at least some inflation. But, hey, we got the 10/20 crosses we were expecting in ES, SPX and VIX. So, the rally is safe…right?
continued for members… (more…)
It’s a little known fact that if you’re trying to get over the pain of back-to-back knee replacements, you should have rotator cuff surgery. At least that’s what my horoscope said. As a result, my typing skills will be a little off this morning, which means my market insight might also be a bit off. But, here goes.
After tagging our IH&S target yesterday, ES tumbled back below the bottom of the channel which broke down back in late October. It’s sitting right there at this moment, meaning the bulls and bears have yet to sort things out.
 continued for members… (more…)
