

In another obvious show of how easily this market can be manipulated, ES’ final bearish Head & Shoulders Pattern was busted in the final five minutes of trading yesterday. This morning, SPX’s H&S Pattern will also be busted with a burst higher in the wake of another disappointing jobs report.
 And all it took was for the “Bad News is Good News” algo to pin futures to their ramp job highs until 9:31. The BN=GN algo, of course, has nothing to do with additional stimulus.
We already know $1.9 trillion is on the way to some who desperately need it and countless more who don’t. It also has nothing to do with additional QE. That’s an ongoing $120 billion per month, rain or shine.
No, it is about the usual tricks employed by central banks and their proxies: shorting VIX… …shorting bond futures…
 …ramping WTI futures…
 …and shorting the yen.
  They have all been employed over the past week just to make sure that any lingering bearish patterns were undeniably busted.
 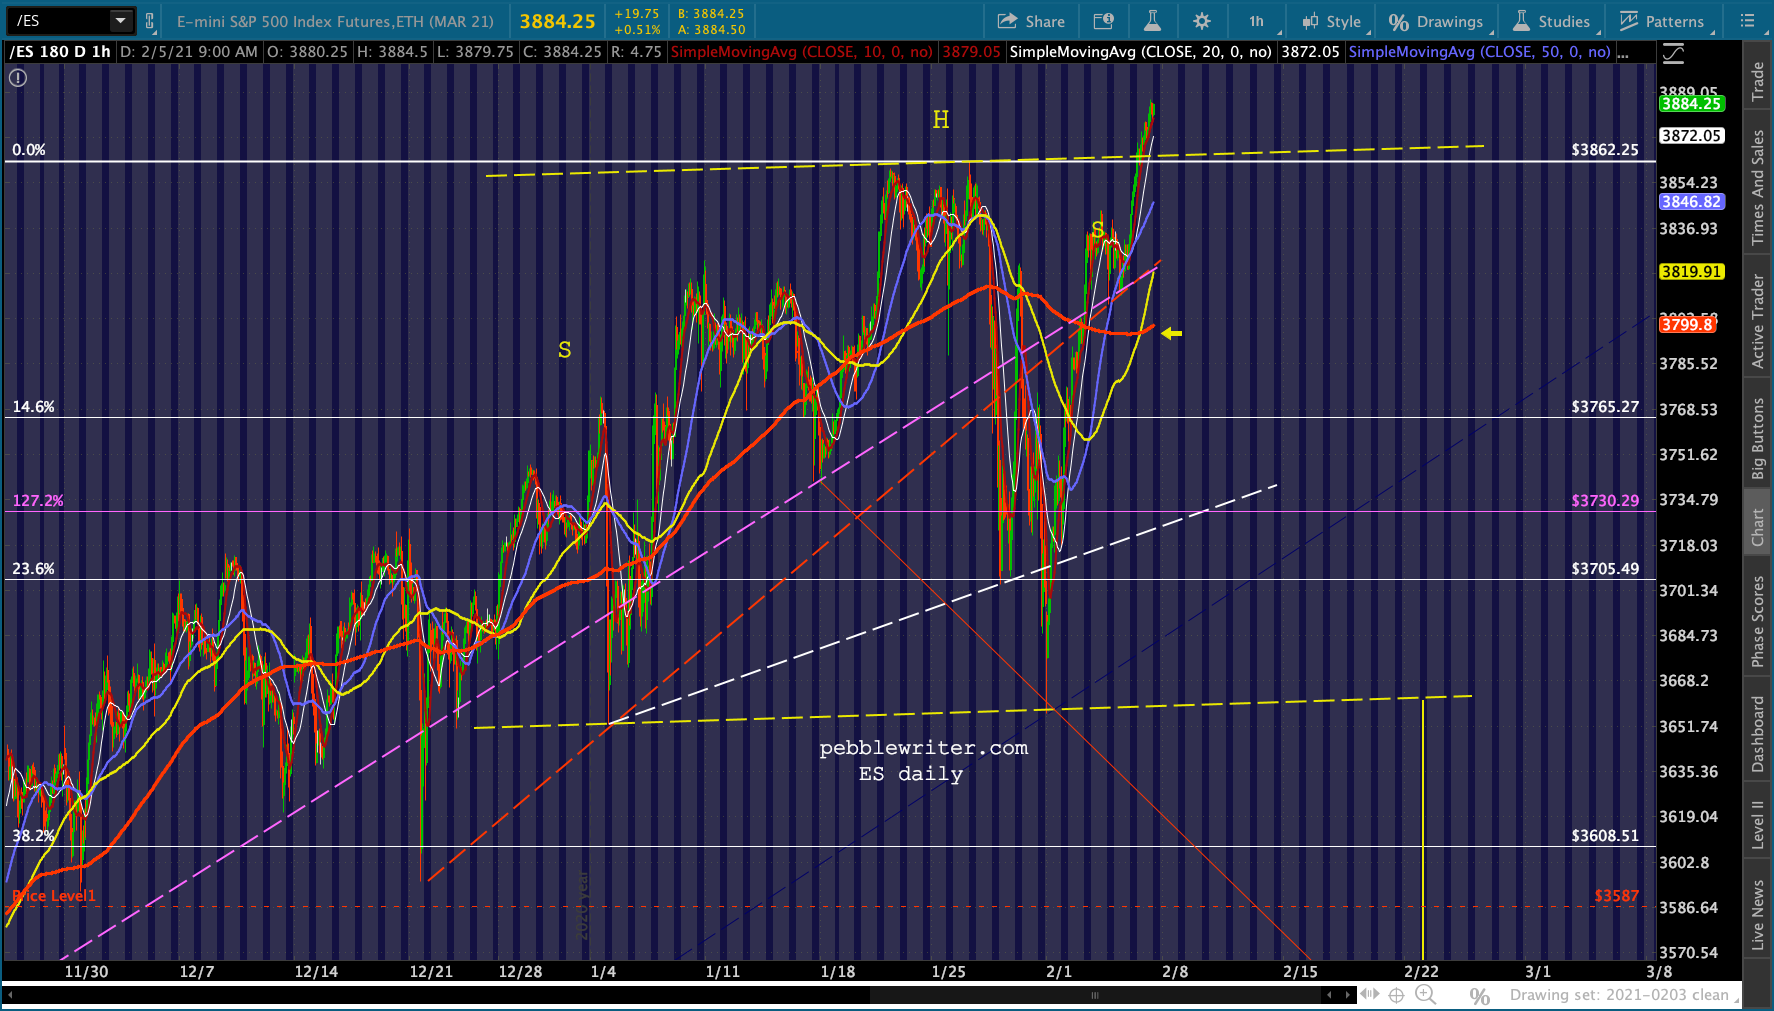 Just another day in the “markets.”
continued for members…The bigger picture:
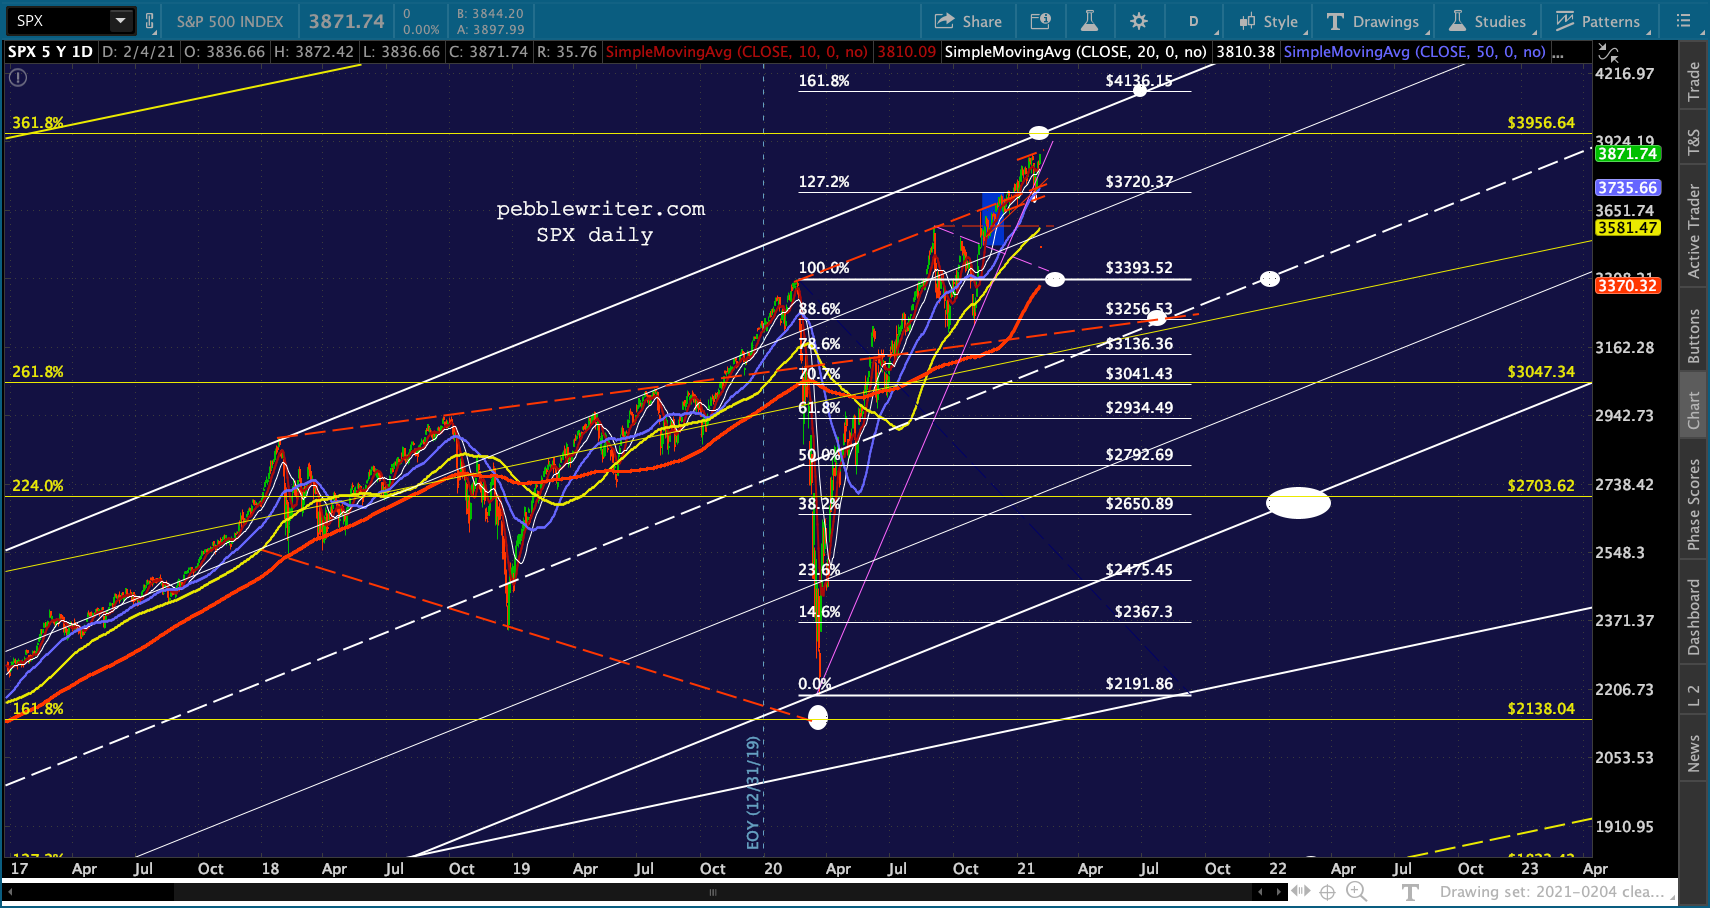
As soon as SPX tops 3883, its H&S will be officially busted. 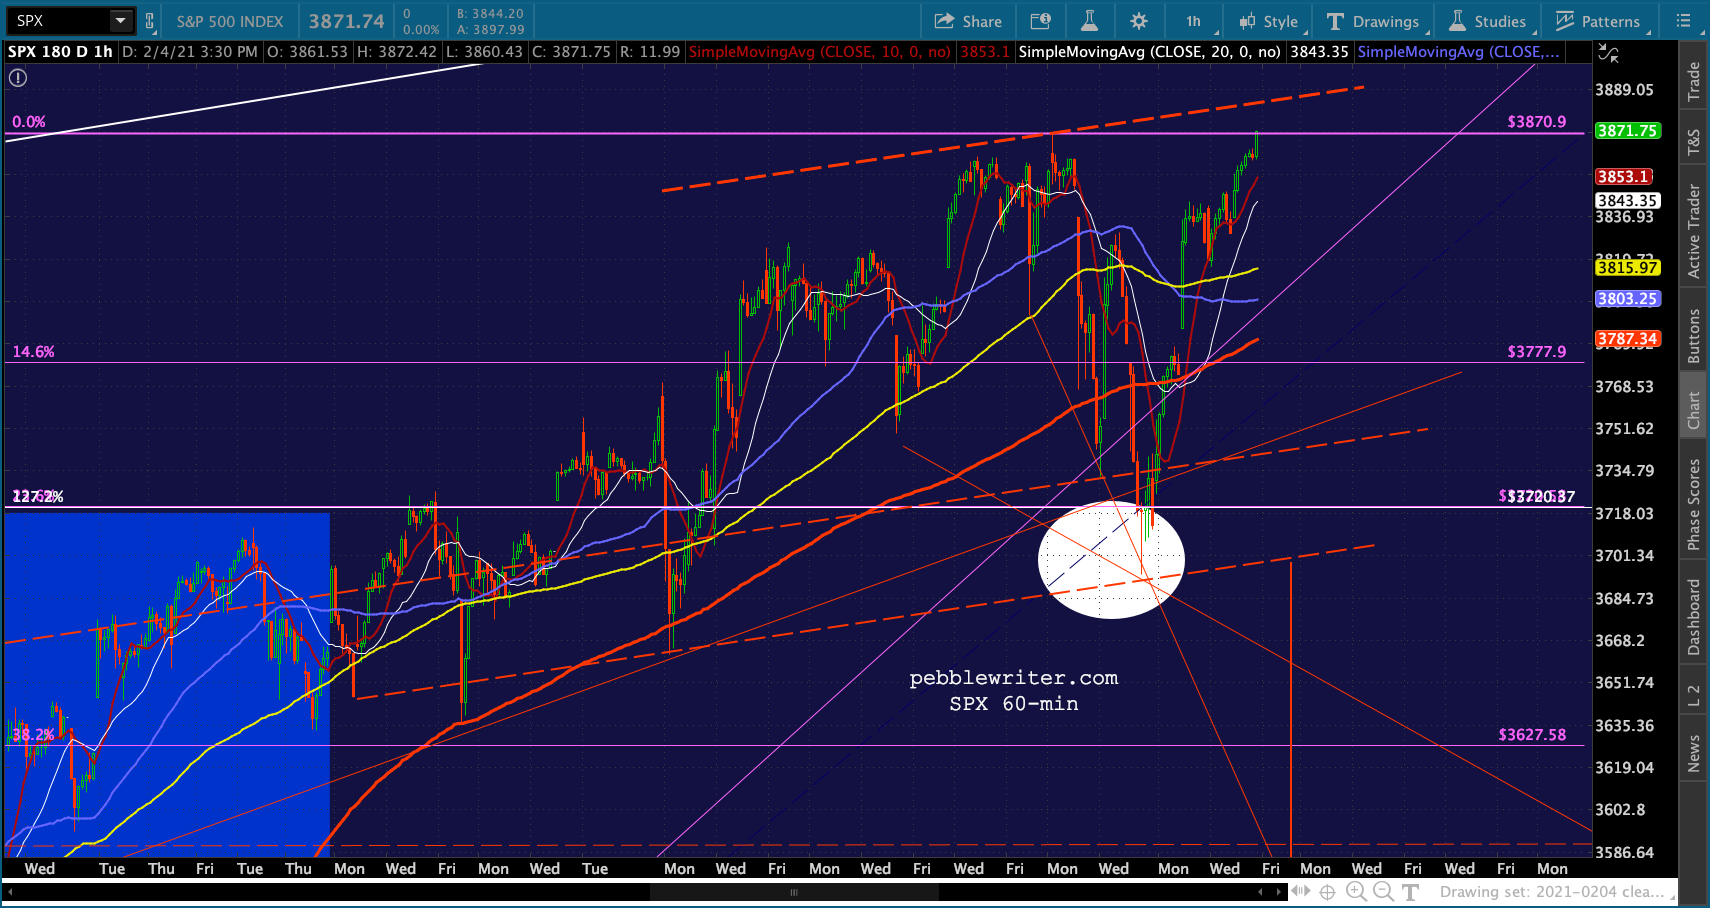 This isn’t the same as an all-clear to 3956.64, but it certainly makes things easier.
 After all, ES’ bearish 10/20 SMA cross is still a real possibility. They’re right on top of each other at the moment.
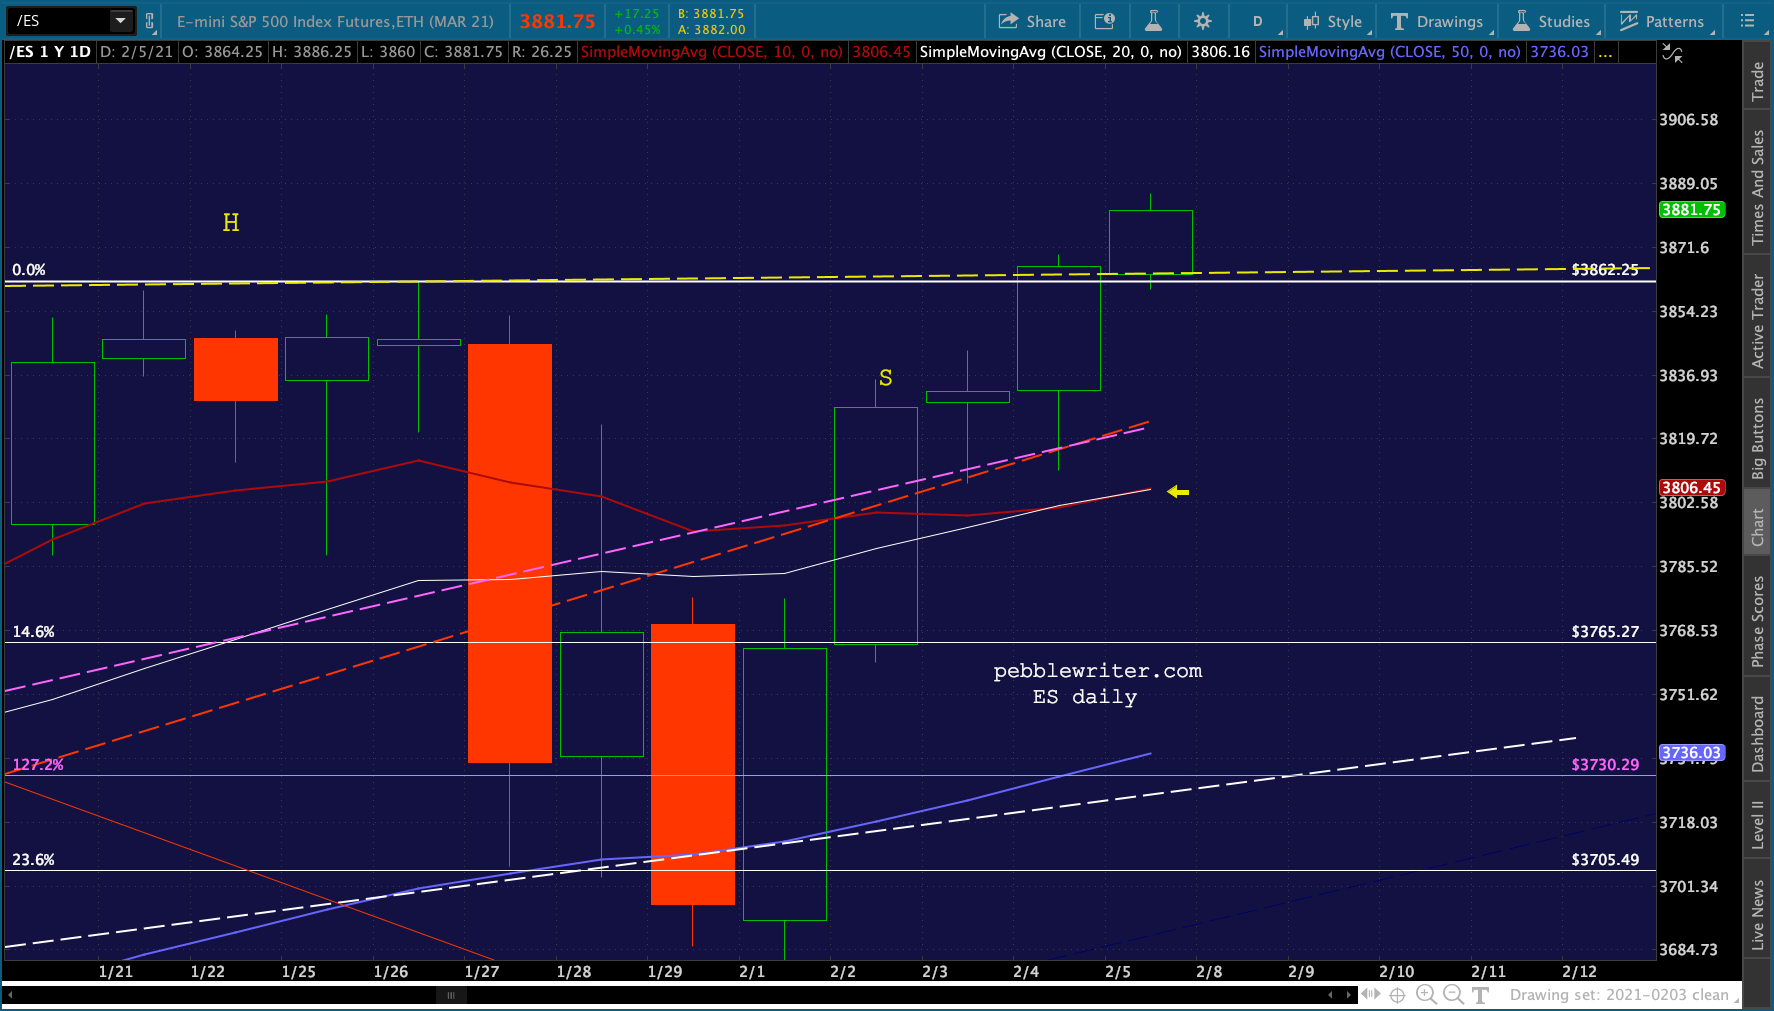 After SPX’s pattern is busted, VIX’s plunge can take a rest and save itself for something more important such as a day when the bad news is more pressing. Note that it is still laughably in a bullish 10/20 alignment.
 It still has plenty of room to drop once the latest white TL/channel bottom is broken.
  Likewise, USDJPY should back off its SMA200 and do some backtesting until something more dire comes along.
 EURUSD can stop bouncing and continue towards its SMA200.
  And, DXY can loiter for another few days.
 Note that gold’s latest breakout attempt has failed miserably and it has now backtested a broken TL from its Nov 30 lows.
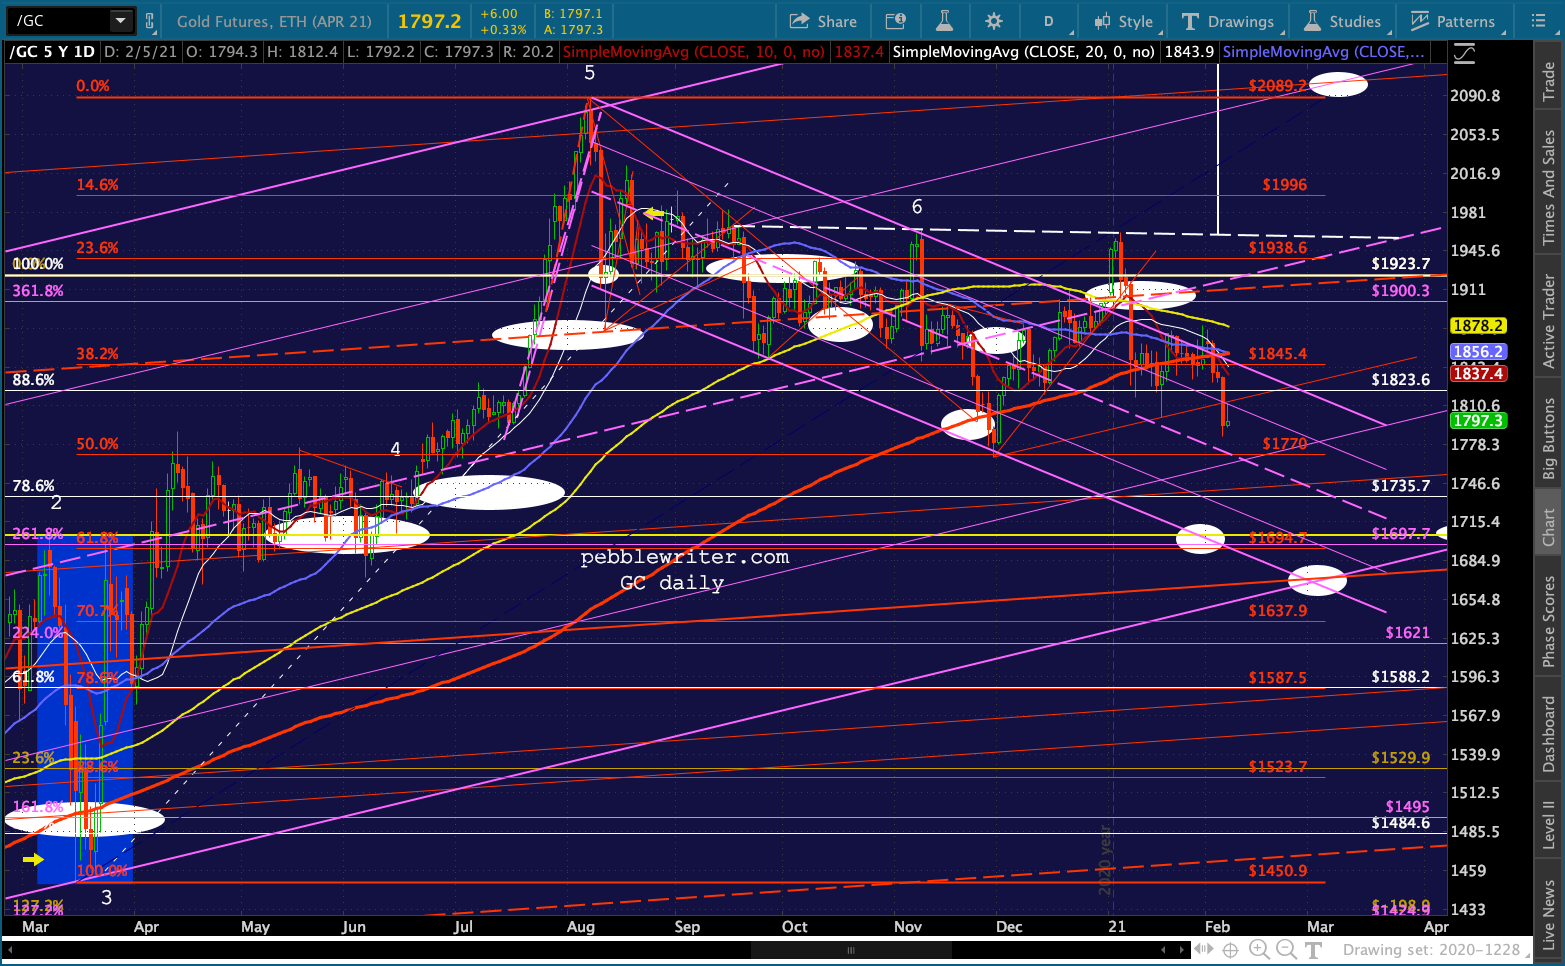 While SI is backtesting its broken white channel a little more forcefully.
 And BTC is still threatening a breakout. A push above yesterday’s high would scuttle the short case.
 CL and RB managed to stave off bearish 10/20 crosses for another day.
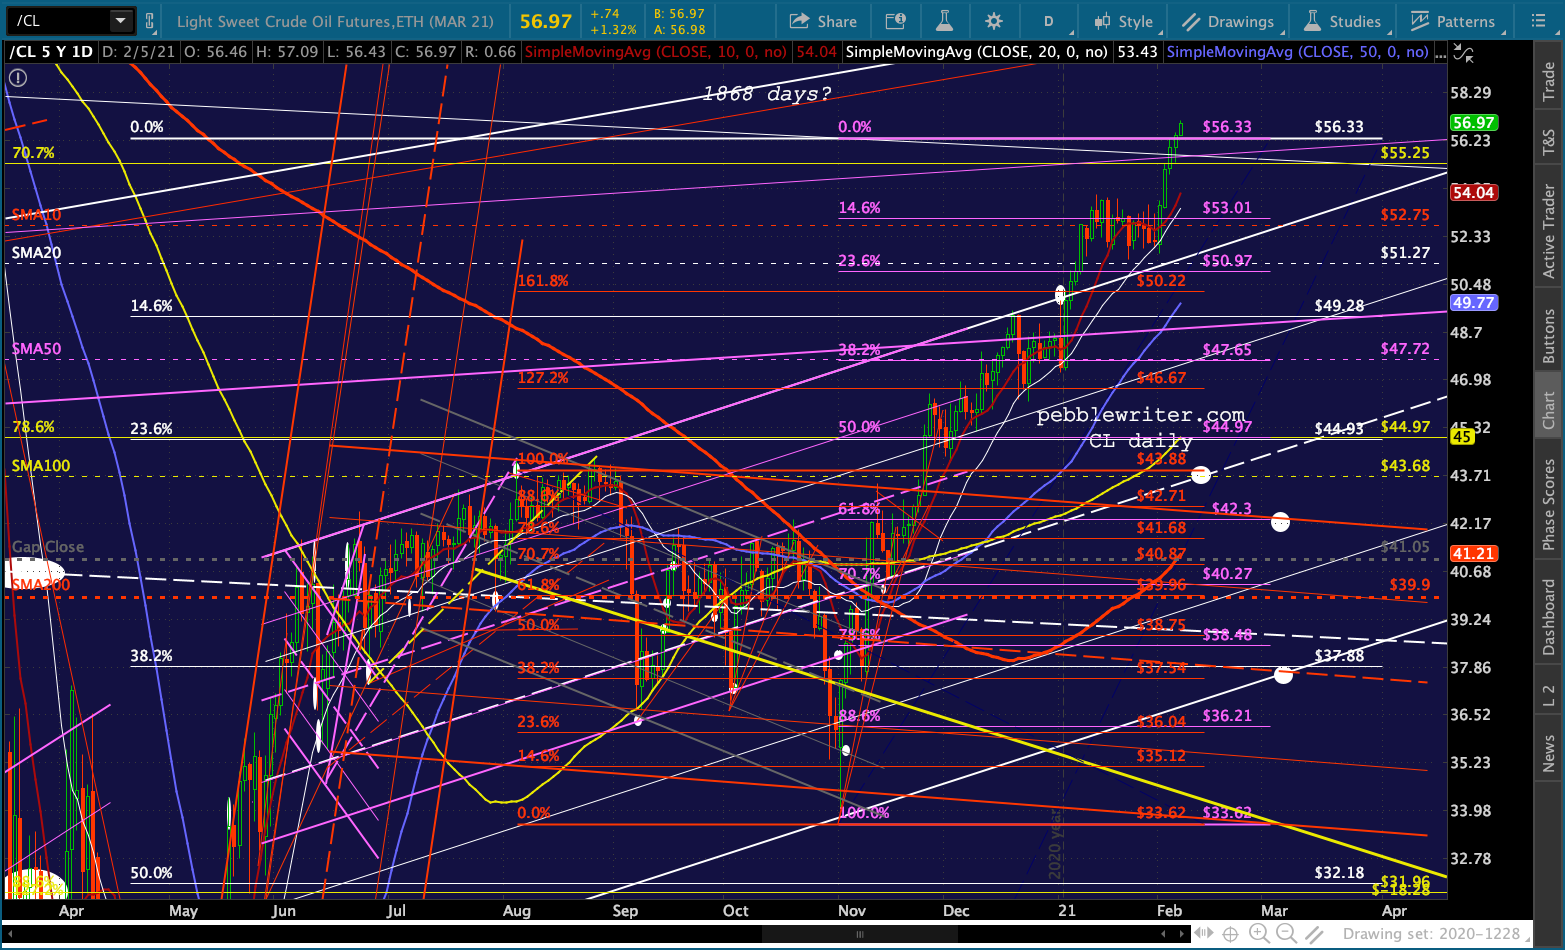
 It goes without saying that they have pushed higher than I ever though they would. We really are at the point where the inflation genie has to be put back in his bottle. For those holding short in CL and especially RB, we are now at critical resistance.
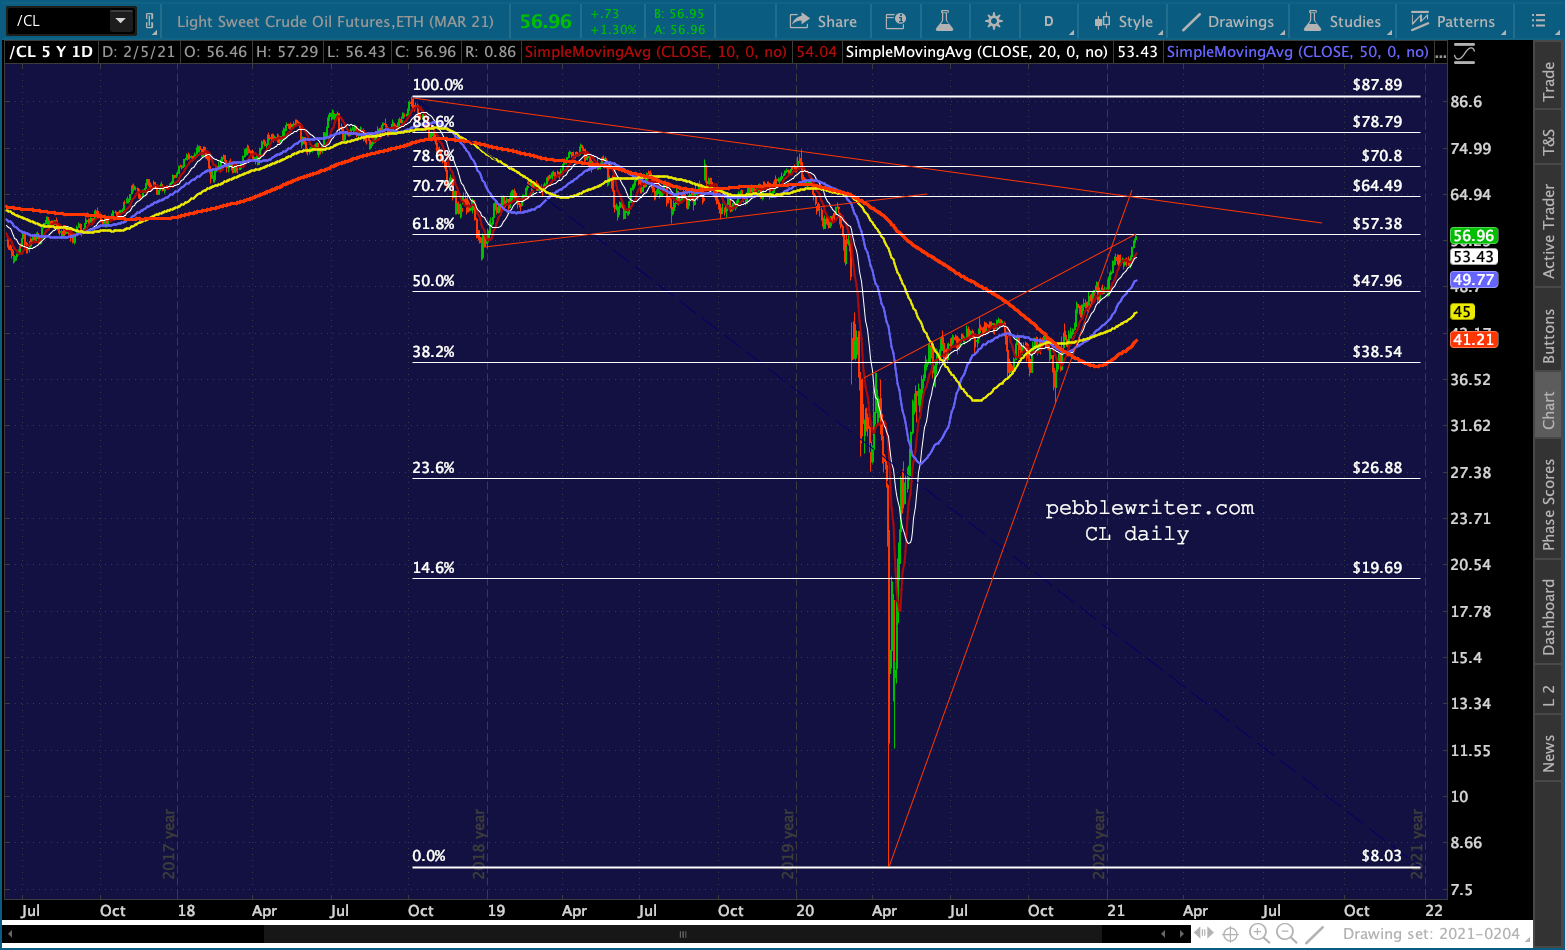
Perhaps it’s significant that RSP didn’t make a new high on the open. In fact, don’t be surprised if stocks end the day lower. This morning’s maneuver is less about pushing to new highs than it is preventing an uncontrolled meltdown precipitated by a bearish pattern.
I continue to believe the Fed would be quite pleased with a gently rising trend that oscillates just enough to not be too obvious that stocks are being manipulated. In other words, something quite different from what ES did between 7:30 last night and 9:30 this morning.
 UPDATE: 3:45 PM
I’ve charting like a madman all day, and have come up with some interesting conclusions. Bottom line, I think VIX might be on its own going forward in terms of propping up the market. On Monday, ES should see a bearish 10/20 cross – which could signal a downturn. In another couple of months, its SMA200 should be up to 3461.68 or wherever the .618 of the rise from 3198 happens to be at that time.
Also in March-April, I believe CL and RB will be substantially lower so the Fed doesn’t have to hope people won’t wig out about 2%+ CPI. A 25-40% decline in CL/RB would presumably do a number on stocks, so USDJPY could push through its SMA200 in order to compensate. It won’t be that big a deal if CL/RB are declining at the time – especially if VIX is still breaking down.
At least some of the oil/gas charts suggest a reversal starting today. On a contract adjusted basis, CL has retraced .618 of its losses from the Oct 2018 highs.  Not adjusted, it has run into a clear TL from those highs.
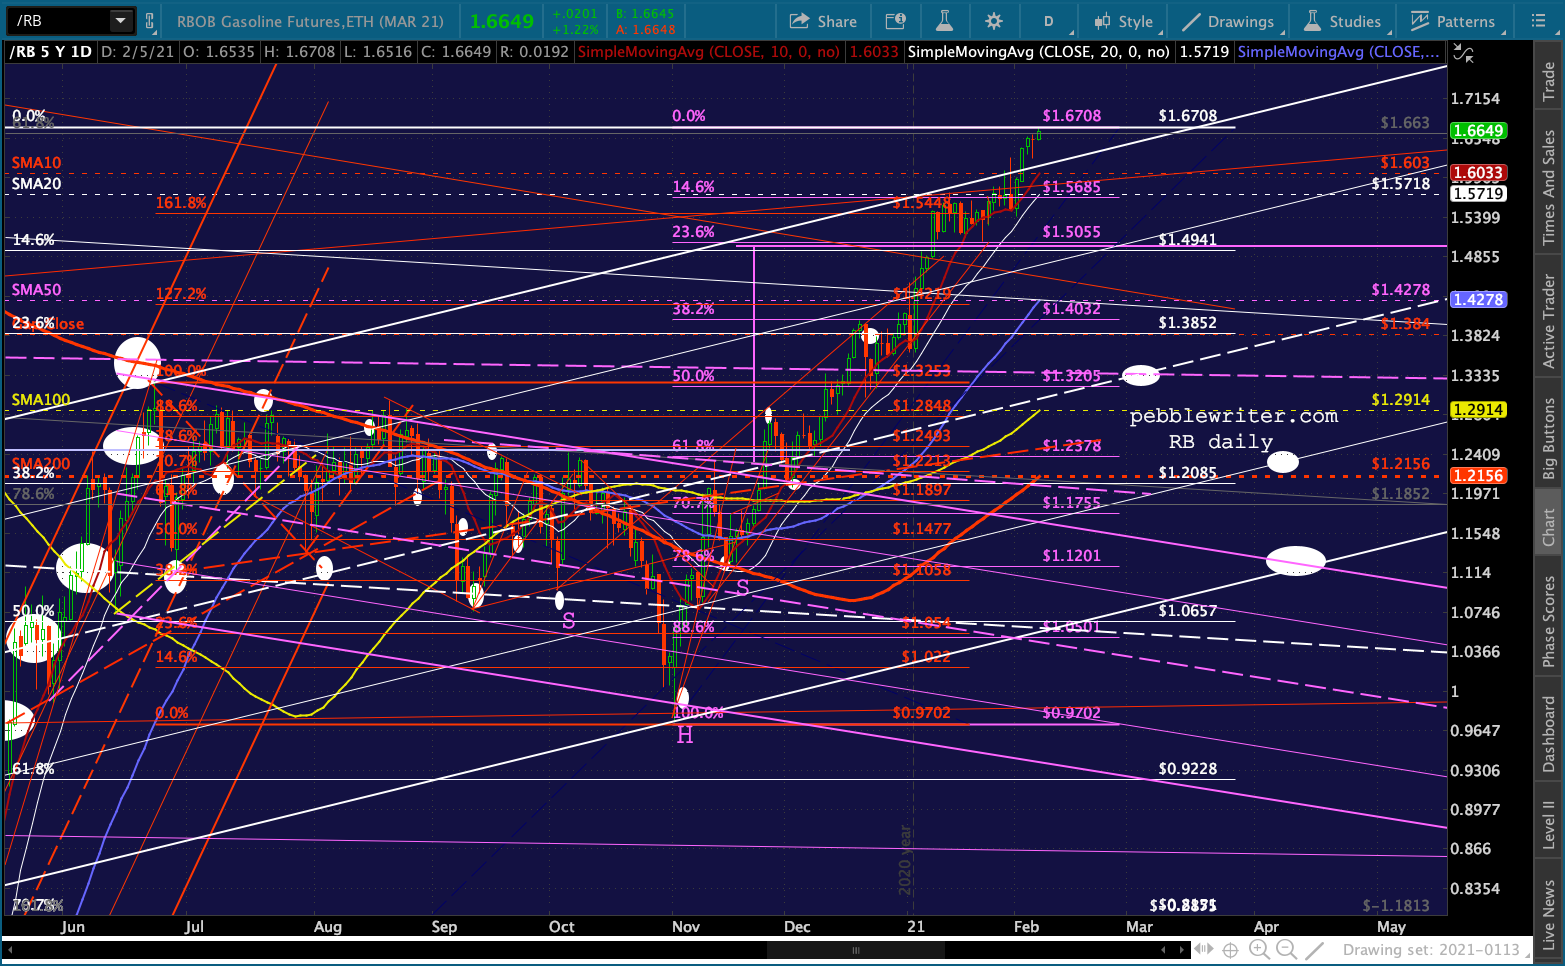
 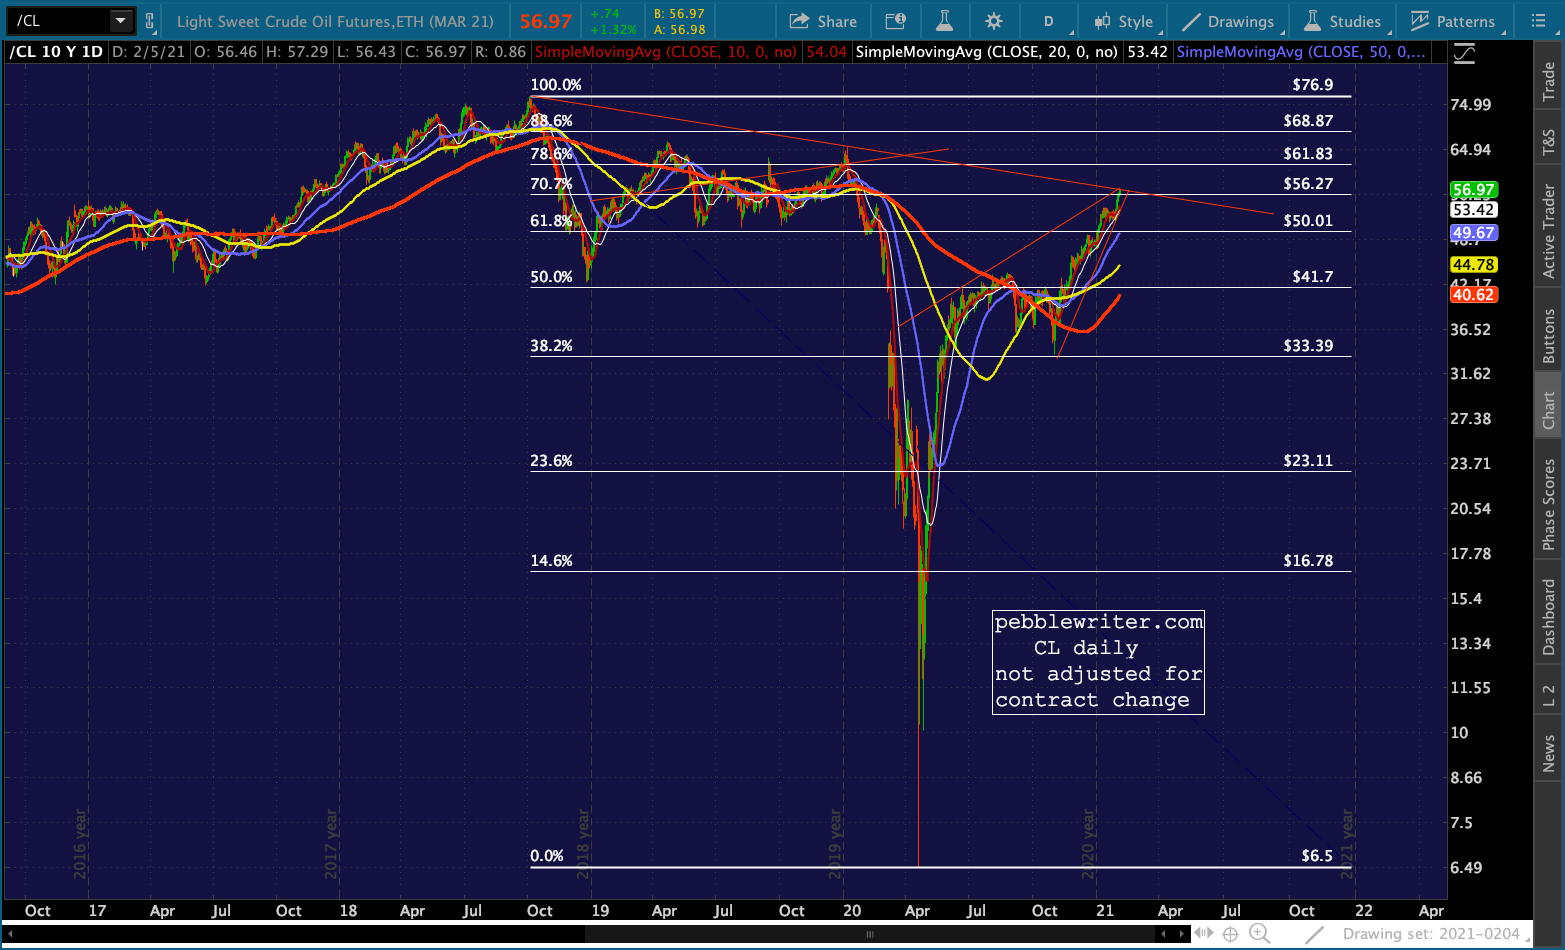 RB has either run into its .707 – potentially not that important…
 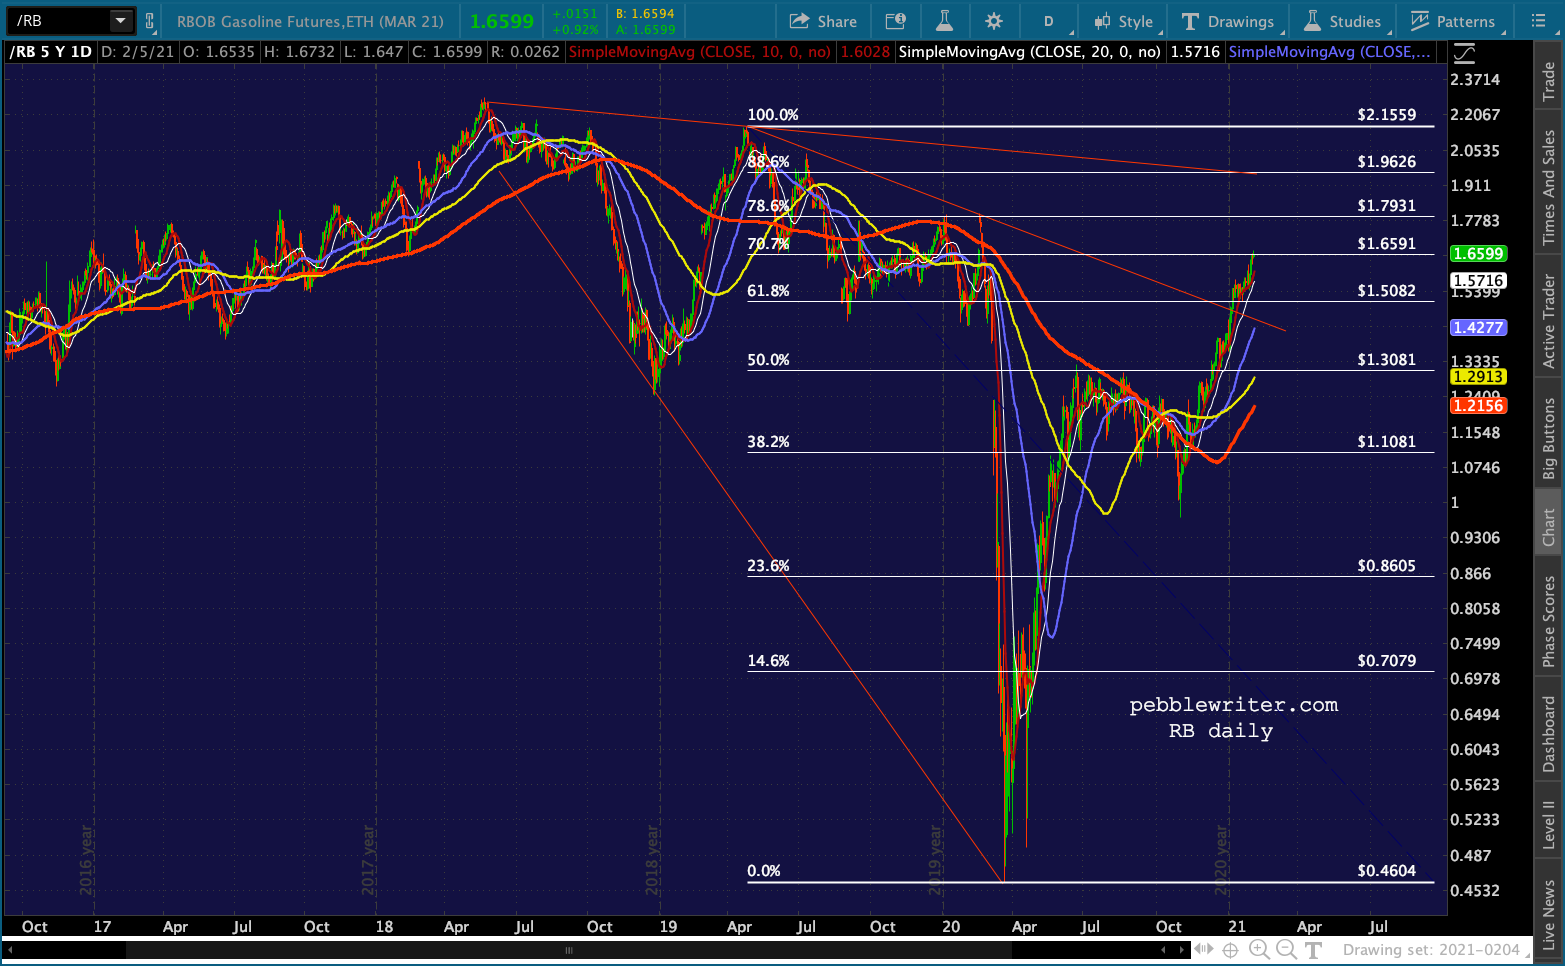 or has run into its .786 and the top of a falling channel.
  Everybody looks at these futures charts differently. But, regardless of what the chart says, we still have the inflation problem.
The Mar 23 lows in RB will be one year old in 6 1/2 weeks. Can stocks maintain their meltup in the face of a meltdown in oil/gas prices?