

The biggest charting development overnight was VIX’s resurrection. Breaking down below its channel bottom dating back to Nov 27 drove stocks to new highs. Will rising back above it bring stocks back down to earth?
 continued for members…
The bearish (bullish for stocks) 10/20 cross persists, so it’s too early to say for sure. But, it did result in a decent backtest of the former highs for ES. Given that ES dropped through (at least temporarily) the former high, we have to start thinking about the white channel and the red TL intersecting with it at 3797. The currencies generally endorse the idea of lower lows – unless USDJPY breaks out. It’s still a wild card, not committing either way as it backtests the SMA50 for the 40th time since last July.
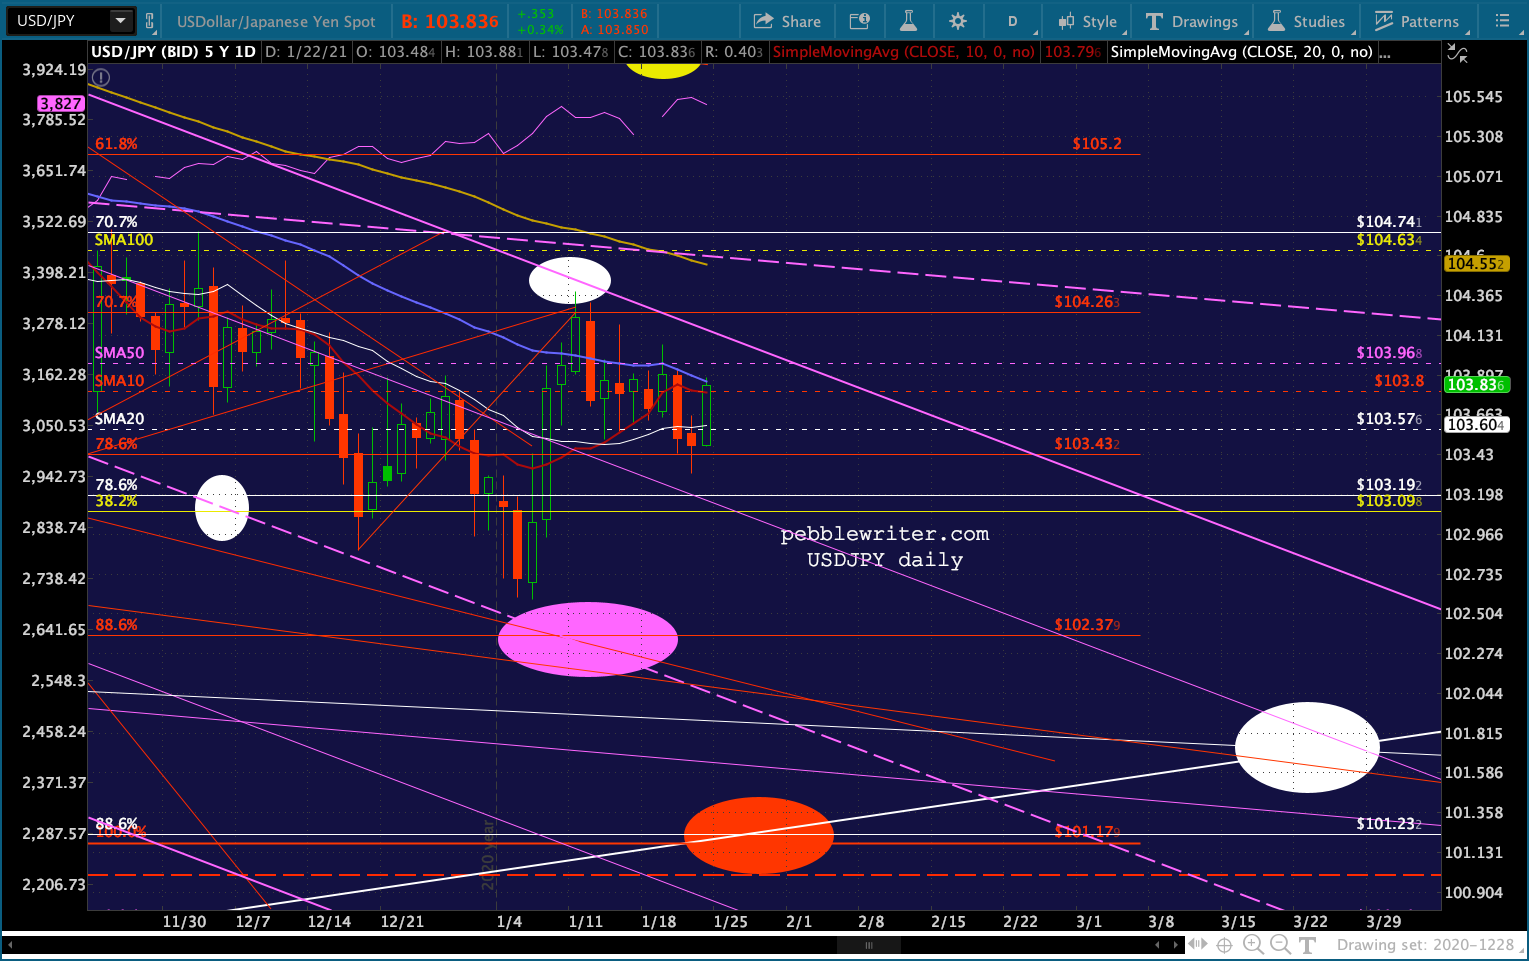

 While GC and SI continue to be constrained by their falling channels. Note that GC is stuck in its cloud – in limbo, but still clinging to its SMA200.
 SI’s SMA200 is almost to the white channel midline – my best guess as to the soonest it could take a sharp plunge if it continues to fail to break out.
 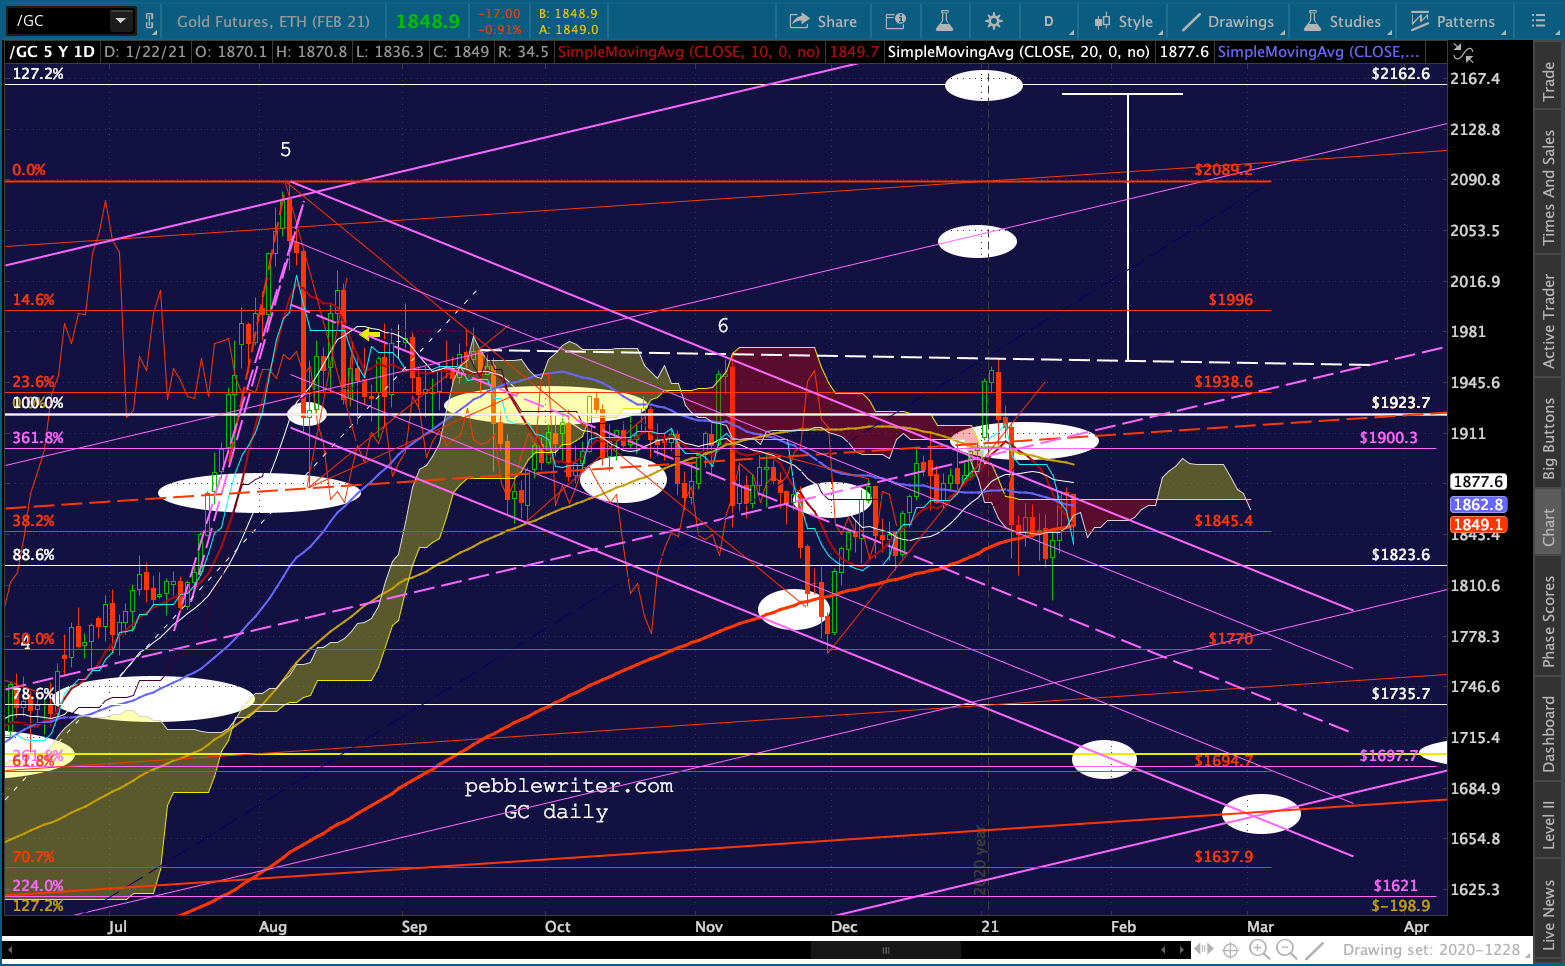 As expected, oil and gas are still faltering. Although it’s still early stages, both have dropped below their SMA10s.
 And, the 10Y remains stuck in a very narrow range – leaving ZN and, as mentioned above, GC in limbo.

 After breaking out of its triangle yesterday…
 …AMZN changed its mind. This is very interesting, as a failure to break out after reaching its channel top suggests the pattern could yield a breakdown…
 …with the initial target being the SMA200 but lots of potential downside if that didn’t hold.
 Aside from the fact that AMZN is taking over the world, there’s a good argument for a significant decline after that channel top tag.
 The bigger picture for the market suggests a number of outcomes going forward. I’ve indicated what I believe are the stronger ones in the chart below.
 I assume that if VIX is able to remain broken down and plumb lower lows, SPX can get up to the 3.618 Fib at 3956.64. But, it would need to happen very soon in order to tag the intersection with the white channel top. If it kept inching higher, the next significant target is the white 1.618 at 4136.15 around June 30, 2021.
 To the downside, we have yet to see an actual backtest of the 1.272 at 3720.37 – ideally in the next session or two as the SMA50 arrives at that level.
And, if that broke down, then we could look for another test of the SMA100 currently at 3548 or even the Feb 2020 highs as the SMA200 arrives in early Feb.
UPDATE: 7:50 PM
Not a very enlightening close… Sure, ES dipped at the end, but also closed above the red TL it worked to hard to climb back on top of. VIX recovered during the day, but only to backtest the white channel bottom.

 For those watching BTC, I had an interesting question from member Tim about the correlation between BTC and SPX – noting that BTC often led SPX. This is indeed true, with a few notable exceptions.
The one that might have tripped up most people came in June 2019, when BTC fell 53% over the next six months while SPX dropped only 7% before climbing another 20% to its Feb 2020 highs – at which point both plunged in sync.
 With BTC having dropped 31% (so far) this week, we have to wonder if it has signaled a coming drop in SPX.
Have a great weekend everyone.
Comments
One response to “VIX: Back from the Dead”
Really appreciate the BTC correlation chart! Just a few more observations which may or may not be helpful: I’ve mentioned a few months ago that I was waiting to see if /QM would hit the top of the declining trendline back from 2008. Currently, it sits around the 59.00 level. Since, 2008, the upper trendline on /QM was touched four different times. XLE has a gap at 53 from the Feb 2020 sell-off that I think will be filled…another reason for /QM to hit the 59 target. XLF finally filled the gap from Feb 17, 2020 the other week, so I would imagine XLE is next?