

The great thing about channels is that they tell you quite precisely when a trend change has occurred. The falling white channel seen on ES was tested just prior to the open yesterday. A simple smackdown on VIX and it was off to the races.
As we noted at the time, ES’ 10-DMA had dropped to the level of its 20-DMA. Despite a huge ramp job, a bearish cross has indeed occurred.
On the other hand, we have both an FOMC meeting and OPEX this week. On top of the bullish channel breakout, these events seldom fail to produce a rally.
Which will prevail?
 continued for members…Note that VIX has reached the lowest point to which it can sink before a breakdown must be officially recognized. It is still in a bullish 10/20 cross which is bearish for stocks.
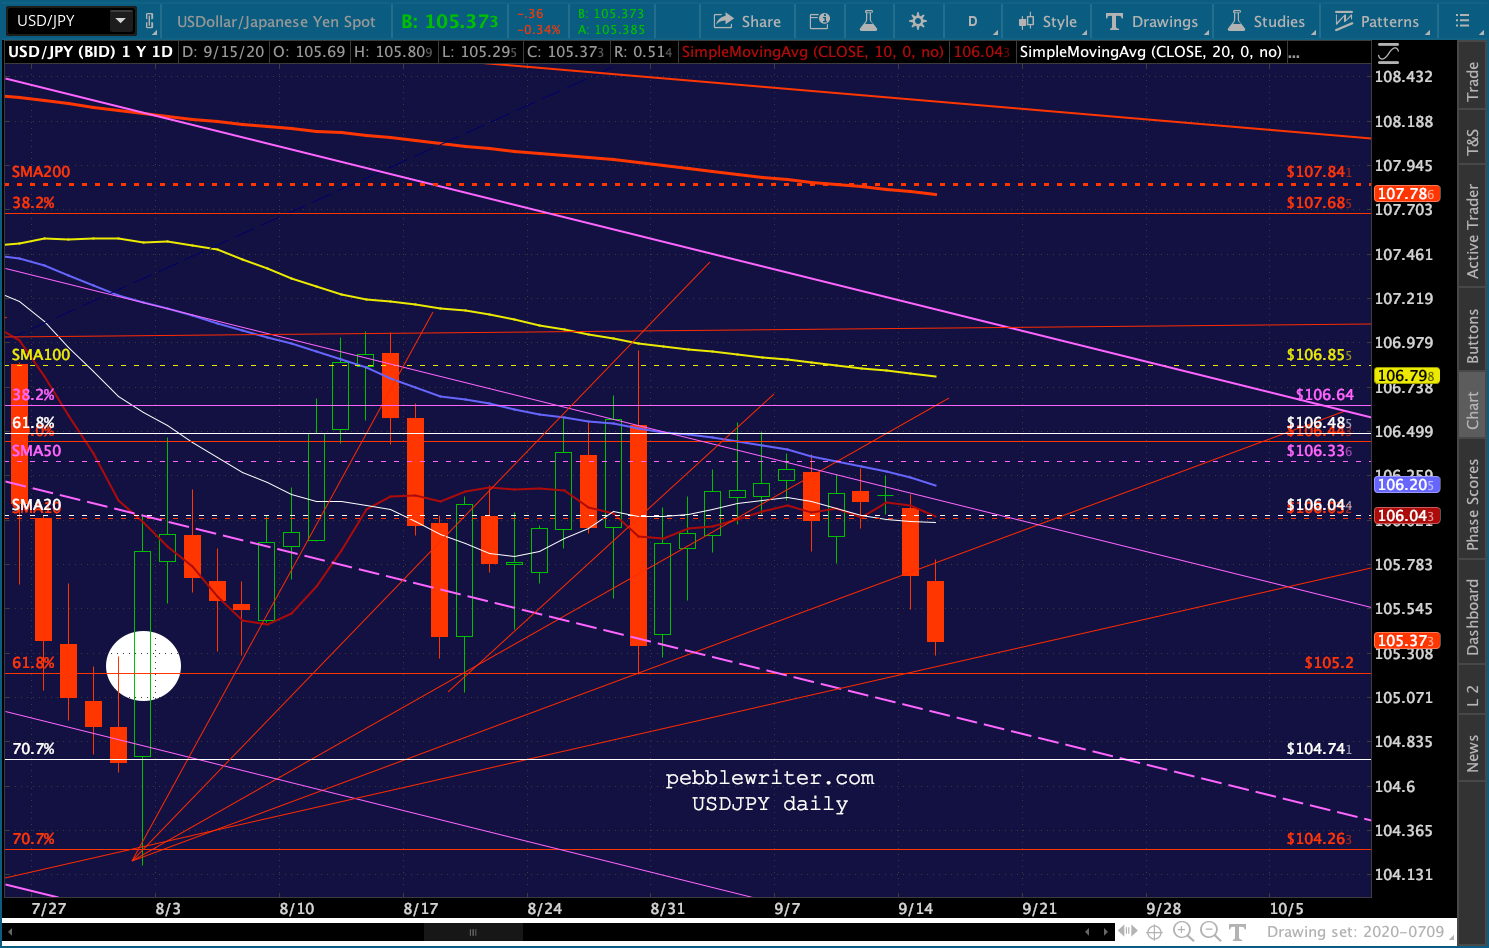
 Note also that USDJPY has broken down through the latest little red fan line and will get another shot at a bearish 10/20 cross today.
 And though CL got a nice bounce off the little red TL shown below, it has given up most of those gains, helped no doubt by a bearish IEA forecast. Countering that report is the prospect of shutdowns in the gulf in response to Hurricane Sally. The IEA expects global oil demand to contract in Q4 by 5 million bpd, 600K more than forecast last month.
The YoY decline should amount to 8.4 million bpd. Even OPEC, which will meet this week, is sending bearish demand signals.
 One of the more perplexing problems facing us in the currency markets is the DXY. The EURUSD has been going sideways since late July…
 …alternating between threats to break out of the falling red channel dating back to 2008 and threats to break down from the rising white channel from this past April.
  It seems to me that the rising white channel will break down first – which would not be positive for stocks. Note that previous breakdowns were generally accompanied by significant corrections.
  The closeup below shows the effects during the periods of Jan-Apr 2018 and Sep-Dec 2018.
 This year, however, we saw a sharp spike (weaker USD) in EURUSD as stocks crashed. It quickly reversed (stronger dollar) and followed stocks down, but the dislocation was shocking.
  The upshot is that the “sudden” realization that the US wouldn’t not be spared the effects of COVID-19 was bearish for both the USD and US stocks. As stocks plunged, however, the USD acted as a safe haven.
The DXY chart, which takes into account the relationship with the yen and other currencies, shows a similar pattern. DXY’s initial breakout of the falling white channel on Feb 6 was initially positive for US stocks. But, it was a temporary benefit. Both topped on Feb 19-20 and began a sharp decline.
On Mar 9, DXY reversed course and soared higher until stocks finally bottomed on Mar 23. Since then, it’s been all downhill – a deescalation of the fear trade as well as a shunning of US stocks due to the country’s poor response to the pandemic. Stocks have continued higher, but only because of the overperformance of a handful of pandemic beneficiaries such as AAPL, MSFT, FB, GOOGL, etc. With the positive relationship between EURUSD and SPX reestablished, the next step in EURUSD’s path looms large.
UPDATE: 3:25 PM
Not a whole lot to report except that ES’ little rising wedge has broken down and VIX hasn’t yet. I have a conference call coming up at 3:30, so will catch up after the close.

