It’s that time again. Rising volatility, inflation and interest rates have left investors nervous and markets unsettled. We’ll take a look back at how stocks got here, and a look ahead at where they’re going.
Following the GFC, central bankers used QE to provide liquidity and drive interest rates lower. It was an effective tool, but expensive and somewhat clumsy. And, no one seemed very sure about the eventual effects that a dramatic increase in money supply and debt would have on inflation.
Rating agencies weren’t thrilled, and downgraded US debt in August 2011. SPX broke down, closely following the same path it had followed in 2007-2008 – an analog I initially presented in May [see: Analogs.]

SPX broke out of the analog with the help of the yen carry trade — limiting the correction to only 22% and reinforcing the placement of the rising purple channel below.
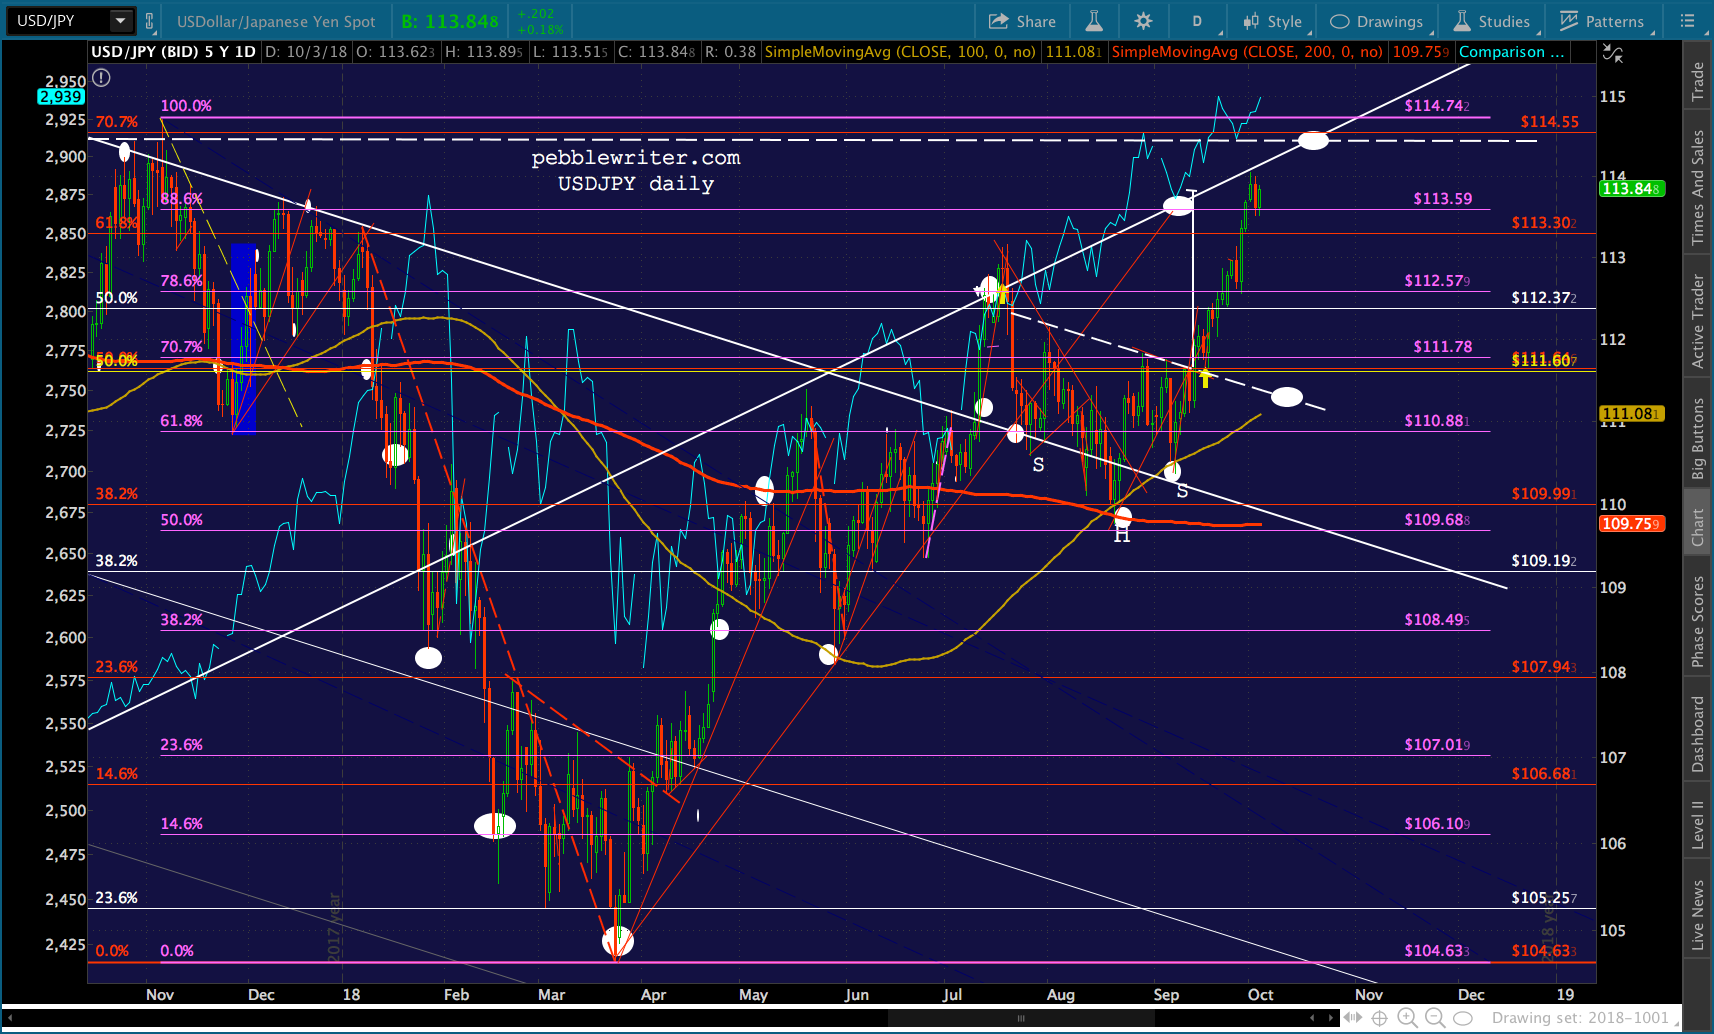
 The yen carry trade involves the depreciation of the yen relative to the US dollar, which equates to a rise in the USDJPY (the number of yen per US dollar.)

USDJPY had dropped 49% since 1998. It was poised to drop much further in mid-2011 — a result of the flight to safety in the wake of the Fukushima disaster. As stocks were sinking in 2011, however, the Bank of Japan greatly expanded its own QE program. This provided enormous liquidity to markets, depressed already low interest rates, and ushered in a dramatic decline in the value of the yen (increase in USDJPY.)

When SPX reached 1823, the culmination of a Butterfly Pattern (a reversal pattern in Harmonics), USDJPY broke out of the falling channel it had been in since 1998 and spiked up over its important .618 Fib level at 120.11.
This period, highlighted above as Rectangle 1, enabled SPX to overcome the resistance at 1823 and treat it, instead, as support. In fact, SPX backtested 1823 a total of five times over the next two years — never managing to break out.
The reason? USDJPY had run out of upside. An ever-depreciating yen is great for Japanese exporters. Toyotas and Hondas are cheaper, for instance, to US buyers. But, it presented problems to the rest of Japan’s economy, which — in the wake of Fukushima — had shut down its nuclear power plants and relied upon imported oil for nearly all of its energy needs.
Because oil is priced in US dollars, the ongoing rally in oil prices hit the Japanese particularly hard. Oil in yen had nearly tripled by Jun 2014. This increase in oil prices, due largely to depreciation in the yen, drove inflation from below 0% to an alarming 3.7%. Needless to say, it was hard to justify 10-yr rates of only 1.2% with nearly 4% inflation. Inflation had to come down…which meant oil needed to crash.
 The silver lining was that USDJPY was able to rise even further. In fact, USDJPY broke out [Rectangle 1 above] on the exact same day that CL (crude light, or WTI futures) broke down.
Once it became apparent that USDJPY had run out of upside, another tool was needed to keep stocks afloat. As the inflation chart above illustrates, the drop in oil prices had been a little too effective. Japanese inflation had transitioned back to deflation. US inflation was also flirting with 0%.

Not only that, but debt to oil and gas exploration and production companies had ballooned even as the underlying assets depreciated [BIS Report.] Banks’ exposure to the industry was making headlines. It was time for oil prices to recover.
On Feb 11, 2016 — the same day that SPX tested 1823 for the fifth and final time — CL bottomed out. It enabled us to call an end to the 2015-2016 correction [see: USDJPY Finally Relents] which had begun when SPX first tagged its 1.618 Fib level in May 2015 [see: The Last Big Butterfly.]
But, SPX wasn’t out of the woods just yet. Brexit and the 2016 US election were just around the corner. Fortunately, the tools were pretty well understood by then. Despite plunging initially, USDJPY made a stunning recovery both times.
The danger was elevated at the time of the US election, however. SPX had been trending lower in the days leading up the election, dropping back below important Fib support (formerly resistance) at 2138 and threatening to drop below its 200-day moving average.
As it became increasingly apparent that Trump would prevail, futures started dropping. At one point, ES had dropped as much as 4.5% from its high the previous day.
It was then that a rather strange thing happened. VIX, which is a measure of risk and volatility in the markets, began to drop. Since investors buy VIX in order to protect against drops in equity prices, this was utter nonsense. It would be akin to calling your insurance agent to cancel your flood insurance as a hurricane is bearing down on your beachside bungalow.
It had happened a few months before when the Brexit vote also sent futures tumbling. By the time the cash market opened the day after the election, stocks were in the green, closing back above 2138.
At this point, it’s worth taking a look at VIX over the years. The yellow channel in the chart above has played a key role over the years. VIX tagged it once per year in 2014, 2015 and 2016.
Such plunges (the yellow arrows) were a signal that fear was quite low. In other words, the coast was clear. It was safe to buy. This, of course, was a contrarian signal. Repeatedly, the tags had marked complacency and market tops.
Everything changed after the US election. Rather than occasionally tagging the yellow channel bottom, VIX was suddenly plunging to it or beneath it on a regular basis. The rising yellow channel had yielded to a falling channel shown in white below. During the course of 2017, VIX would drop below the channel bottom about 3/4 of the time — a stark change from the previous once-per-year track record.
Combined with USDJPY spiking 18% over the next 30 days and CL spiking 80%, the regime change in VIX easily propelled SPX to the next important Fib level: 2703. Since topping out in January, SPX has tested its 200 DMA 16 times (after zero tags since the election) and has reacted at or crossed the 2703 Fib 24 times.
As in 2014, inflation is becoming an issue again. This time, the push above 2% has ratcheted interest rates higher. With the debt approaching $22 trillion and an annual deficit of about $1 trillion, higher interest rates are beginning to matter.
The Fed, determined to have a higher starting point from which to lower rates the next time the market needs saving, is seemingly impervious to criticism regarding the repercussions. And, why not? The narrative that inflation is under control is dubious unless oil and gas break down. If, as we expect, WTI drops another $10-22 [see: Oil & Gas Come Through Again], inflation would be under control. But, stocks would get clobbered. Think new 2018 lows.
This is as good a place as any to insert a disclosure. This article scratches the surface of the many, many factors driving stocks higher — and, occasionally lower. For instance, earnings matter — even if they’re inflated by stock buybacks and other gimmicks. Some of the market’s gains have been driven by positive economic developments. And, the Fed is unlikely to abandon its (usually) unspoken mandate to prop up stocks.
The problem, or at least one of the important ones, is that the market is now largely driven by machines. JP Morgan estimates that only 10% of trading is regular stock picking by fundamental, discretionary carbon-based investors.
This means that 90% of the trading is driven by algorithms, indexers, quasi-indexers, ETFs, HFTs and other passive and quantitative approaches. The upshot is that once a factor such as rising USDJPY or falling VIX is established and taken as gospel by the machines, it becomes easier and easier for stocks to be influenced without regard to fundamentals.
There is no time for real people to reflect on a news blurb and consider whether it’s bullish or bearish. By the time you or I have finished reading an article’s headline, machines have already made a decision and are placing trades. This opens the door to massive mispricing and outright manipulation.
What the Fed did, and I was part of that group, is we front-loaded a tremendous market rally starting in March 2009. It was the Fed…the European Central Bank, the Japanese Central Bank… all quantitative driven by central bank activity. That’s not the way markets should be working… they were juiced up by central banks, including the Federal Reserve… I think you have to acknowledge reality.
Richard Fisher, former FOMC member
This is not a condemnation of quantitative investing, which simply seeks to capitalize on observations. But, it’s important food for thought for anyone who places much stock in the veracity of economic data — especially since it emanates from those with an agenda.
Now, on to our forecast.
continued for members… (more…)


 While there are plenty of hints, the answer today should come from VIX — which will either bounce or break down below the purple trend line.
  Since I didn’t win the Mega Millions jackpot, I’ll have to contemplate whether RB and CL, which both tagged our next downside targets yesterday, have more in store.