

Futures are up about 5 points on this, the 31st anniversary of Black Monday. Ahh…memories.
Total losses since the recent Sep 21 highs hit 8% last week — about 5.8% from the simple sell signal we highlighted on Oct 9 [see: Investing for Dummies.]
Then…
 …and, now.
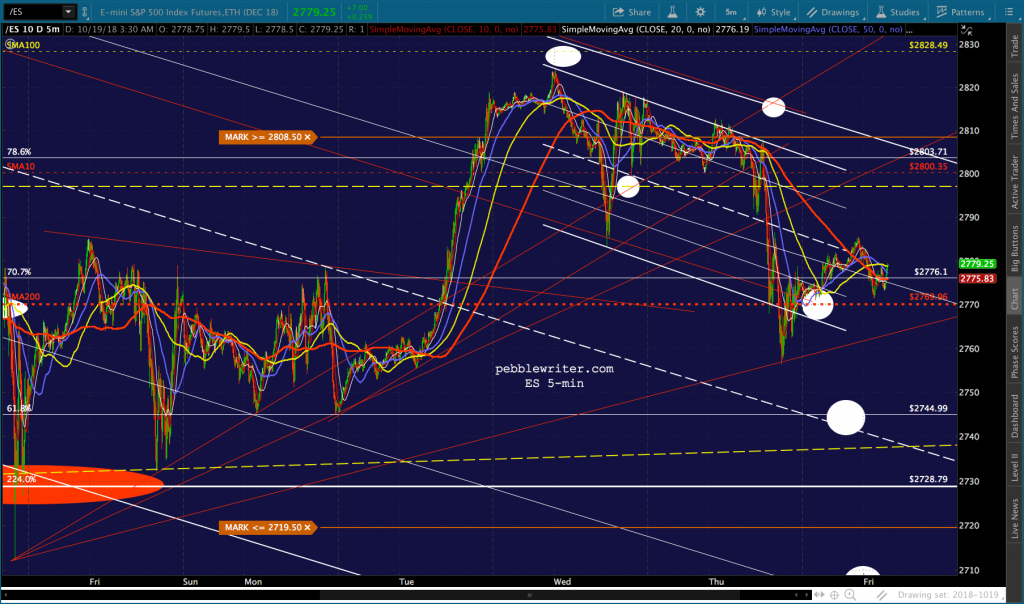
The bounce we saw on Oct 11 got ES back above its SMA200, but it remains to be seen whether it can hold.
Keep an eye on Existing Home Sales, due out at 10am. They’ve been on a steady decline since March.  And, rising interest rates are very unlikely to have helped in September.
continued for members…
Note prices have broken out of the falling white channel in place since early Sep — a good sign for our bottom call last week.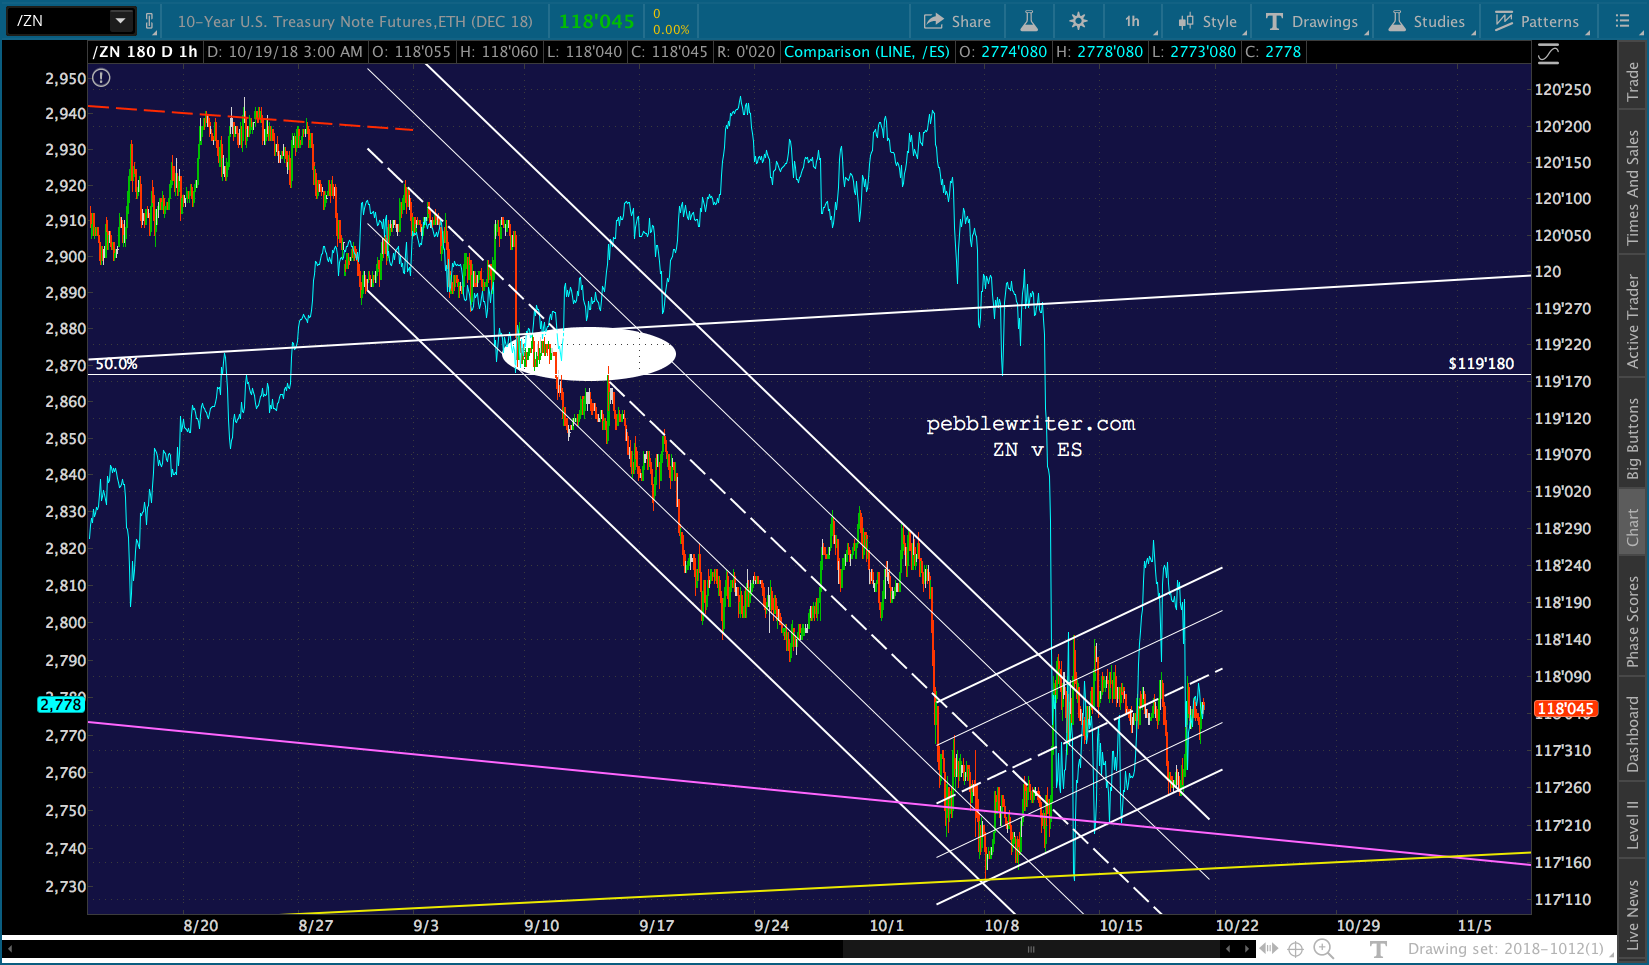 SPX closed barely above its SMA200 – a nominal sign of strength that doesn’t really mean all that much.

A reminder, ES 2705 is the equivalent of SPX 2703.62. But, there’s a .500 Fib at 2703.75 that ES might prefer over a reversal in the no-man’s land. As we discussed the other day, we could get the whole thing all at one, or see the decline dribbled out over the next two weeks leading up to election day.
And, of course, there are a few tricks the administration could pull out of the bag if they’d like to stop the bleeding right here and now.
It should be interesting to watch, as the Fed and the Treasury might have very different goals in mind, and very different tools with which to influence markets. There are also obviously non-US parties that have their own objectives.
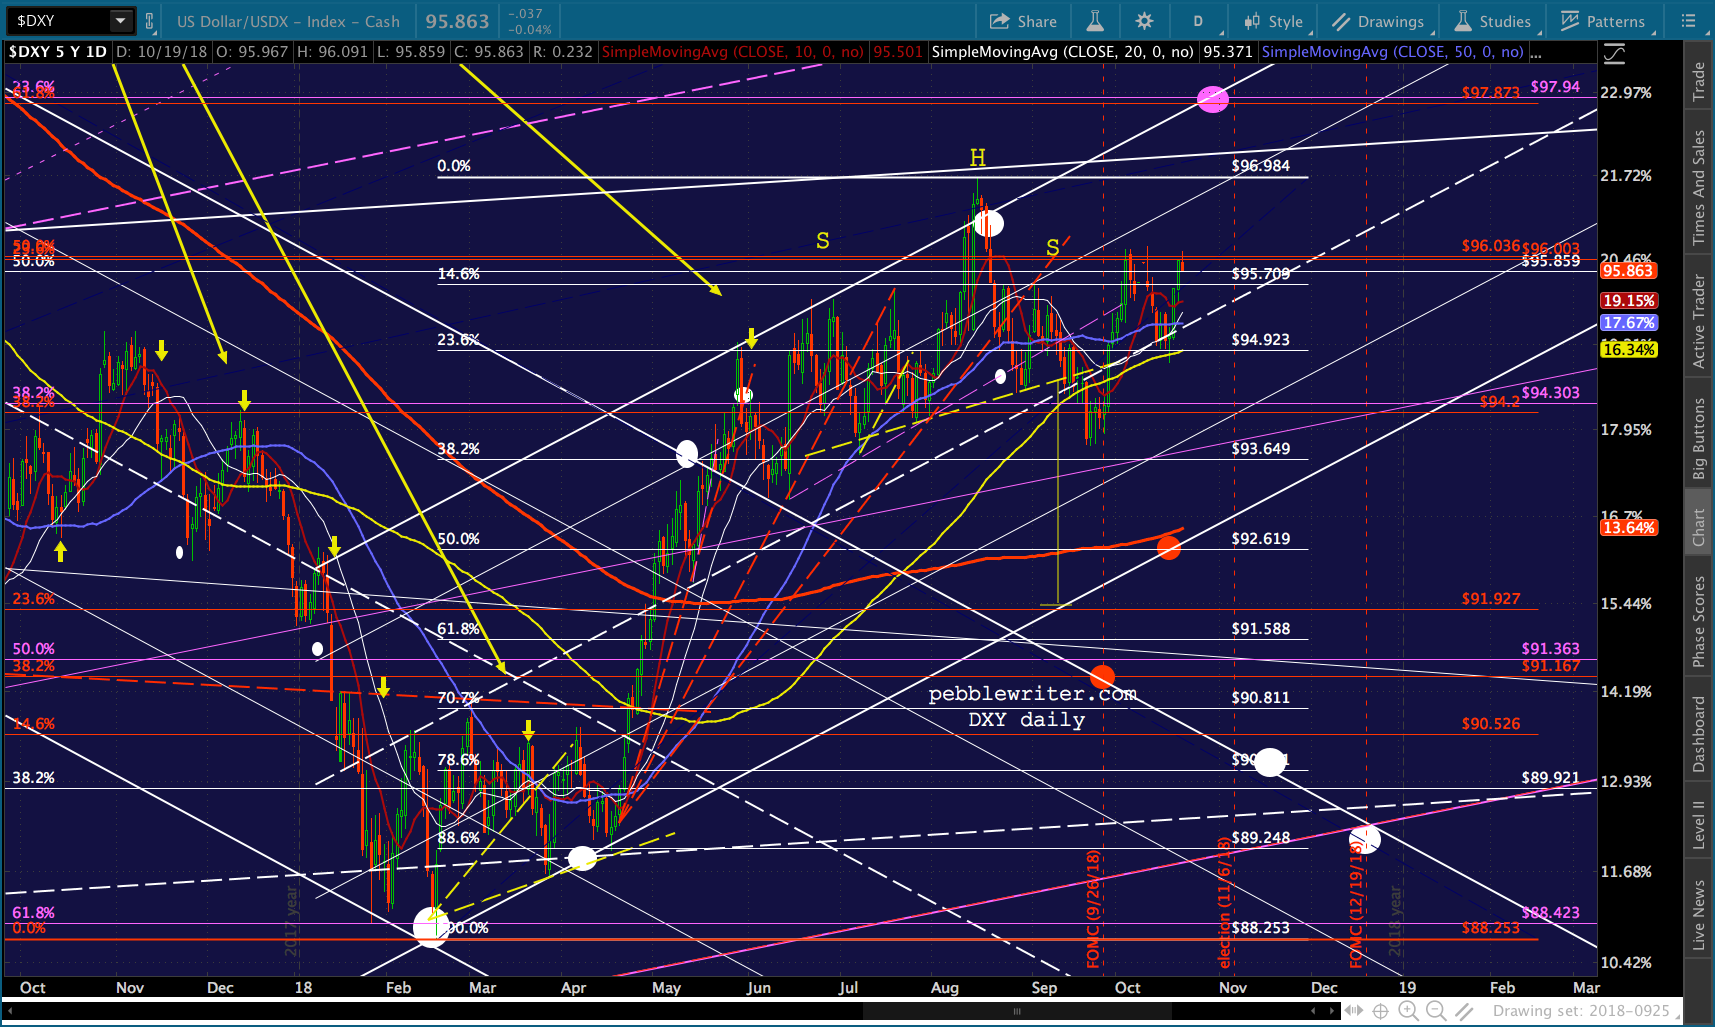
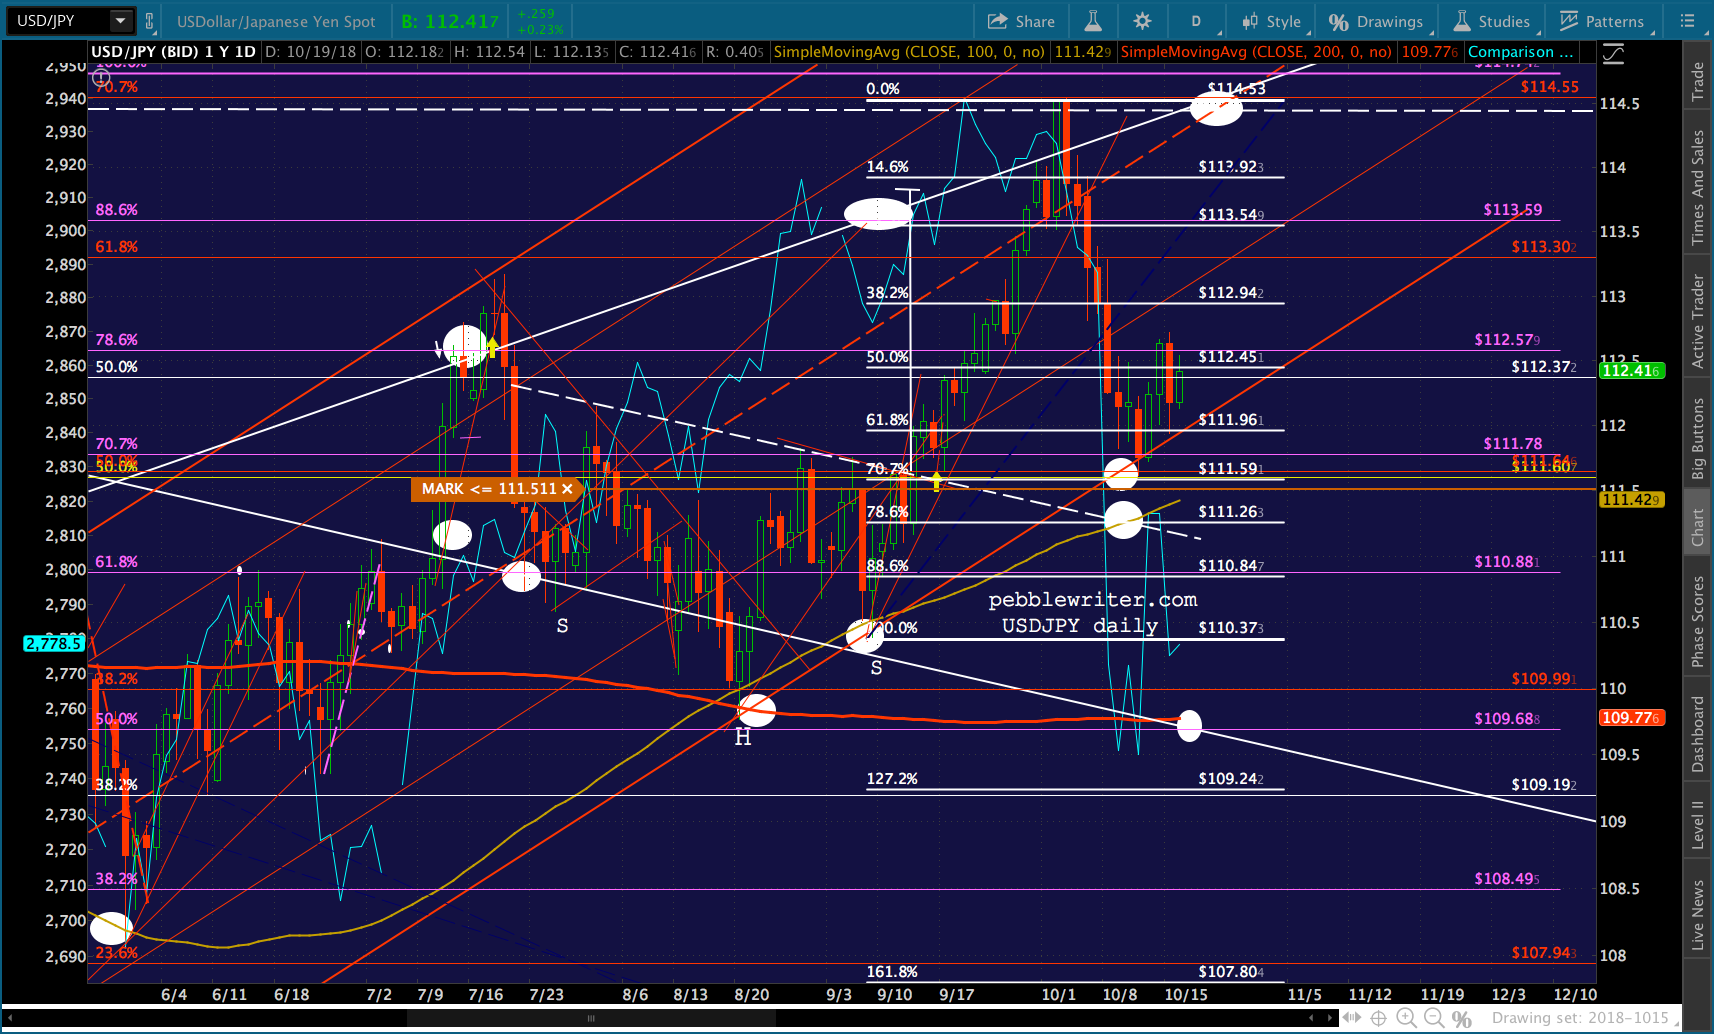
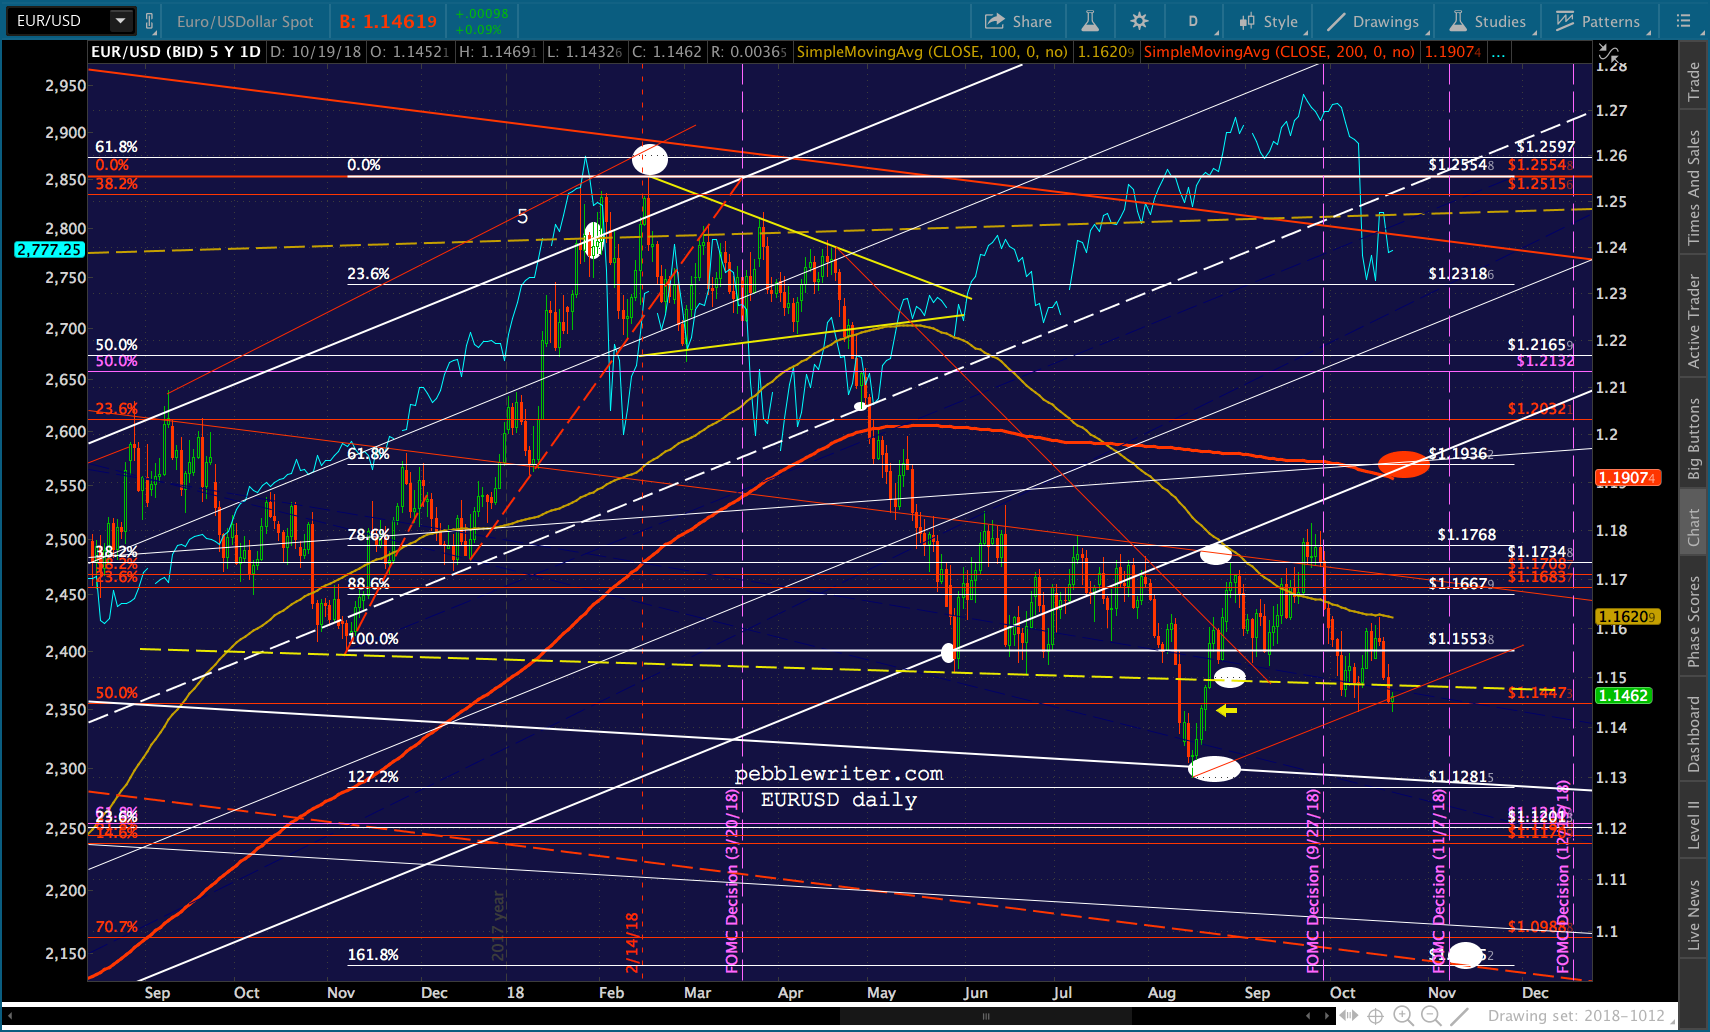
On that note…a quick look at currencies shows EURUSD teetering on a breakdown and USDJPY recovering a bit from yesterday’s selloff.
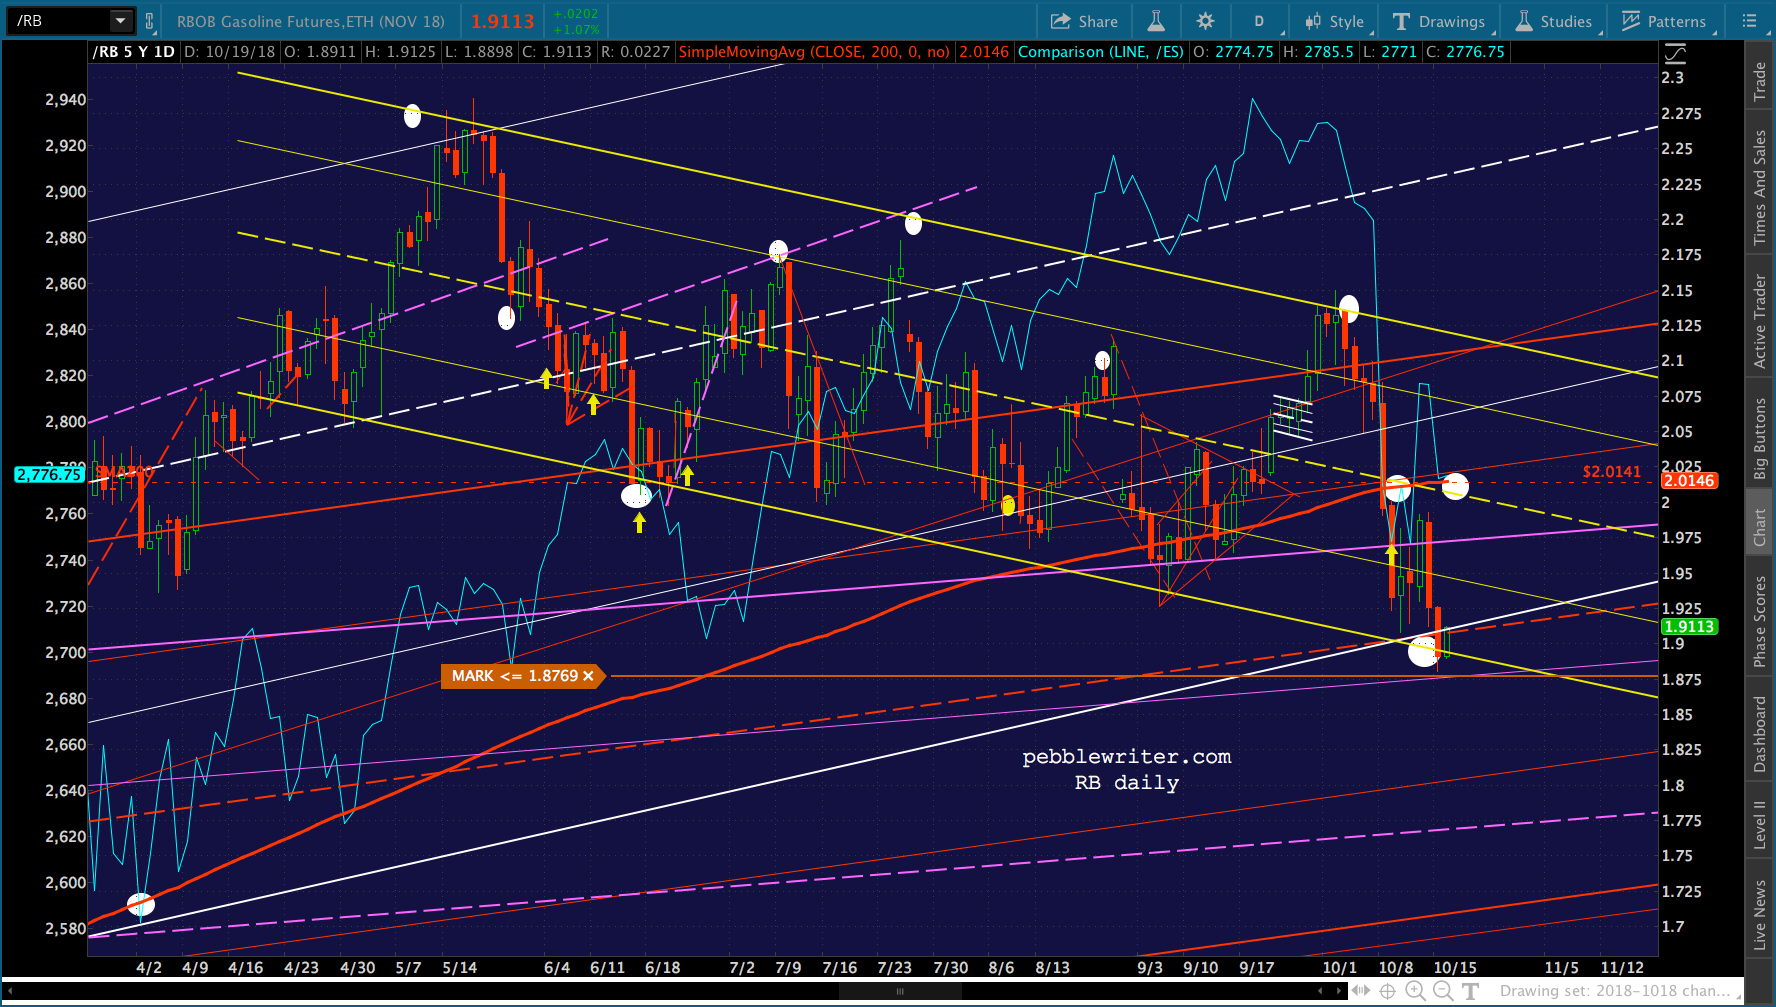
 RB and CL bounced where expected yesterday, but haven’t made much headway just yet. As we discussed, the bounce could be modest.
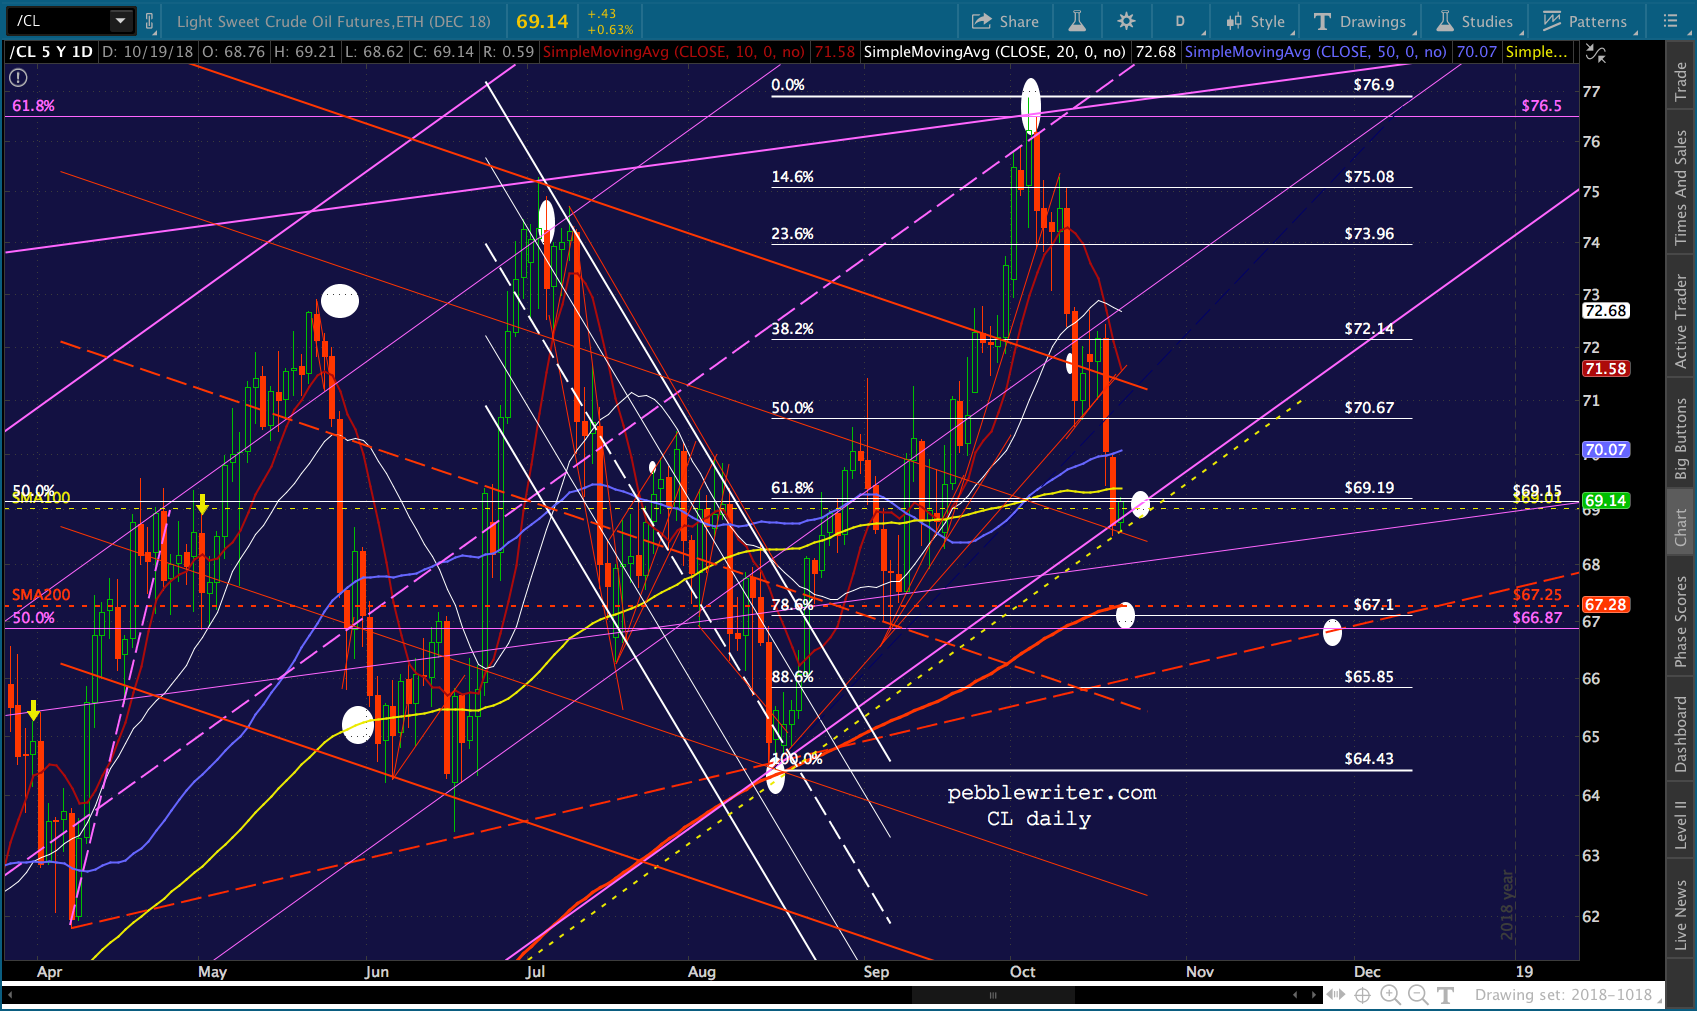
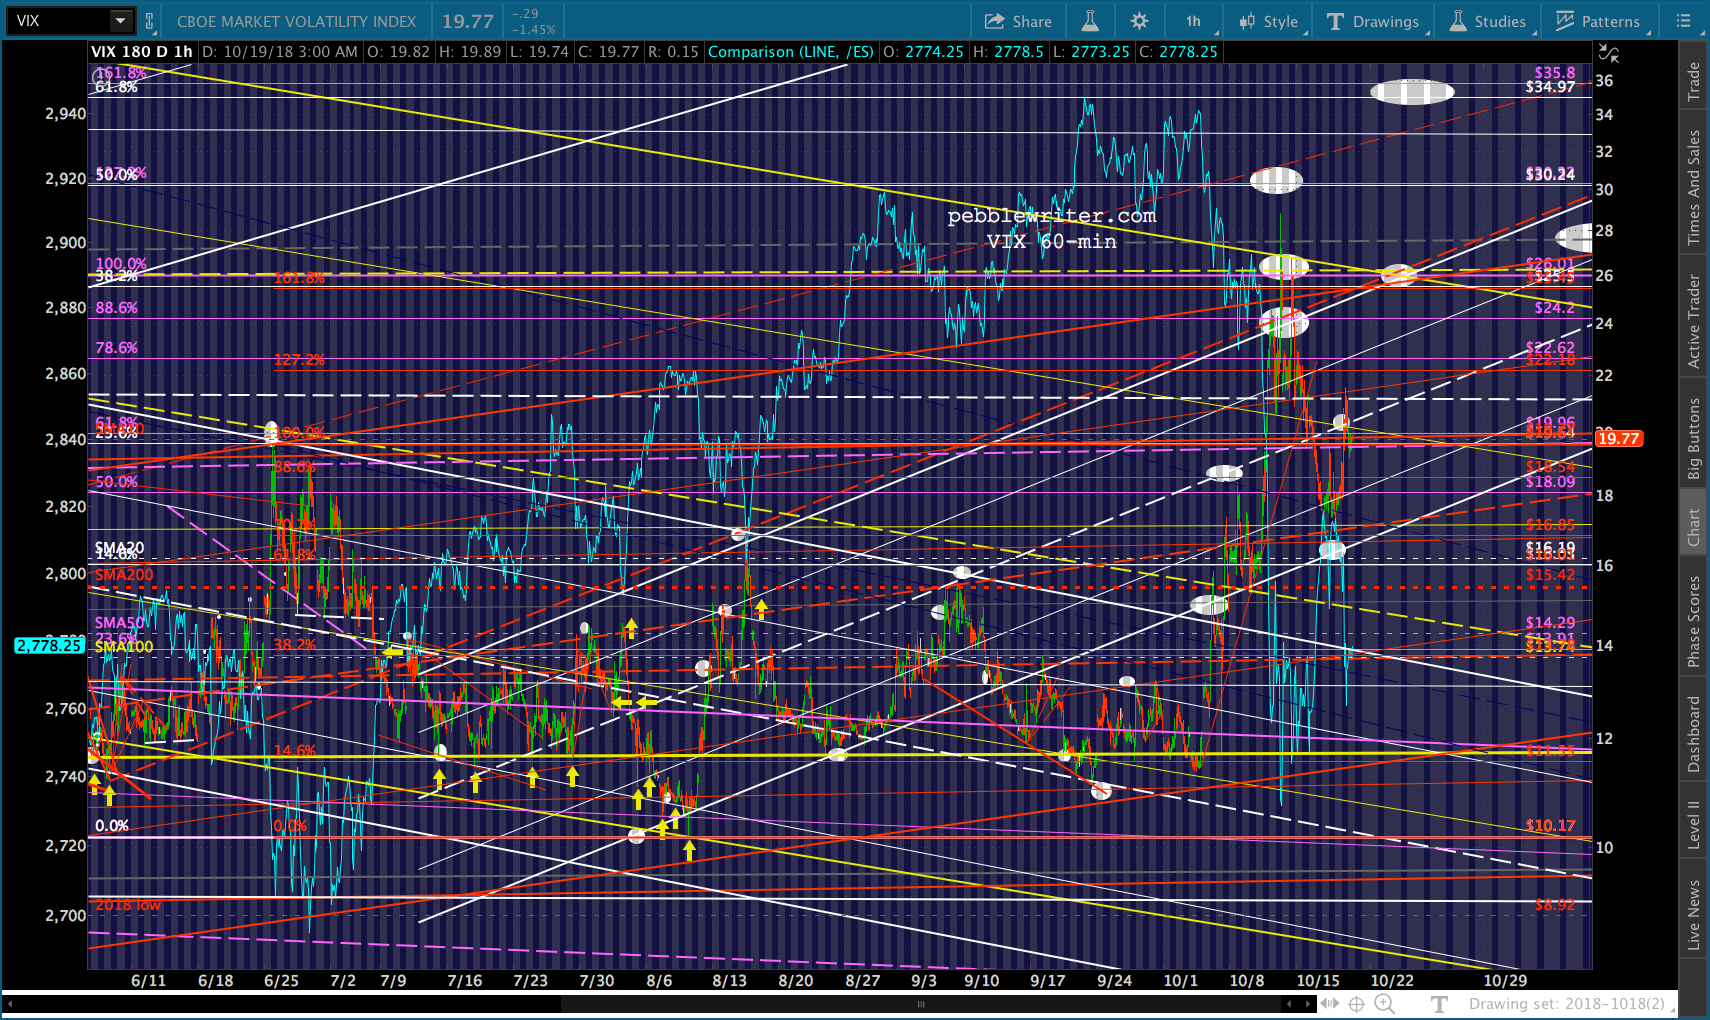
 VIX has plenty enough upside potential, not really needing to break to new highs in order to effect a 2.3% slide in SPX. I suspect 25-26 would probably do it, especially if USDJPY gets going to the downside.
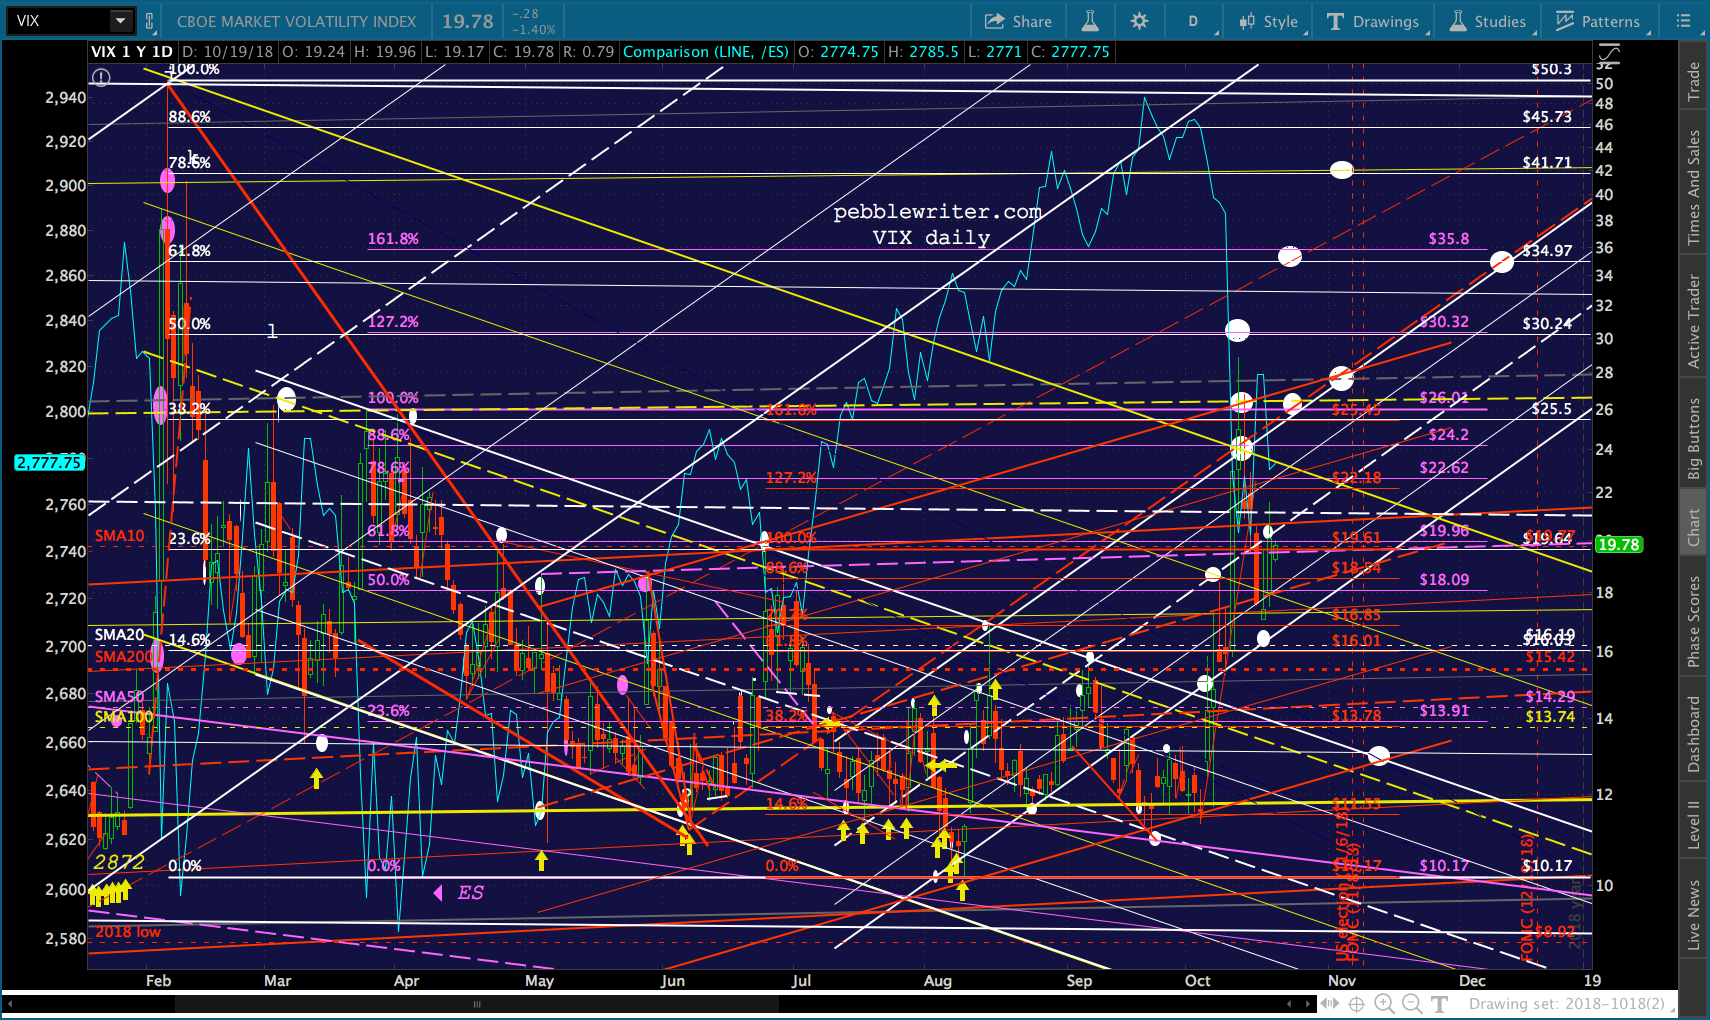
 I believe RB, CL, VIX and USDJPY will all swing into action if/when SPX reaches 2703. It’s a very important level of support for bulls which, if it fails, could mean a 25 handle again. The COMP chart is indicative, showing a 2.3% decline (such as awaits SPX) at 7315 and true support way down at 6750ish.
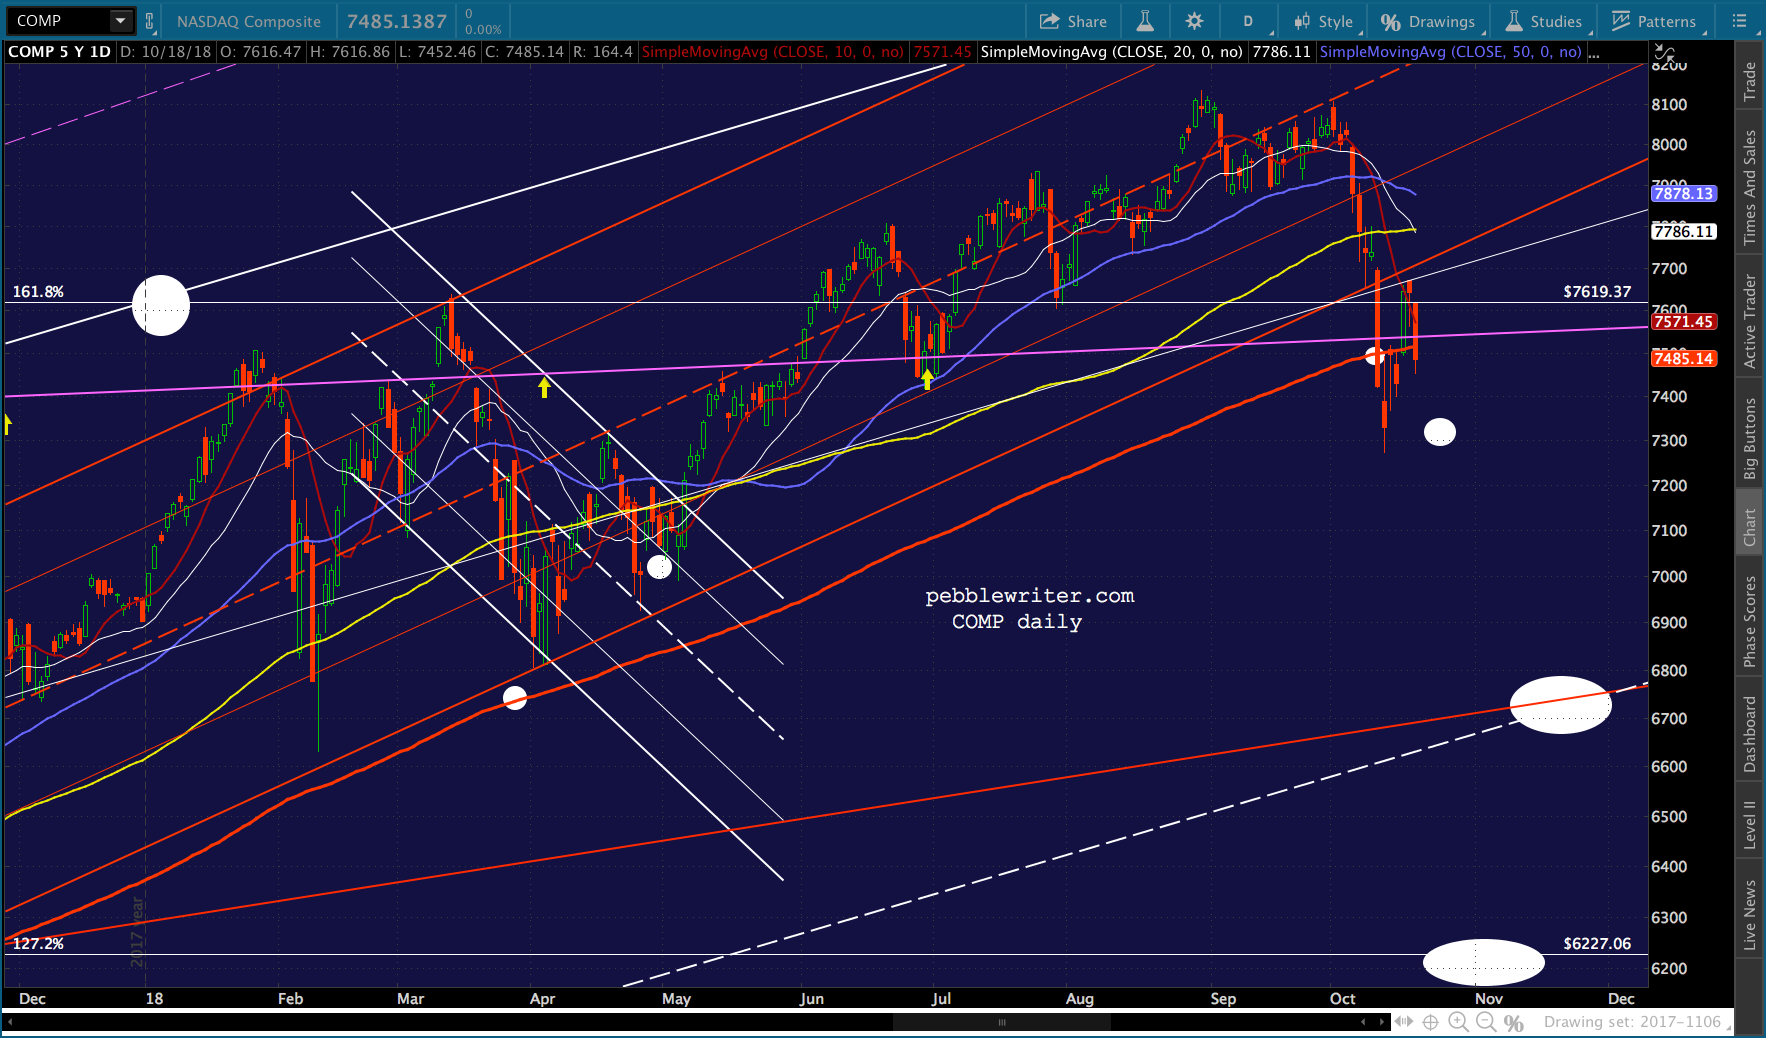
In other words…though TPTB are much more adept at propping up stocks than in 1987, it’s always a good idea to use stops.
I’m attending a seminar this morning, so won’t be able to post again until late this afternoon. GLTA.