

Most students of the markets are aware of the important relationships between oil and gasoline prices, inflation and interest rates. Understanding these relationships can provide useful insight into the economy and broader markets. Digging deeper into the trends, reversals and divergences, however, yields evidence that the relationships are nowhere near as random as the casual observer might assume.
* * *
The Federal Reserve’s dual mandate is well known: stable prices and maximum employment. Amended many times since first being enacted in 1913, it makes no mention of equities.
The Board of Governors of the Federal Reserve System and the Federal Open Market Committee shall maintain long run growth of the monetary and credit aggregates commensurate with the economy’s long run potential to increase production, so as to promote effectively the goals of maximum employment, stable prices, and moderate long-term interest rates.
12 U.S Code § 225a
Yet, many Fed insiders have openly acknowledged the activist role they have played in the years since the Great Financial Crisis.
What the Fed did, and I was part of that group, is we front-loaded a tremendous market rally starting in March 2009. It was the Fed…the European Central Bank, the Japanese Central Bank… all quantitative driven by central bank activity. That’s not the way markets should be working… they were juiced up by central banks, including the Federal Reserve… I think you have to acknowledge reality.
Richard Fisher, former FOMC member
Let that sink in for a moment. Then, consider that an increasingly large majority of equity trading is driven by passive and algorithm-based strategies which are often triggered by the Fed’s and other central banks’ decisions regarding foreign exchange, interest rates, inflation and the components thereof.
The implications are huge, and strike at the very essence of market integrity. From a practical standpoint, they also provide concrete guidance as to markets’ next moves.
Oil & Gas and Inflation
The Fed prefers to target inflation measures which exclude volatile energy prices. Nevertheless, CPI (which includes energy prices) remains extremely relevant due to its use in social security cost-of-living adjustments, wage calculations, etc. In spite of its many flaws and chronic understatement of actual inflation, CPI also exerts a great deal of influence on interest rates.
But, what determines CPI? According to the BLS, oil and gas (and other related energy) prices account for about 8%. However, they represent a significant portion of the cost of many other components such as transportation and food production. There’s a very strong correlation, then, between oil prices and CPI. [note: for charting purposes, we’ll focus on West Texas Intermediate (WTI) spot and futures prices.]
 It’s fair to say that where oil prices go, CPI usually follows. However, there were three major divergences between WTI and CPI over the past 10 years, each having a great deal to do with equity prices.
Mar 2009: When CPI fell below 0%, WTI abruptly bottomed out and surged higher. Mar 2009 turned out to be the month that the S&P 500 (SPX) bottomed out after crashing 52%.
Jan 2011: After CPI topped 3%, WTI reversed and headed lower. It didn’t bottom out until October, which happens to be when SPX bottomed out after plunging 22%. In fact, WTI and SPX futures both peaked on May 2 and bottomed on Oct 4.
Sep 2015: When CPI backtested 0% in Sep 2015 after briefly falling below it, WTI continued falling until Feb 2016 — enabling SPX to backtest important support at 1823 after not quite reaching it in Aug 2015. SPX’s low came on Feb 11, 2016, the exact same day as oil futures.
Oil & Gas and Stock Prices
If WTI and CPI are so closely linked except for the times when stocks need support, what would a direct comparison of WTI and stock prices reveal? The chart below shows a very strong correlation, with quite a few shared tops and bottoms (and one glaring divergence between Jun 2014 and Apr 2015 which we’ll discuss later.)
 Coincidence? Perhaps the price swings in WTI simply reflect the prevailing supply and demand? Compare the correlation shown above to the correlation between oil prices and inventory shown below.
  Inventory and prices should, in general, move opposite one another. Yet, roughly half the time during the past 10 years, they moved in sync. More telling, these aberrations occurred almost exclusively during oil and stock price rallies.
Including US production in the mix does little to strengthen the argument that WTI prices were primarily driven by fundamentals.
Inflation and Interest Rates
This one is pretty obvious to most. Higher inflation generally triggers higher interest rates. While CPI has been all over the map, however, 10-year yields have fallen in a fairly orderly channel — until recently. Yields recently broke out of that channel and have since reached 2.94% — slightly higher than our Feb 1 forecast of 2.86% [see: The End is (Probably) Near.] This has been a source of great angst for both stock and bond investors.
Interest Rates and Stock Prices
Equities have had a complicated relationship with interest rates. In general, equities perform well in periods of rising rates and poorly in periods of falling rates. But, one must consider why rates are rising or falling in order to make sense of the relationship.
One approach emphasizes the flow of funds. When investors flee stocks during a downturn, funds flow into fixed income instruments. This drives prices up and yields down. Conversely, when stocks are rallying steadily, funds flow out of fixed income instruments and back into stocks – driving prices down and yields higher.
Another approach emphasizes inflation. When inflation is considered low, central banks are accommodative and interest rates decline accordingly. This can be a healthy environment for equities as: (1) future cash flows are worth more today when discounted at a low interest rate; and, (2) low interest rates enable corporations to leverage their balance sheets at low cost. Higher inflation can work in the opposite direction.
 Let’s look at how these dynamics played out since the GFC. Falling interest rates were a hallmark of the sharp equity market declines between 2007 and 2012 (above, in red.) This was the first approach mentioned above (the fear trade) in action.
Beginning in late 2013, however, declines in rates were usually associated with rising equity prices (in green.) It made no sense, until taking into account why interest rates were dropping. Remember, after being driven by rising oil prices to over 2% in early 2014, CPI fell to below 0% as WTI plunged from over $100 to $30/bbl.
Rates, correctly sensing no inflation threat, followed suit. The only reason stocks didn’t follow along is because USDJPY was in the midst of that massive rally in USDJPY.
 It also bears mention that the only reason Japan could afford such a massive devaluation in the yen was because oil and gas prices were falling so sharply at the same time.
Recall that Japan’s nukes had been shut down in the wake of the 2011 Fukushima disaster — leading it to greatly expand its oil and gas imports. As long as the yen remained strong against the US dollar (in which oil is priced), this presented no problems.
But, yen collapsed from 75 to 121 per US dollar between 2011 and 2014 — meaning the cost of oil in yen soared…

…and, inflation spiked above 2%. This was a bit of a problem considering: (1) the BoJ had justified the most accommodative monetary policy in the world with the need to increase inflation; and (2) Japan’s debt was 250% of GDP, meaning they desperately needed interest rates to remain at zero.
 Wrapping up this thread, if higher interest rates are bearish (at some point) and rising CPI causes higher rates, then wouldn’t CPI which rises above an acceptable level be bearish? Bingo.

Putting It All Together
If it’s hard to believe central banks could have driven oil prices sharply lower while devaluing the yen, all in order to control inflation, keep interest rates low and prop up equities, just remember: (1) US CPI had also recently topped 2%; (2) sanctions on (big oil exporter) Russia had just been announced for its Crimea invasion; and, (3) Richard Fisher said so.
We talked earlier about the divergence between WTI and SPX beginning in 2014. During this time, the Bank of Japan kicked the yen carry trade into overdrive, Fed President Jim Bullard declared QE4 was on the table, and the Bank of Japan announced a massive expansion of QQE — all of which acted to keep SPX above a critical Fibonacci line at 1823.
 Did central banks coordinate their actions? In the absence of an insider tell-all, we can only go by the evidence. It seems likely, as it resolved several critical issues in one fell swoop. And, consider that USDJPY broke out and oil futures broke down on the exact same day, July 30, 2014. That certainly seems coordinated.
 The road ahead appears challenging. From Japan’s standpoint, the cost of oil in yen has doubled since Jan 2016, and Japan’s inflation rate is fast approaching 2% again.
If oil continues to rally (bullish for equities) Japan would either face another inflation problem or would need to let the yen strengthen (both bearish for equities.) Only if oil were to decline (bearish for equities) could Japan resume devaluing the yen (bullish for equities.) There is no free lunch.
Given that Japan and the US are currently at loggerheads over Japan’s $56 billion U.S. trade deficit, the feasibility of a coordinated oil/currency operation is in question.
From the US standpoint, it would be possible to allow/encourage higher oil prices in order to support equities. But, at the current price of $2.75/gallon, regular gasoline is 17.5% higher than the average price registered in April 2017. It has run double digit YoY increases for 5 of the last 7 months and 10 of the last 16 months. The result: CPI in the US has been over 2% since September. The inescapable result: interest rates have shot higher — from 2.03 on Sep 7 to a high of 2.94 on Feb 21.
As we discussed in February [see: Why Rising Rates Are a Problem This Time] the rapid growth of national debt over the past 10 years has made rates over 3% untenable. From that post:

A 10-year yield over 3% wouldn’t have been much of a problem in 2010 when we had only $13.6 trillion in debt. Even in 2014, when debt reached $17.8 trillion, the large decline in rates meant interest expense grew only marginally.
But, at $21 trillion and growing, the prospect of normalizing rates has the market’s full, undivided attention. As long as all three of these plot lines keep rising, the market will continue to struggle.
 Bottom line, something has to give. While the Fed might like to let rates tick higher to mitigate inflation, they’ve probably done the math. They are well aware of the effect it would have on the deficit (which is why Bernanke let slip back in 2014 that we’d not see rates normalize in his lifetime.)
The average interest rate the treasury has paid on its debt since the year 2000 is 3.44% — slightly lower than the CBO’s 3.5% estimate for 2019. At that rate, $21 trillion in debt would translate into $703 billion in interest expense — a 53% increase over 2017’s tally.
Annual interest expense, at 17% of total government spending (up from 7% in 2017), would be the second highest category of budget expense, topping every other category except social security. At the 50-year average of 4.84%, interest expense would amount to $1 trillion and consume 25% of total spending.

Which budget category would Congress cut by $250-500 billion in order to accommodate soaring oil industry profits? Isn’t it more likely that “someone” will put the brakes on the oil and gas rally? They needn’t crash 2014 style — merely come back down to a level at which the YoY increase doesn’t produce inflation that causes rates to spike past 3%.
With that premise in mind, our forecast. Fair warning…if you’re a bull, you might not enjoy it all that much.
I’ve looked at the economic conundrum from every angle I can think of. And, it boils down to these not so great choices:
(1) let oil and gas keep rising, inflation and interest rates become a serious problem… and equities take a hit.
(2) reign in oil and gas prices, keep inflation and interest rates in check…but take away a important tool the algos have come to rely on.
There are obviously other ways to keep stocks rising, namely the yen carry trade and the VIX beatdown. Resurrecting the carry trade in any serious fashion would require oil and gas prices to come back down — though, since nukes are back in fashion in Japan, the link is somewhat weaker than in 2011-2014.
And, let’s not forget that the algos are happy to switch gears, allowing USDJPY, CL and VIX to take turns — with one ramping higher while the others reset [see: Oil – Stocks’ Co-Pilot.]
The VIX is still a viable tool, and will continue to be until TPTB lose control again. I see the Jan-Feb correction as being an acceptable backtest at an agreed-upon Fib level, which is why VIX was allowed to spike up to 50. So, with those caveat, I’m sticking with the assumption that oil and gas prices will come under pressure — either overtly or courtesy of the Fed’s trading desk. Let’s assume that getting CPI back to or slightly under 2% would do the trick. The last time CPI was below 2% was in August 2016 (1.95%.)
At that point, regular gas was at 2.297, up 8.8% from the previous years 2.119. That would be a 16% drop from today’s 2.75. But, they’d only need to get the annual rate of change back to, say, 8.8%. In that case, April 2018 would need to come in at 2.54 — a 7.7% drop from current prices.
If we assume a dollar-for-dollar move in RB, that would mean a drop from 2.085 to 1.92 — which is about where our current target is for RB. Interestingly, it would leave RB at a backtest of the rising purple channel from which it first broke out in January.
 Applying the same logic to May would imply an ever deeper drop to 1.74ish.
 What would such a drop do to stocks? Remember, in February SPX racked up huge losses when RB dropped back below the top of the purple channel (the yellow arrows) from which it had broken out.
  Could we see the same thing happen again? Absolutely. As we’ve discussed many times since mid-March, a C=A corrective wave would take SPX back down to 2460 and ES to 2456.
If it happened now, it would be about an 8% drop and would come off as a backtest of the falling channels that were in the works prior to Bullard and Kudlow’s bullish efforts allowed stocks to break out.
I’d put the odds at 50/50 or better. And, if SPX/ES drop through their necklines and AAPL through its SMA200, I’d put the odds at 80/20. 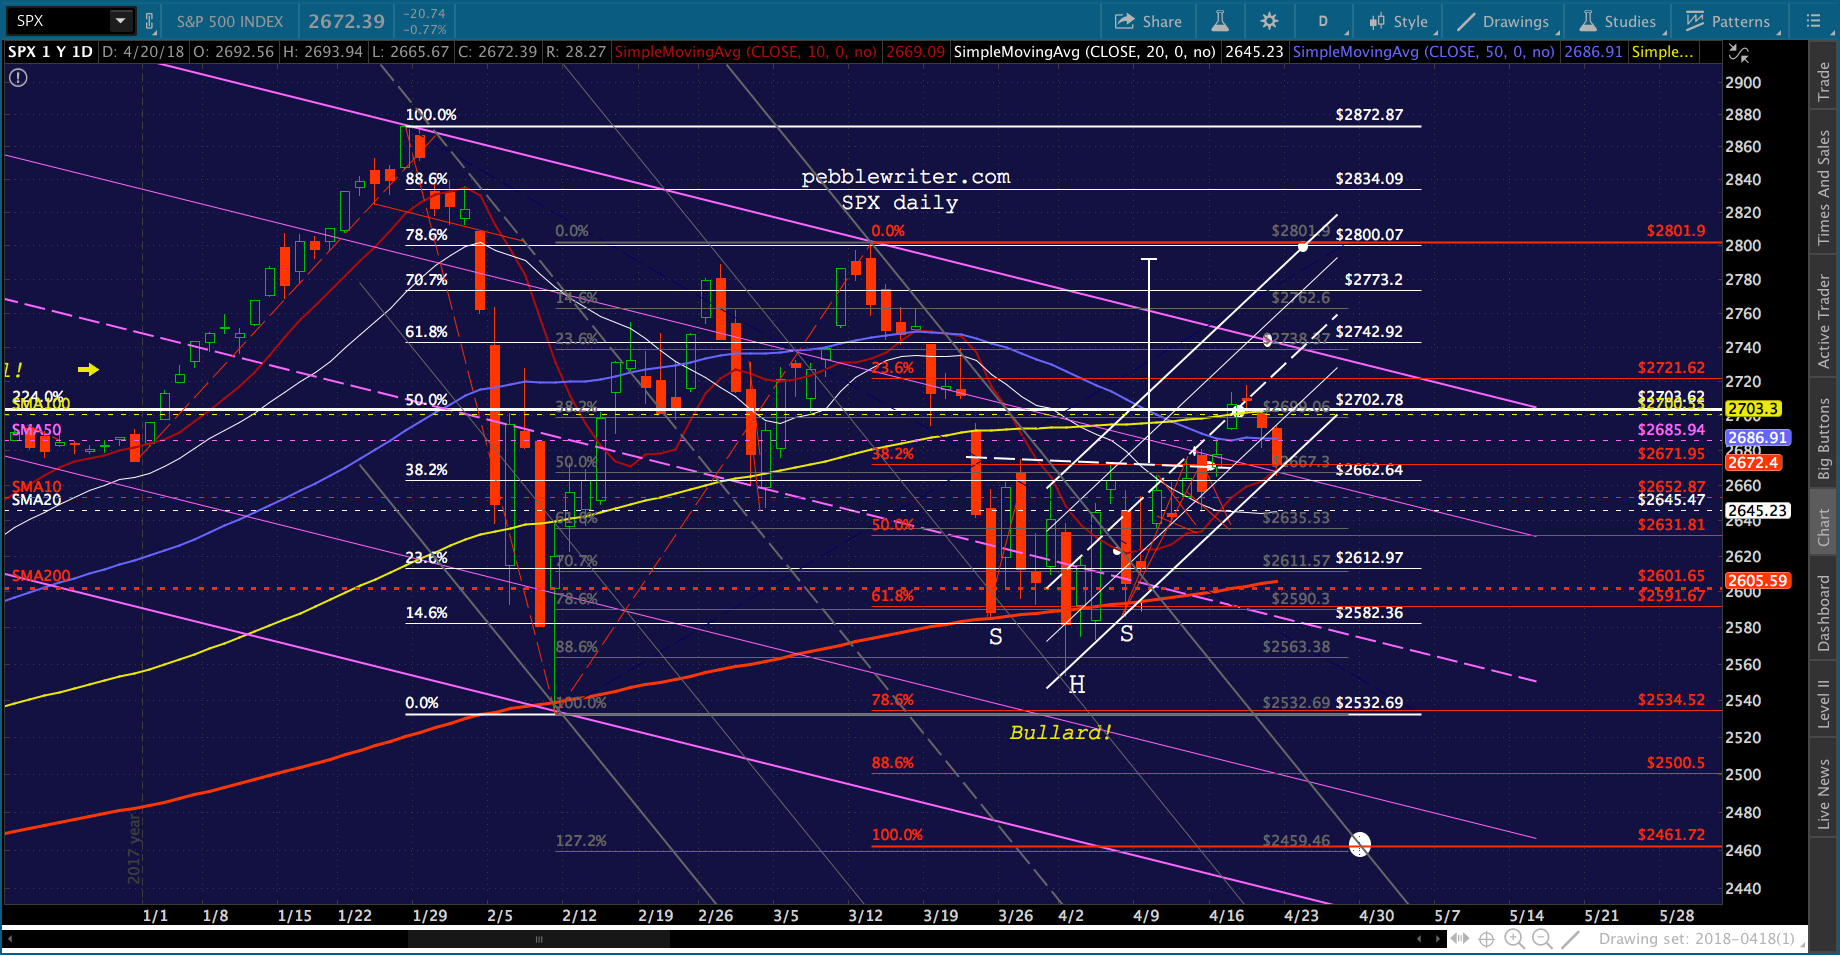
 Translating the move to a few other favorites…


I had more than a few notes today regarding COMP and AAPL. Two weeks ago [see: Dire Straits] I suggested equities were having a hard time breaking out because COMP hadn’t backtested its SMA200 yet.
Here’s a fun thought…touched on this the other day. COMP still hasn’t reached its SMA200 — would require a 3.47% drop. Interesting that AAPL (the biggest component of COMP) is 3.73% above support at its SMA200. Hmmm…you know that tingly feeling you get when something exciting is about to happen?
It was a neat theory, but it just wasn’t playing out. Last week, we switched gears, reasoning that COMP would wait to backtest its SMA200 until it was up above its Apr 2 lows of (6805.96.) Guess what?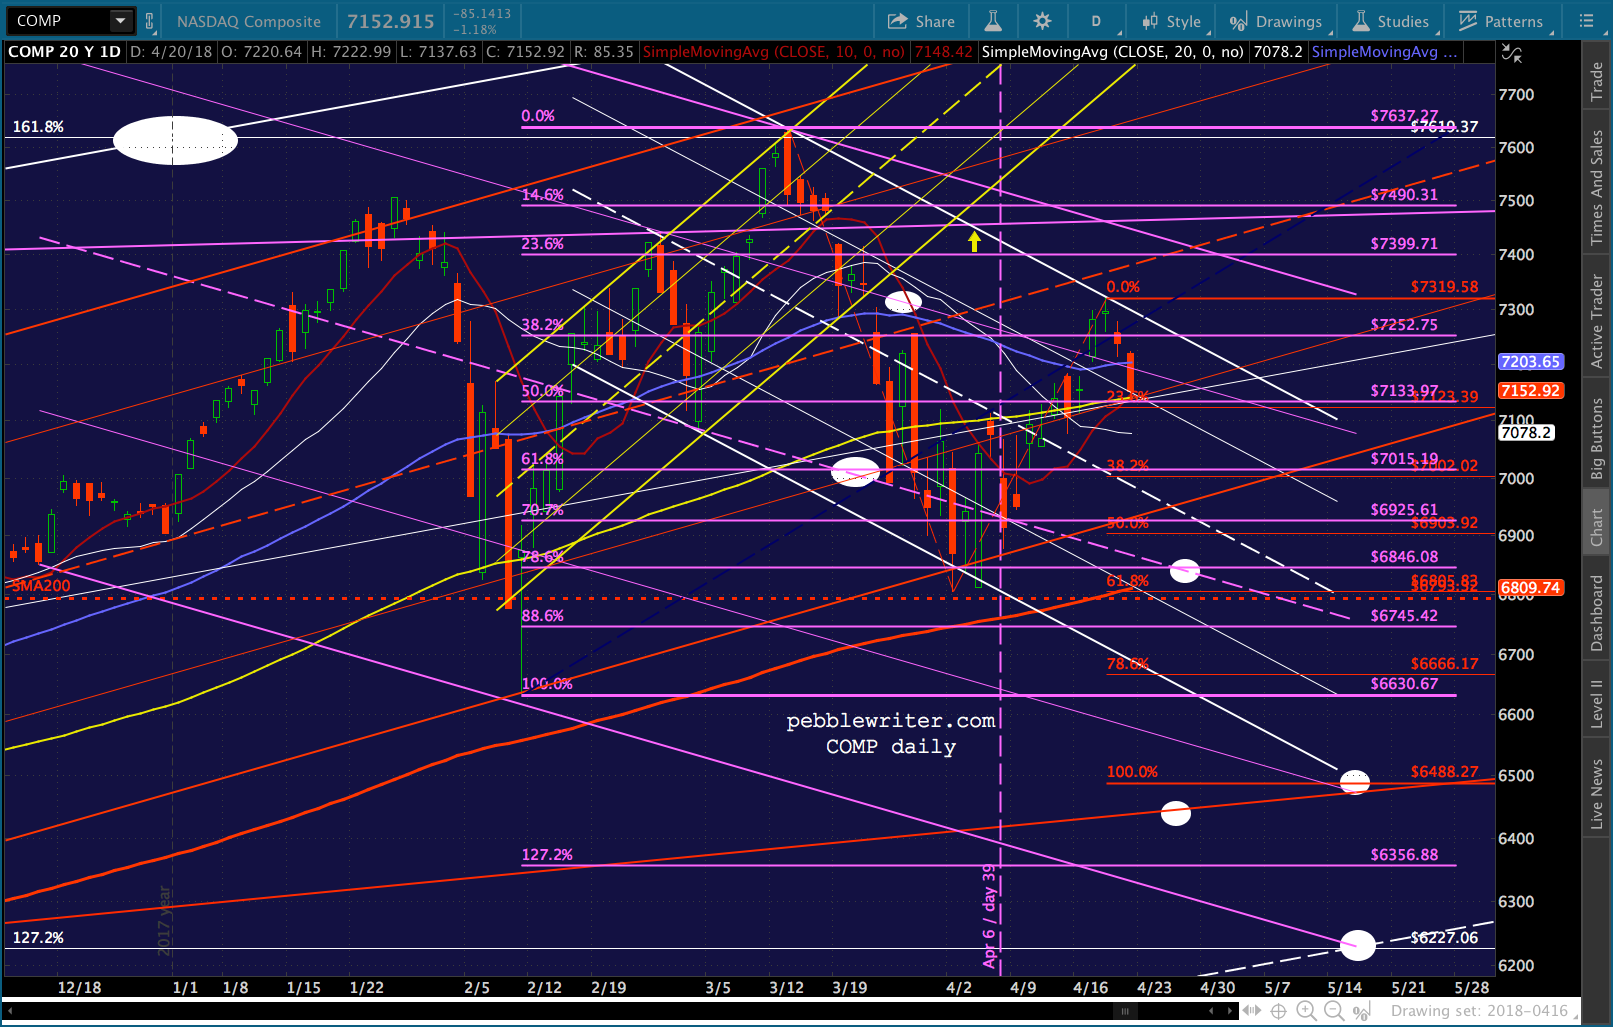 When AAPL finally delivered today, I assumed COMP would play along. But, today was the biggest divergence between the two in quite a while. Naturally, everybody and their brother was looking for AAPL to hold its SMA200. What if it were to drop through it on Monday and tag the .618 or lower, could COMP resist following along? Probably not.

A couple of caveats for all this bearishness… if USDJPY should take off like a cat with its tail on fire, what then? Might that offset RB’s decline? Sure, to some extent. There’s a lot of room for, say, a backtest of the broken white channel (still haven’t had a proper one.) But, it wasn’t all that helpful during the two tumbles in Feb.
 And, how is the US dollar going to pop without higher rates? We know how fond stocks have been of rising rates, lately.
The other caveat, of course, is that this is a weekend: the easiest time during which to ramp futures higher in time for a solid opening on Monday. Happens all the time. In fact SPX looks likely to close above its neckline and within its latest rising channel. If it’s not going to bounce on Monday, it’s sure delivering an Oscar -worthy head fake.
The more I type, the more bearish I get. So, I should probably just quit for the day. Bottom line, I’d be very cautious about taking off for the weekend without protection. Daredevils (especially those of the bearish persuasion) this is a pretty good opportunity to roll the dice.
Good luck to all.
p.s. just heard that Trump tweeted his displeasure with oil prices earlier today. Ha!
