It was a strange press conference. As we discussed yesterday, stocks would react kindly…
…if Powell is successful in convincing
investorsalgos that the economy is strong but there is no wage pressure and inflation poses no real threat.
I think he succeeded in portraying the economy as strong. This morning’s economic data helped bolster that narrative (as long as you don’t look too closely.)

As far as wage pressure, the official data continues to suggest it’s not a problem just yet. As far as inflation, however, I think he came up short.
Unless Trump is successful in reversing the damage he touched off by ripping up the Iran deal and starting a tariff war, inflation is a problem.
As long as inflation is a problem, rates will continue to rise. There are many who insist rates need to rise quite a bit more in order to stave off runaway inflation. Ordinarily, this might not be a problem. But, given that America faces runaway deficits and debt, it is a yuuuge problem.

Perhaps it was this realization that unraveled the ramp job as soon as Powell finished speaking. It’s simply not possible to keep inflation in check in the midst of a major trade war and with much of the global oil supply being taken off the market.
Fortunately for the bulls, SPX found support at an important channel line. But, it’s not the sort of channel that lasts.
continuing…
We walked through this the other day. The rising purple channel is still roughly intact.
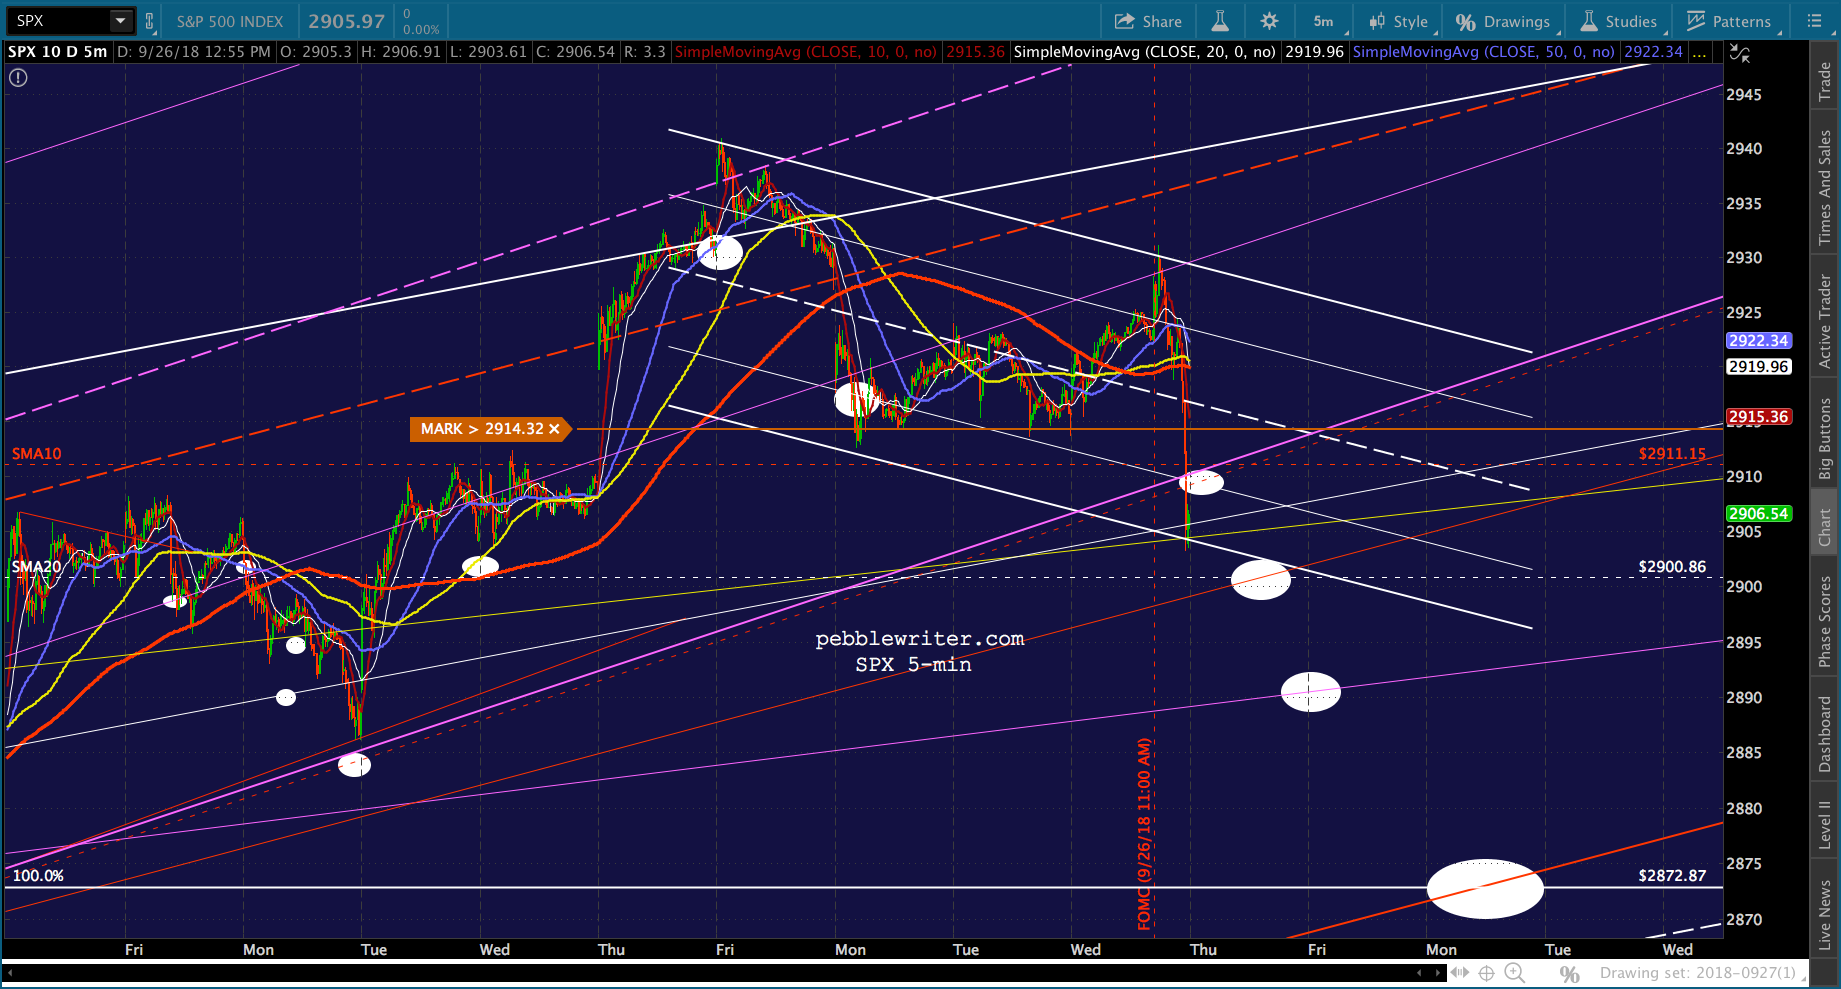
 It lies within the rising red channel, which lies within the large rising yellow channel.
 There’s a competing rising white channel which has a slightly less aggressive slope. All off them reach the 1.272 and yellow 2.618 in time. But, as mentioned above, the smaller ones are more subject to breakdown.
Stocks’ best chance at a recovery lie in VIX, which tagged the small white channel top yesterday, but didn’t quite reach the SMA100. It has a clear path in either direction.
Then there’s the rates and currency angle.
The 10Y fell sharply, and has continued to falter this morning. Importantly, it never broke above May’s highs… …and price never fell below May’s lows.

The dollar also recovered, and is backtesting the neckline below which it fell last week. If it can’t recover the neckline, stocks could be in for more trouble.
 EURUSD offers an important guide to the dollar’s fate. Unless this TL breaks down, the SMA200 backtest continues to make sense.
 Finally, the USDJPY — which saw its latest channel break down yesterday — is considering a bid to recover and break out. At this point, it’s nothing more than a backtest and suggests further downside. But, we’ve seen countless instances of miraculous recoveries when stocks are under pressure.
The oil and gas angle has shifted slightly since Trump started pressuring OPEC to lower prices. SA announced a 550K barrel/day increase in production — which, combined with bearish API and EIA inventory data, might be enough move the needle. If stocks can rebound, look for CL and RB to continue falling.


Past experience tells us VIX will probably continue falling, supporting a V-shaped recovery. But, keep a close eye on things, especially those intraday breakdowns.
More later.
UPDATE: 1:45 PM
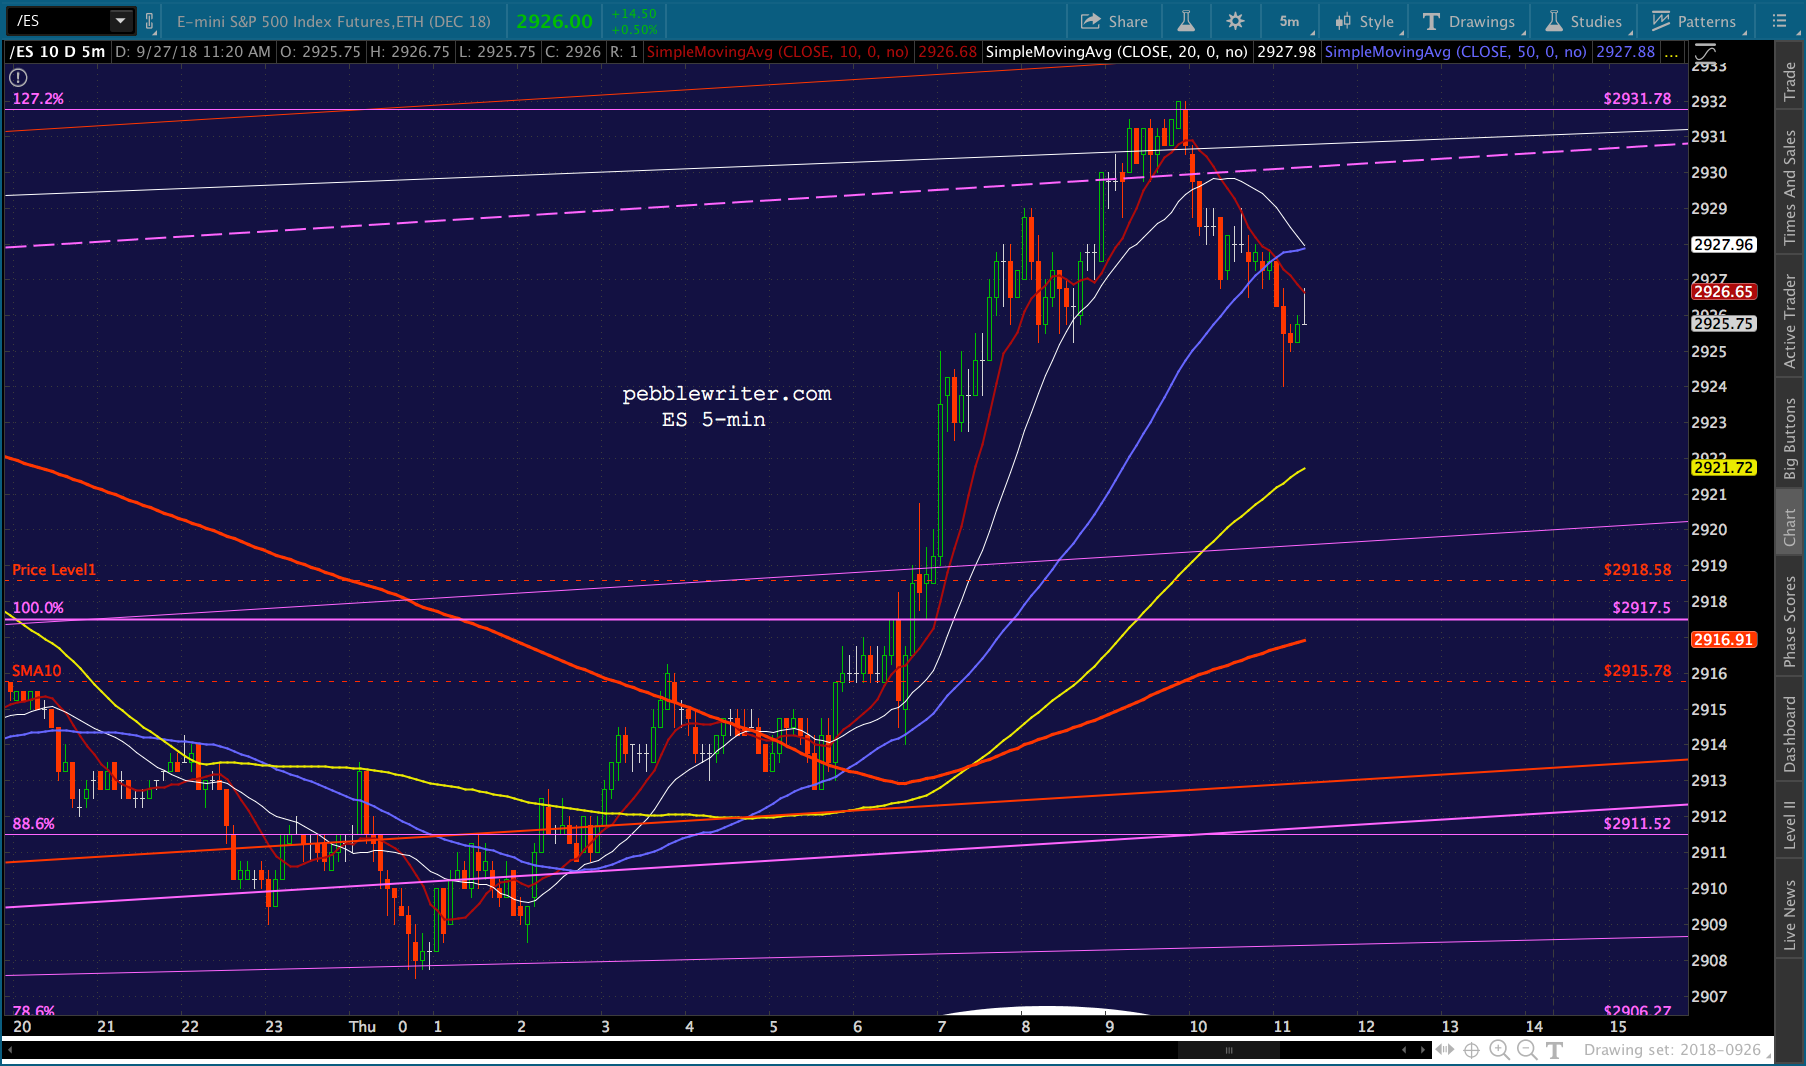
SPX/ES have bounced sharply — the classic V-shaped recovery, driven primarily by VIX and USDJPY.

 DXY has continued pushing up against and through the neckline, facilitating USDJPY’s breakout. It remains to be seen whether we’ll get a close there.


VIX dropped as much as 9.2% before bouncing as SPX reached the white channel top and ES reached its purple midline.

Bottom line, it’s very difficult to know whether or not this bounce will hold. Since USDJPY has further upside room and VIX further downside room, I’d assume stocks are going to continuing rallying. But, I’d keep a close eye on momentum measures such as short-term SMAs.
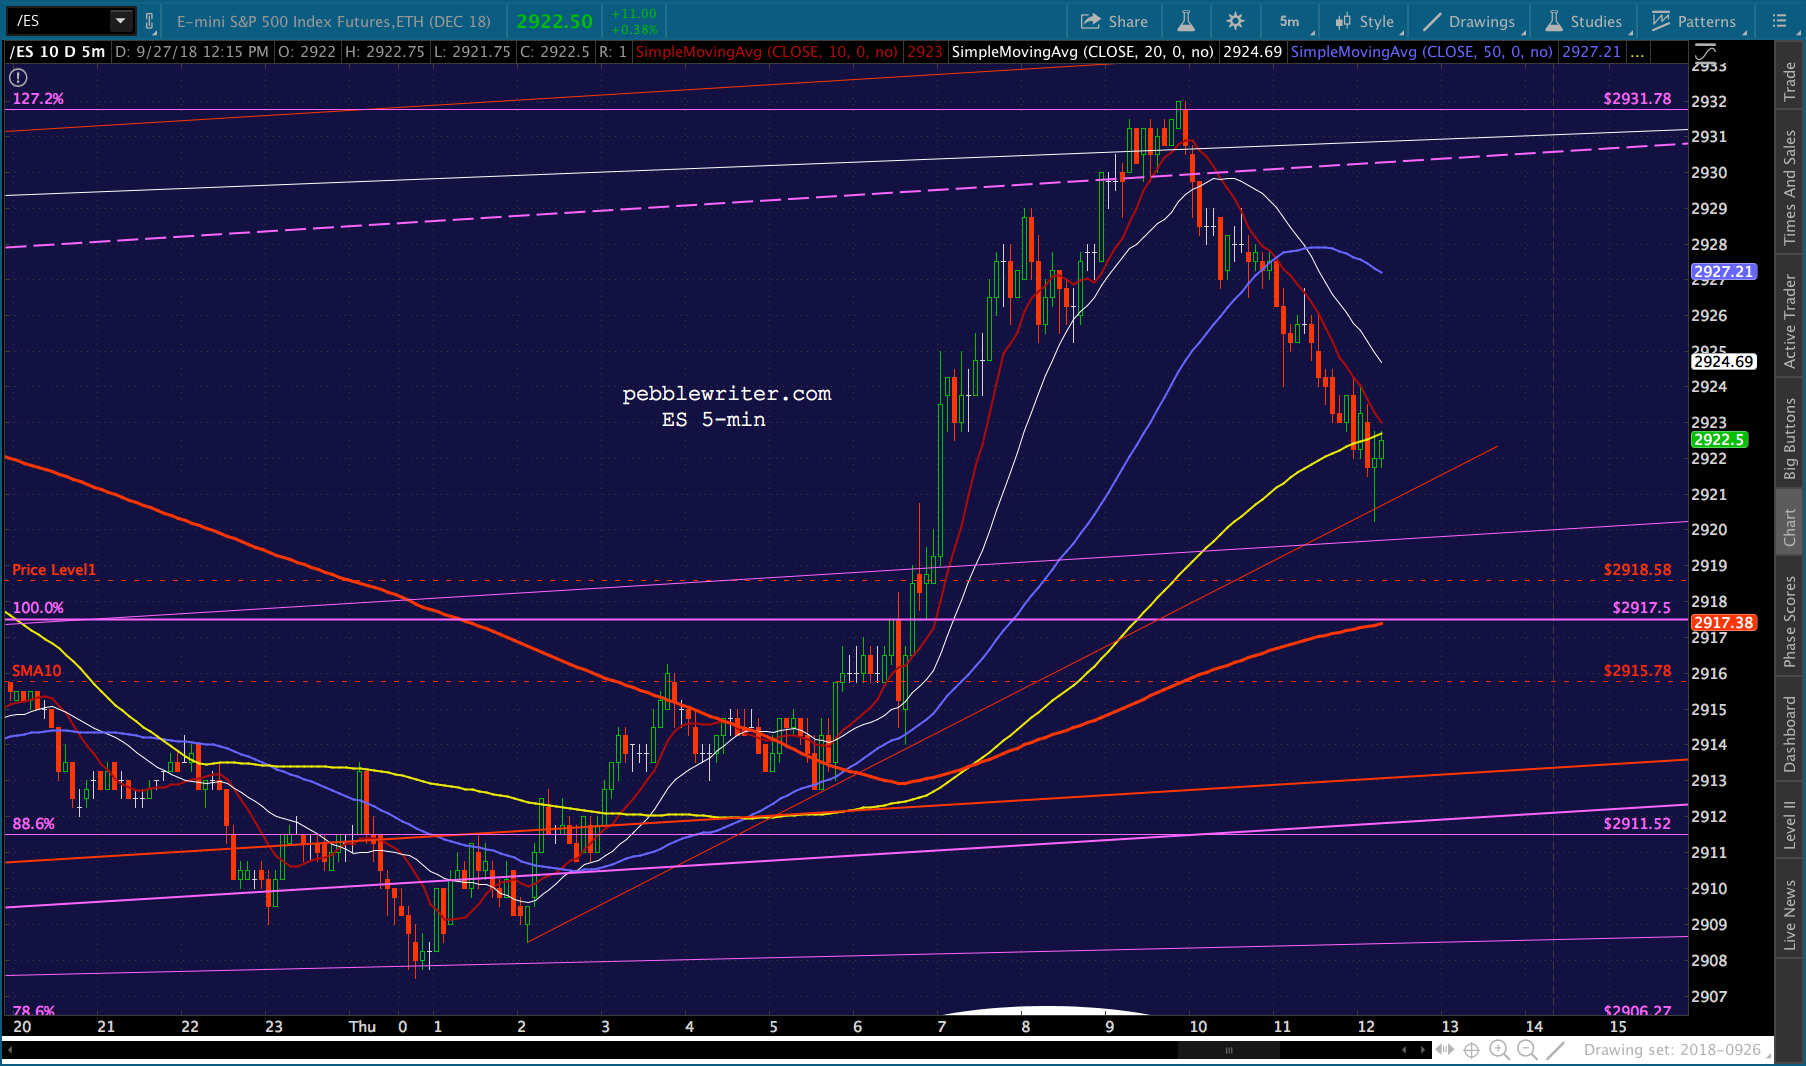
At the moment, ES is backtesting the SMA5 10, which has crossed the SMA5 20. So, the momentum is flagging.
I had a request yesterday for an update on the gold chart. Some of you might remember I turned positive on gold again in late August when it popped back above a key TL, shown below in yellow. This TL has been very reliable, but there was a period of days when GC dropped below it – potentially a false bearish signal.
GC is now backtesting the TL as well as a key horizontal price level (red, dashed.) If it holds here at 1185, I’d remain long with upside targets at 1286, 1323, 1350 and 1380. Otherwise, GC has further downside potential to 1142, followed by 1124, 1116 and 1083. Bottom line, this is a very important inflection point. We’ll let the price action tell us which way to bet.
 UPDATE: 3:18 PM
It’s the sort of TL that usually supports stocks when algos are running the show.
It the TL doesn’t hold, there’s always the August highs at 2917.50 and the SMA10 at 2915.78. Anything below that, and things get pretty dicey.