Category: Charts I’m Watching

  • Election Day: Nov 6, 2018

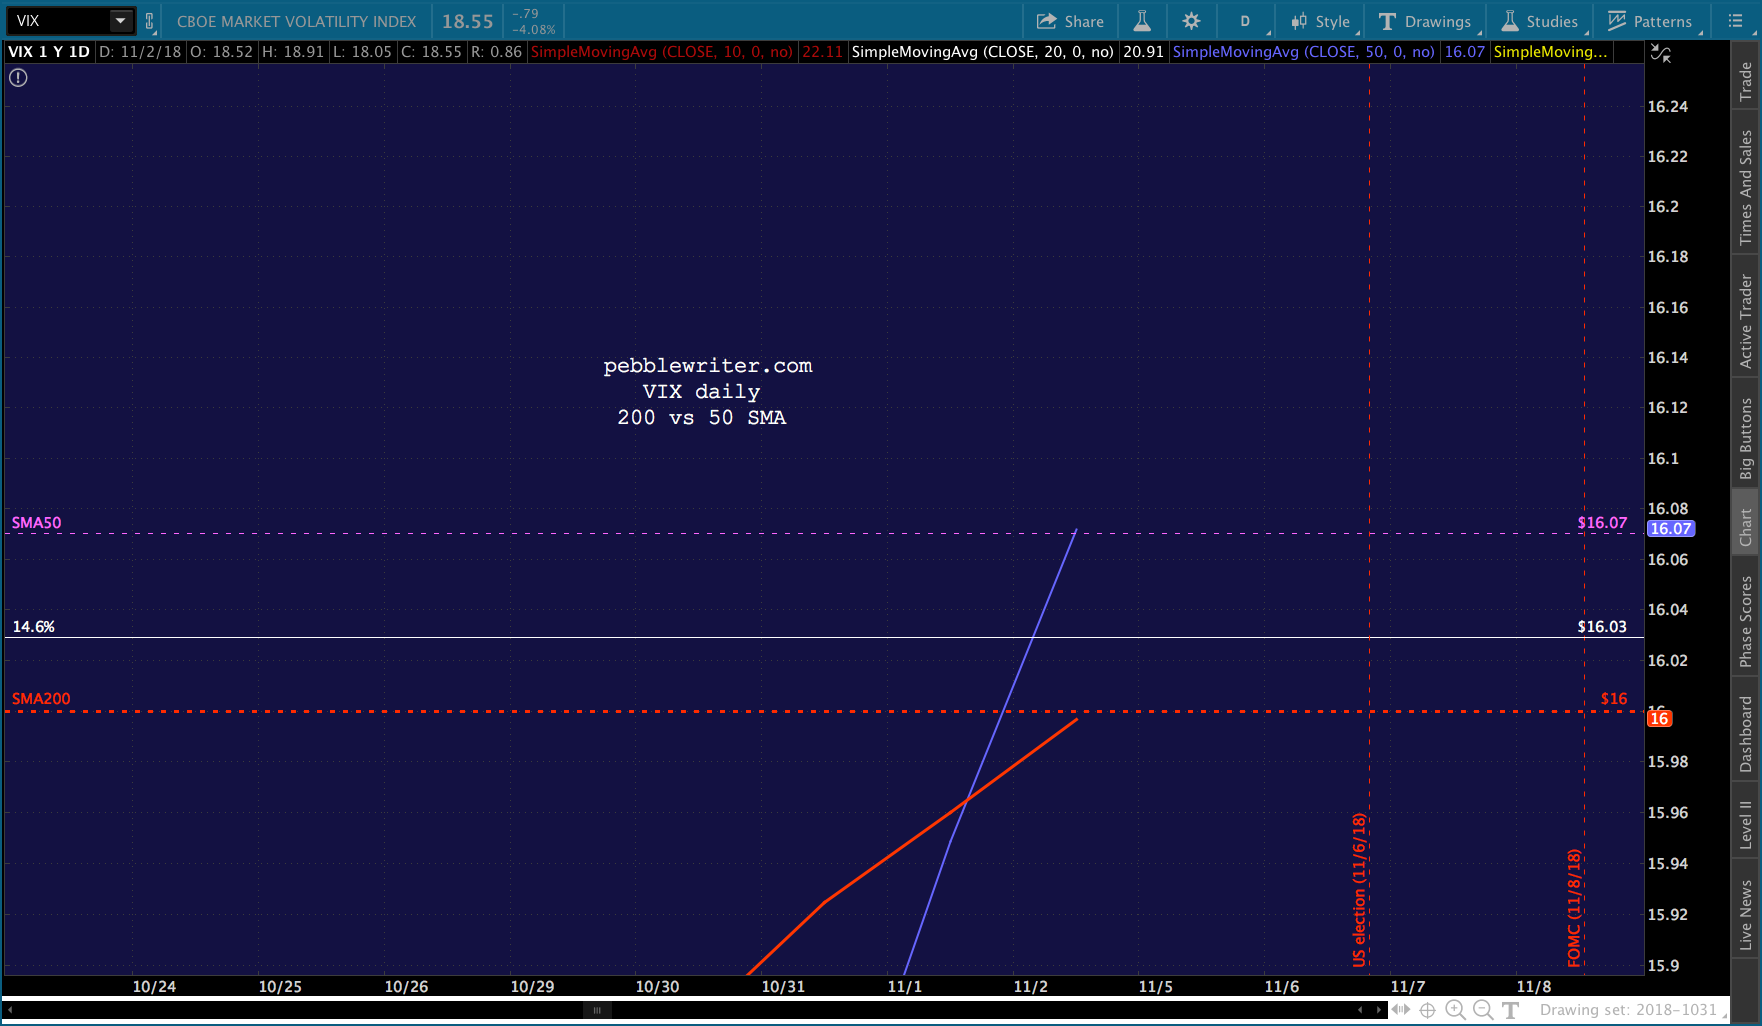
    Futures are off modestly on an important election day which will hopefully resolve plenty of unknowns.On the bullish side of the aisle: both ES and SPX are safely above and have backtested their 2.24 Fib extensions; oil and gas have fallen sharply to decent support levels; VIX is at a modest level with a clear path lower if necessary; USDJPY has a clear path higher – at least temporarily.

    On the bearish side of the aisle: inflation should be much lower in Oct as a result of oil and gas declines; interest rates are still pushing against important resistance; VIX experienced a golden cross on Friday; FAANGs are providing bearish leadership; and, many fundamental analysts have pronounced a democratic surge as bearish.

    Both sides have played to their bases in this midterm.  In several cases, this has resulted in excellent results for our forecasts.  Consider, for instance, how much gas prices have dropped — mitigating the damage done by Trump’s Iran sanctions and helping our oil/gas forecasts working out quite nicely.The assistance provided by currency moves has played nicely into our USDJPY forecast.As we learned after the 2016 election, the market moves the way the algos dictate.  The only question is whether the algos will receive enough “guidance” to keep stocks on the rise. It should be an interesting next couple of days.

    continued for members(more…)

  • Charts I’m Watching: Nov 5, 2018

    Futures are back to flat, having bounced a bit on the Iran sanction news as it provided a modest (so far) bounce for oil and gas prices.The market has a wait and see feel to it this morning, with AAPL breaking down further……but, the algos all but ignoring it, focusing instead on dollar strength (TNX is higher again) and oil’s potential recovery.  AAPL is now off almost 14% and is nearing our channel target [see: All Eyes on AAPL] with the gap close target of 195.96 and SMA200 target (currently 192.44) looking better all the time.

    Members might wish to revisit last week’s post on VIX [see: VIX’s Warning] in which we discussed the bearish implications of the impending 50/200 cross.  This morning, it’s alive and well.continued for members

    (more…)

  • Mixed Messages

    The headlines have been coming fast and furious over the last 24 hours.  First, Trump’s tweet yesterday morning regarding trade negotiations with China touched off a rumor, declared false this morning, that a trade deal was imminent. But, SPX soared yesterday anyway.

    Then AAPL’s earnings came out.  The numbers were underwhelming; and, the company’s announcement that they’d no longer report unit data was very poorly received.

    The chart we put up yesterday prior to the close [see: All Eyes on AAPL] showed substantial downside potential… …which after-hours trading is confirming.Then there was this morning’s payrolls data: a 250K increase with a 3.1% increase in average hourly earnings.  While no doubt  It’s exactly the sort of data the Fed needs to justify further rate increases in the face of the collapse in oil and gas prices — the last piece of the puzzle.

    Gasoline has now fallen over 20% since our Oct 3 short call and tagged another downside target yesterday.Oil is off over 16% and just broke beneath horizontal and channel support.  To be sure, it will keep October’s CPI low and will delight voters driving to the polls on Tuesday.  But, like the employment data, there are repercussions.By the way, I have updated our oil and gas forecasting results, available at the links below.

    Oil Results
    Gas Results

    I hope to post currencies, VIX and gold later today or this weekend.

    Futures melted up to backtest the SMA200 early this morning and have since fallen 16 points to the algo-darling SMA5 200.  It remains to be seen how the mixed messages being sent up from Washington and Cupertino will play out.  But, for now, I’m leaving our targets in place.For the moment, at least, VIX’s 50/200 cross is on again.continued for members(more…)

  • All Eyes on AAPL

    Three months after AAPL’s “breakout,” it faces its first real test.  As we discussed in August [see: Engineering AAPL’s Breakout] the stock burst out of a long-term rising channel with the aid of several well-timed increases in its stock repurchase program.

    Now, it’s time to backtest that mediocre 12%-per-year channel it’s been in since 2010 and embrace its new and improved 36%-per-year channel.A drop to 200 or so wouldn’t do much to dent bulls’ enthusiasm.  Even a likely drop to the SMA200, currently at 192.17, could be passed off as a base-building exercise. One key number in the middle is the open gap remaining at 195.96, a gap which would obviously be closed with a tag on the SMA200 and red channel bottom.All of these scenarios presuppose that, like many of its FAANG cohorts, AAPL will disappoint at least a little. Clearly, the company could turn out some great numbers. But, with the market’s ongoing rally depending on AAPL’s results, anything more than a minor disappointment could do some real damage.

    Bears probably shouldn’t get too worked up.  Even if there were a disappointing number of people willing to shell out $1,500 for a fancier way of posting on Instagram or playing Fortnite, the company could always expand their buyback program by another $100-200 billion.

    If the SMA200 doesn’t hold, AAPL will have some important decisions to make re buybacks.  The next significant support is way down at 144.48.

    Stay tuned.


    (more…)

  • VIX’s Warning

    The death cross is one of those tried and true technical indicators that often portends big drops.  When a stock’s 50-DMA drops below its 200-DMA, it tends to drop like a rock (unless it’s FB, which uses such crosses to time its buyback announcements.)

    I thought it’d be interesting to look at VIX, which has had such an important impact on stocks — especially over the last two years. Previous death crosses (when it’s 50-DMA rises above its 200-DMA) are marked with a yellow arrow, and it’s pretty clear that they have predictably indicated big spikes in VIX — and, big drops in SPX.It’s interesting, then, that as of yesterday’s close the 50-DMA and 200-DMA were both at 15.97.  This morning, the 50-DMA ticked slightly higher — making this the most bearish chart I know of.continued for members(more…)

  • Decision Time…Again

    VIX’s rising TL has been a solid guide to lower stock prices.  This morning it is indicating another, more serious breakdown than the head fake we saw on Monday.Along with USDJPY’s “breakout” it has been enough for the algos to bid futures up to the top of their falling channel for the 10th time this month.

    There are two ways to look at this.  One is very bullish, while the other is quite bearish.  It’s decision time for stocks.

    continued for members(more…)

  • What If?

    You know the market is in trouble when USDJPY ramps in the hours before the open and futures tumble into the red anyways.If you’re wondering why the BoJ picked this particular moment for USDJPY to break out, look no further than the NKD.  After guiding NKD higher for over 10 years, it doesn’t seem likely they’ll just roll over at this point.This on the heels of a pretty wild ride, yesterday.  SPX spiked up to slightly above our upside target and then got whacked, plunging 103 points from its highs before bouncing into the close.

    In the process, SPX formed the right shoulder we were expecting — which opens the door to a much bigger drop than was originally the case.The algo backdrop is negative this morning, with VIX still above its key trend line and RB and CL dropping toward our next downside targets.  Stocks could be in for another rough day.  What if this is the day?

    continued for members(more…)

  • Charts I’m Watching: Oct 29, 2018

    SPX bounced right in between the two .786 retracements we had identified Friday – leaving it either on the road to recovery or in the midst of forming a right shoulder in a Head & Shoulder pattern.

    Again, we should keep an eye on VIX – which is threatening to break down after an extended rally.continued for members(more…)

  • What Are the FAANGs Trying to Tell Us?

    Futures have bounced 17 points off their lows, but are still indicating a 26-pt drop — giving up all of yesterday’s goal-seeking meltup and then some.

    SPX was desperate to retake its 2.24 extension at 2703.62…and it did.  Unfortunately, for those who weren’t watching VIX……it was a headfake.  The flimsy little TL off the recent highs proved to be plenty enough resistance for a reversal, and we should have no trouble exploring our downside targets today (as long as VIX remains above its purple TL.)As expected, RB has continued to sell off and CL continues to go sideways.  And, USDJPY gave up a half-hearted attempt to break out past another one of those flimsy TLs of resistance.Never say never, but these are not the characteristics of a market which is going to be rescued any time soon.

    Suddenly, our COMP forecast from Oct 10 isn’t looking so far-fetched.

     *  *  *

    Some of you might have seen this GOOGL chart yesterday.  It’s striking in a number of ways.Obviously, GOOGL has broken a very long trend line of support.It is also threatening to break down through the last horizontal support it has.  Recall that back on April 23, when all of the FAANGs were in danger of breaking down [see: Is the Market About to be de-FAANGed?], GOOGL came to the rescue.

    It spiked to within 6 1/2 points of our 1298 target [see: Alphabet’s Big Day]……which was enough to help the broader market (including the rest of the FAANGs), but then proceeded to tumble to every one of our downside targets in succession.  From Focus on the FAANGs in July:

    If [GOOGL] stumbles further here, it has decent support at the previous high and red channel bottom at 1178.16 around Aug 6 — 4.8% below current levels and 8.8% from its recent highs. If 1178 doesn’t hold, the next support is its SMA200 (currently 1093 but rising fast), followed by the white TL where it intersects with the .618 at 1103.99.

    Note that it closed at 1103 yesterday, but is positioned to drop back below it this morning.Facebook is another stock which has surprised with its compliance with our bearish outlook.  As we discussed in Focus on the FAANGs, it had plenty of downside if its H&S neckline didn’t hold. 

    The neckline held for another month, then didn’t.  The death crosses which had always served as reminders to increase the size of its buyback plan finally played out, and FB came within a point of our 144 target.

    A better target is 141.40, which would finally allow the backtest of the falling purple channel.  Note that had the backtest been allowed to occur in August as we originally anticipated, it would have reversed at 156 and FB wouldn’t be flirting with the support of the important white channel midline.

    We could walk through each of the FAANGs, but the story is pretty much the same with each.

    This time really is different.  Important support is either broken or in danger of being broken. The usual tricks aren’t being deployed.  And, investors are rightfully nervous.  Things are going to get worse before they get better.

    continued for members…
    (more…)

  • Coincidences and Consequences

    It’s interesting how Khashoggi’s murder top-ticked oil and gas prices…

    …and, so soon after Trump’s latest demand that OPEC lower oil prices.

    I’m certainly not insinuating that Trump had anything to do with Khashoggi’s murder.

    But, OPEC ignored Trump’s Sep 20 demand.  Two weeks later, oil prices had spiked 10% higher.  Since Oct 3, the day of the murder, WTI has fallen 14.5% and RBOB has fallen 16.7%.

    As Churchill famously said, “never let a good crisis go to waste.”

     *  *  *

    Sometimes it’s quite difficult to anticipate a major market move.  You’ve got hundreds of companies, all with their own earnings, outlooks, and market-moving headlines.  Then, there’s the economic news of the day, both domestic and foreign.  And, of course, there are geopolitical developments such as who’s dismembering or cozying up to whom?

    And, sometimes it’s not so difficult at all. It can be as simple as the VIX chart we’ve discussed all week.  From Time to Panic on Tuesday:

    Note that VIX need only break the purple TL [for SPX to bounce.] If VIX doesn’t break down, this should be the end of the line for this bounce.

    It didn’t bounce.  SPX plunged.  Next?

    Or it can be slightly more complex, but still fairly straightforward — such as is the case with oil and gas.

    As we all know, central bank support (low interest rates, among other accommodations) has been critical to stock prices since 2009.  Low interest rates, of course, rely on low inflation.  And, low inflation relies to a great extent on low oil and gas prices (more accurately, low MoM and YoY increases in those prices.

    From last April in Oil & Gas, Inflation and Interest Rates: A Delicate Balance or Goal Seeking?

    The complicating factor, of course, is that oil and gas prices took over the job of stimulating algos (chief among the 90% of all trading activity which is conducted by machines) to drive stocks higher.

    Most recently, oil, gas and SPX all bottomed on Feb 11, 2016 and oil and gas prices played an integral role in stimulating the subsequent rally.  The most important nudge was in December 2017, when oil and gas prices broke out of an already rising channel.

    To chartists, and to algos, this is a very bullish maneuver.  It also has the effect of driving inflation and interest rates higher. CPI rose from 2.11% in December 2017 to 2.95 in July 2018.  The 10Y rose from 2.31% in December to 3.24% just a few weeks ago.

    The Fed told us they were okay with this, that they were going to let the economy and inflation “run hot.”  I was among the many doubters, citing the damage that higher rates would inflict on our already alarming budget deficit, but darned if they didn’t do it anyway. I suppose that, at the end of the day, a temporary increase in the rate at which the debt and interest expense are expanding was less important than having a higher perch from which to crash rates during the next GFC.

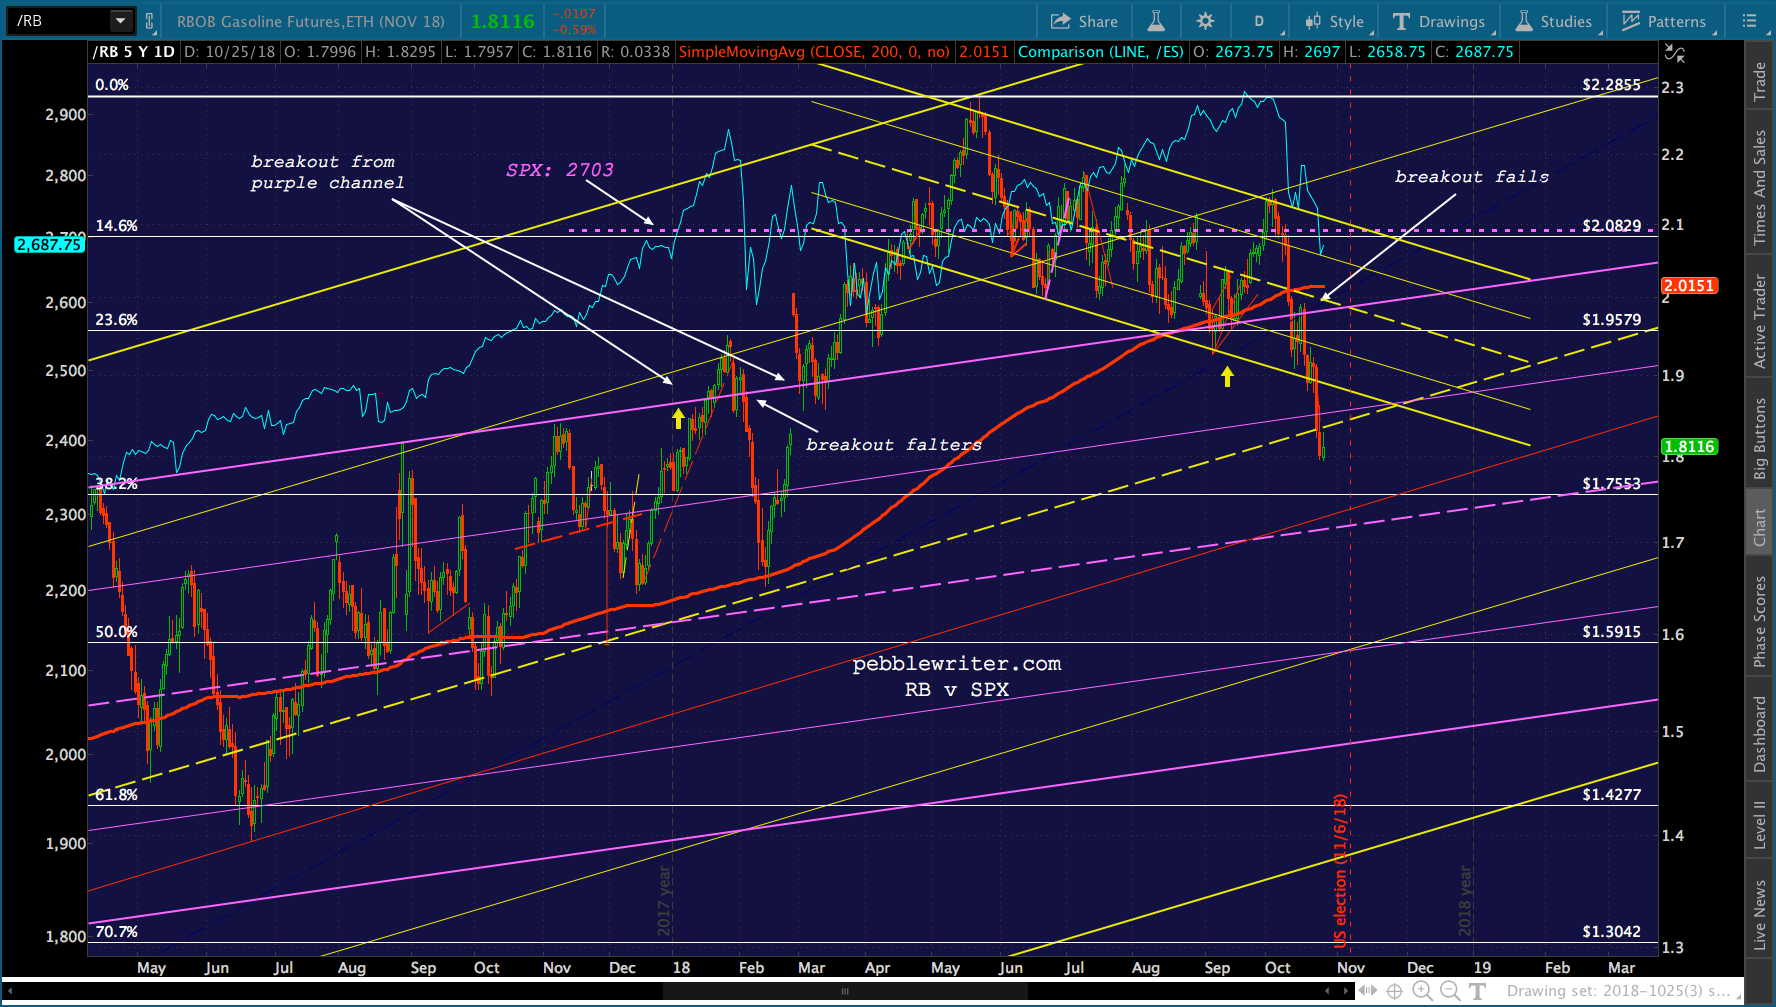
    Stocks ignored the implications for a while, happy to play follow the leader with oil and gas prices.  The day that RBOB popped out of the rising purple channel was the day that SPX popped above its 2.24 Fibonacci extension at 2703 – a level which might otherwise have provided serious overhead resistance.  It can be seen as the horizontal, purple trend line on the chart below. In early February, though, RBOB’s breakout faltered.  No surprise, but SPX followed along, suffering its biggest and sharpest decline in years.  Like magic, RB quickly popped back above the purple channel top – rescuing SPX and helping it back above 2703.

    Note that SPX went on to new all-time highs in September, only after RB backtested the purple channel and bounced higher.

    And this lovely little correction we’re enjoying?  SPX topped the day that RB failed to break out of the falling yellow channel (also the day of Khashoggi’s murder.)  SPX fell through its 200-day moving average on the day that RB plunged back below the purple channel top.  And, SPX plunged below 2703 on the day that RB fell out of the falling yellow channel.

    With the elections less than two weeks away, I’m not expecting a sharp rebound in oil and gas prices any time soon.  So, the algos will have to rely on other tools — such as VIX, which has now shed 12.5% since tagged our 26 target yesterday.

    So far, VIX’s decline has produced a pretty nifty bounce.  Is it enough to offset weakness in oil and gas and a hawkish Fed which has been browbeaten by a “low-interest rate president?

    continued for members... (more…)