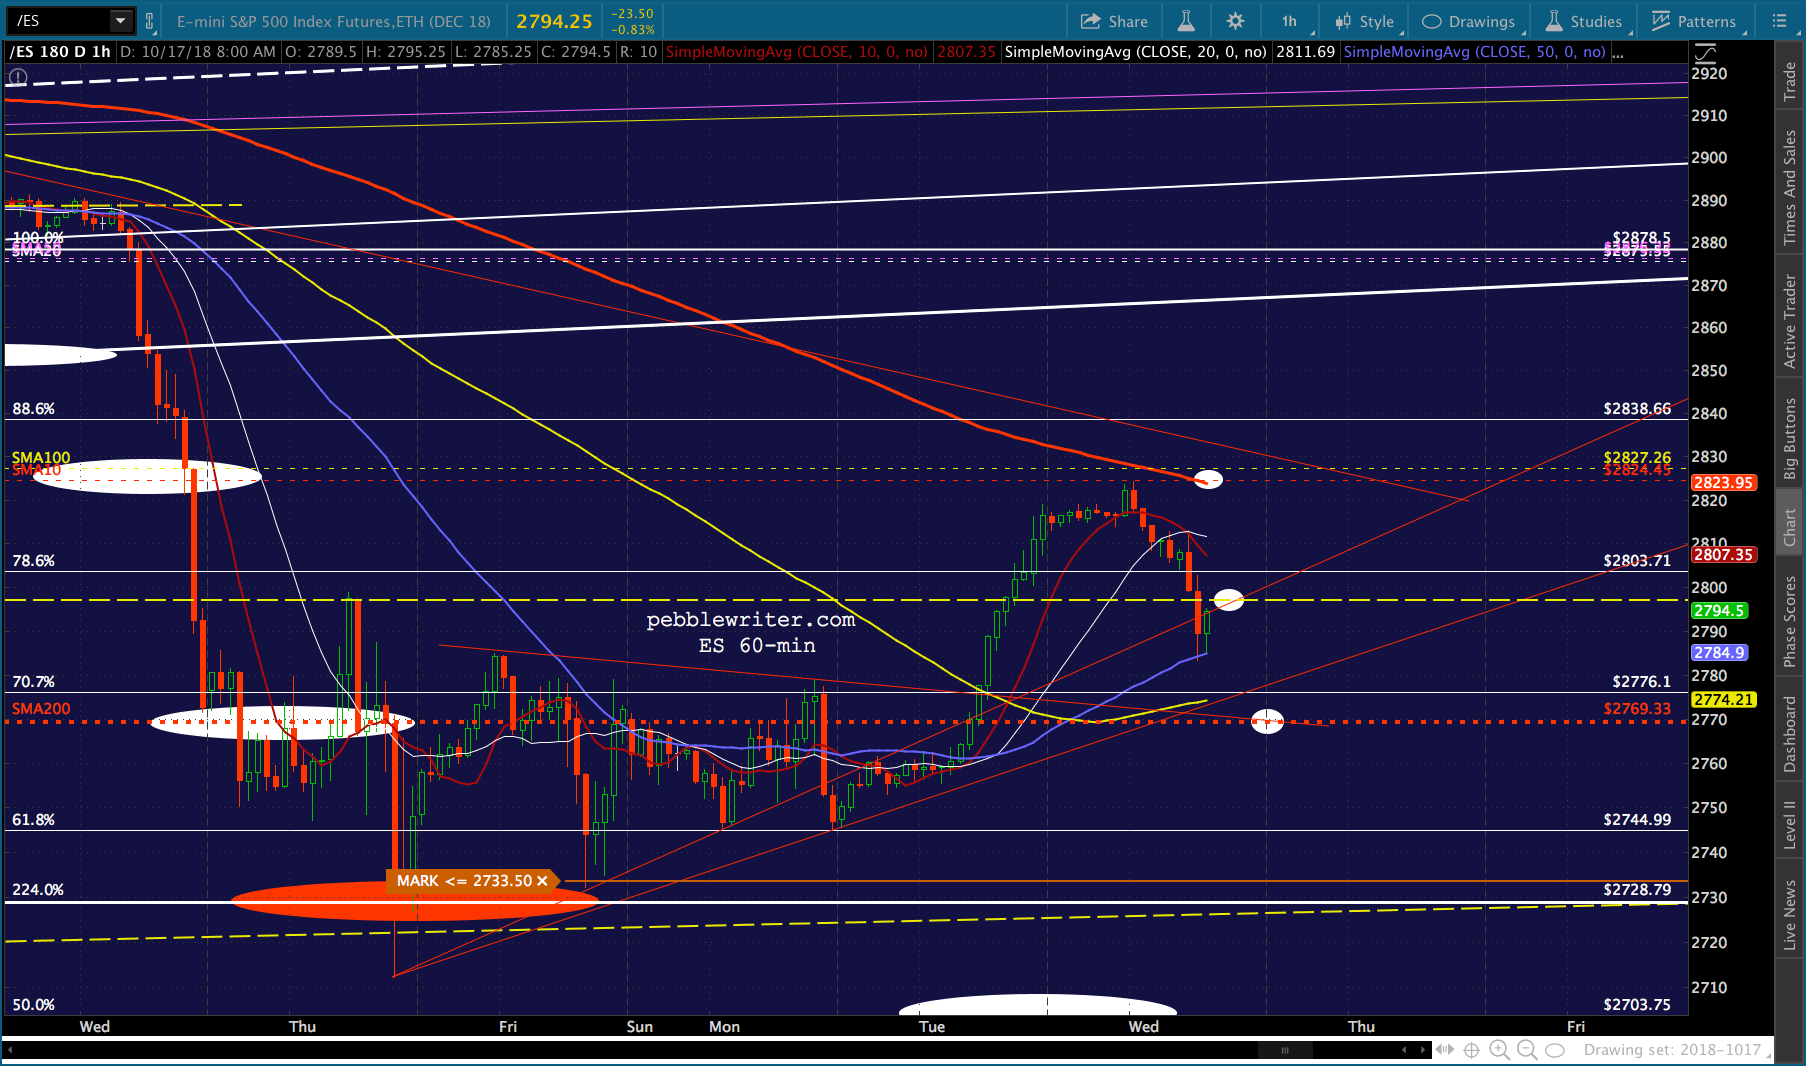
After being off as much as 15 points earlier this morning, futures are showing an 8 point loss. This, after a massive short-covering meltup yesterday that accelerated once the SMA200 was topped.

It remains to be seen whether the gains will hold when RB and CL sell off big.
continued for members…
Note that CL is dipping below the red TL…
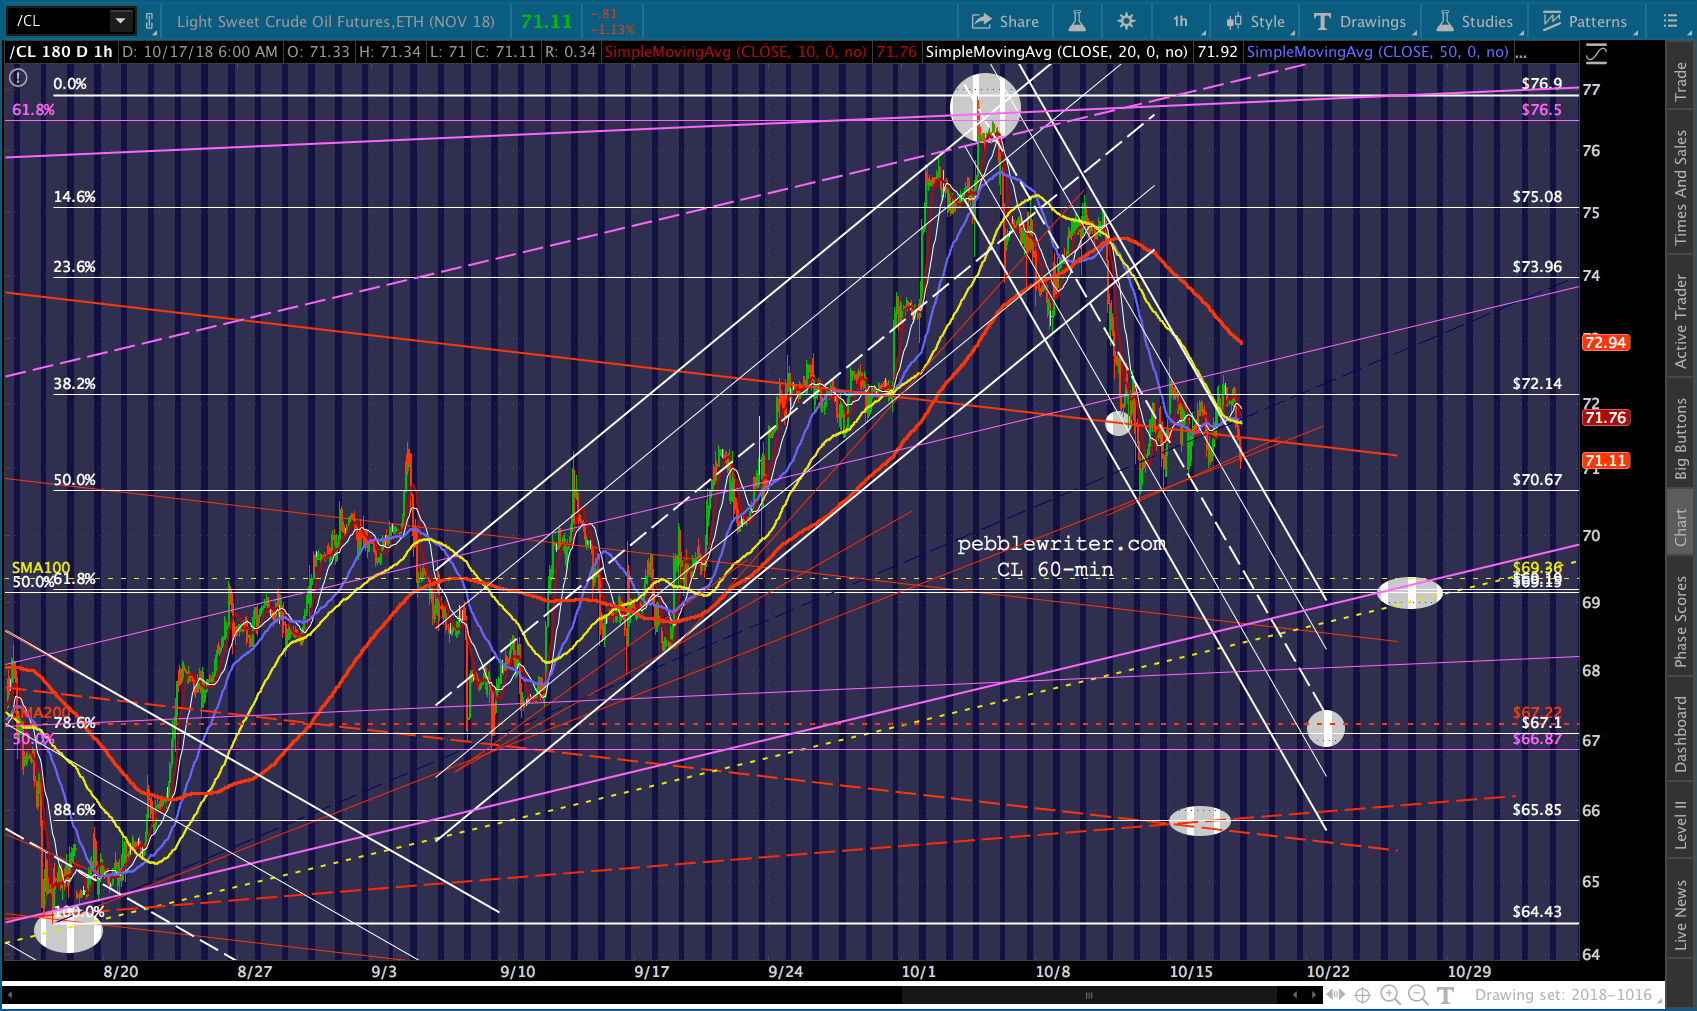 …and RB seems to be balking at an SMA200 backtest.
VIX has reached a good reversal point.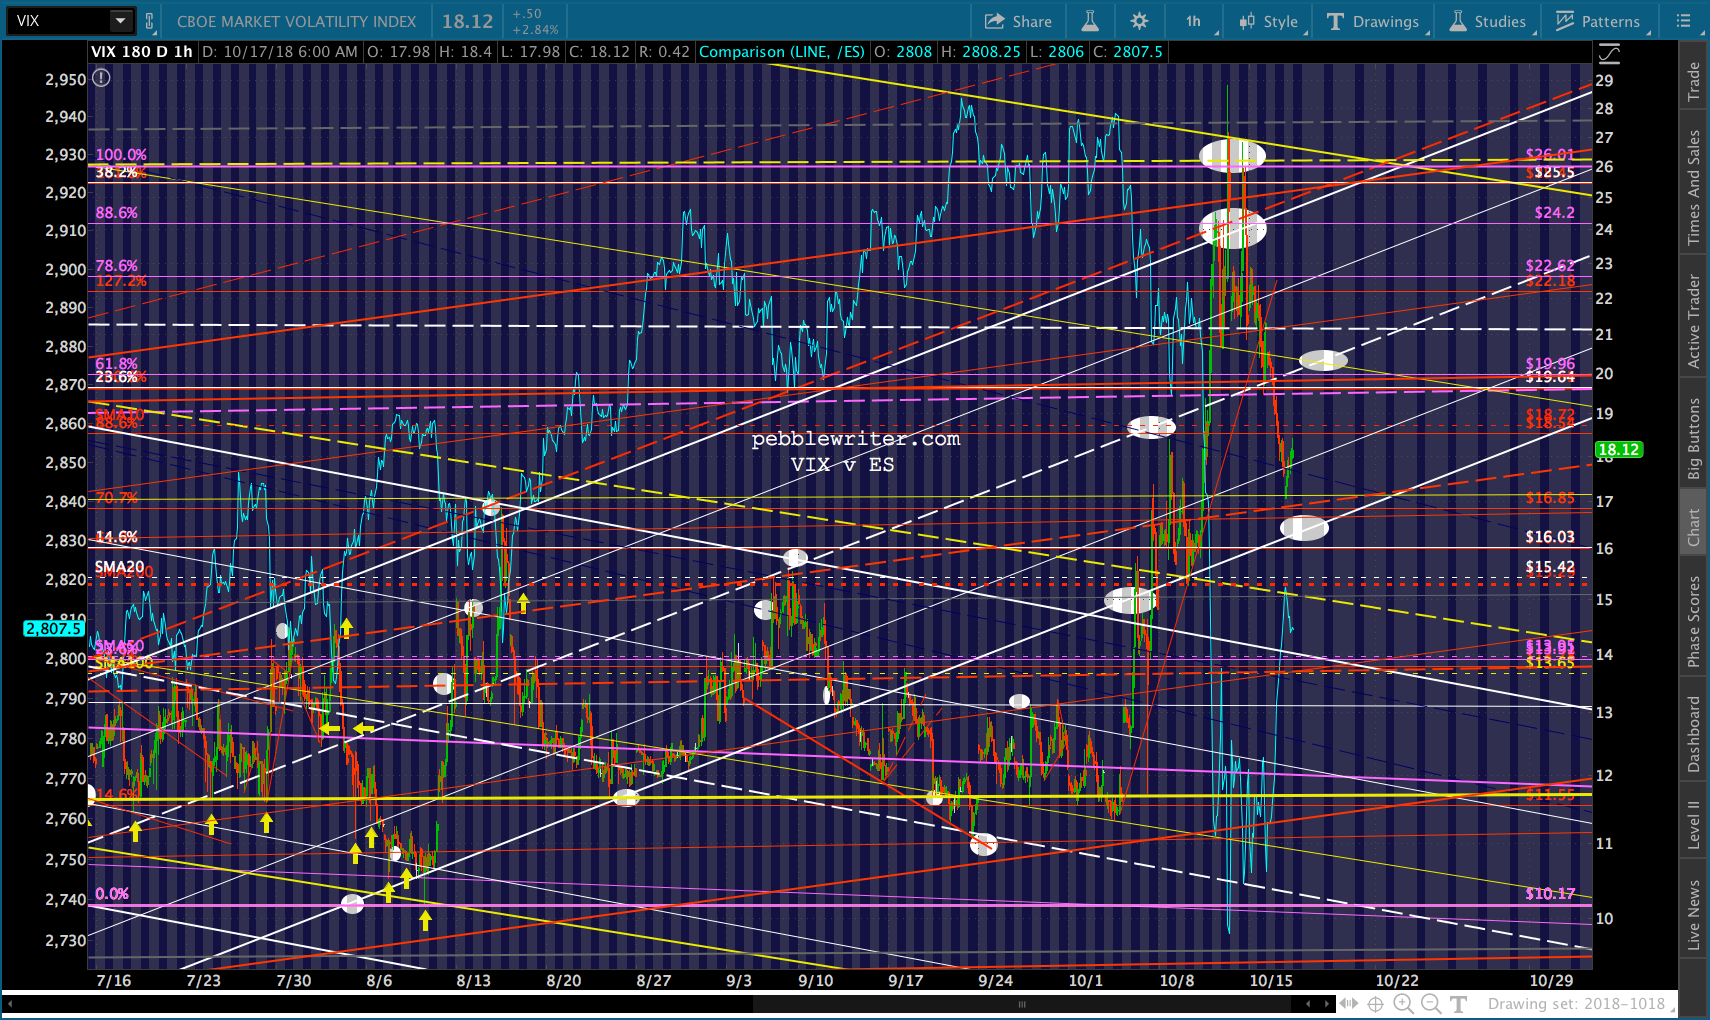
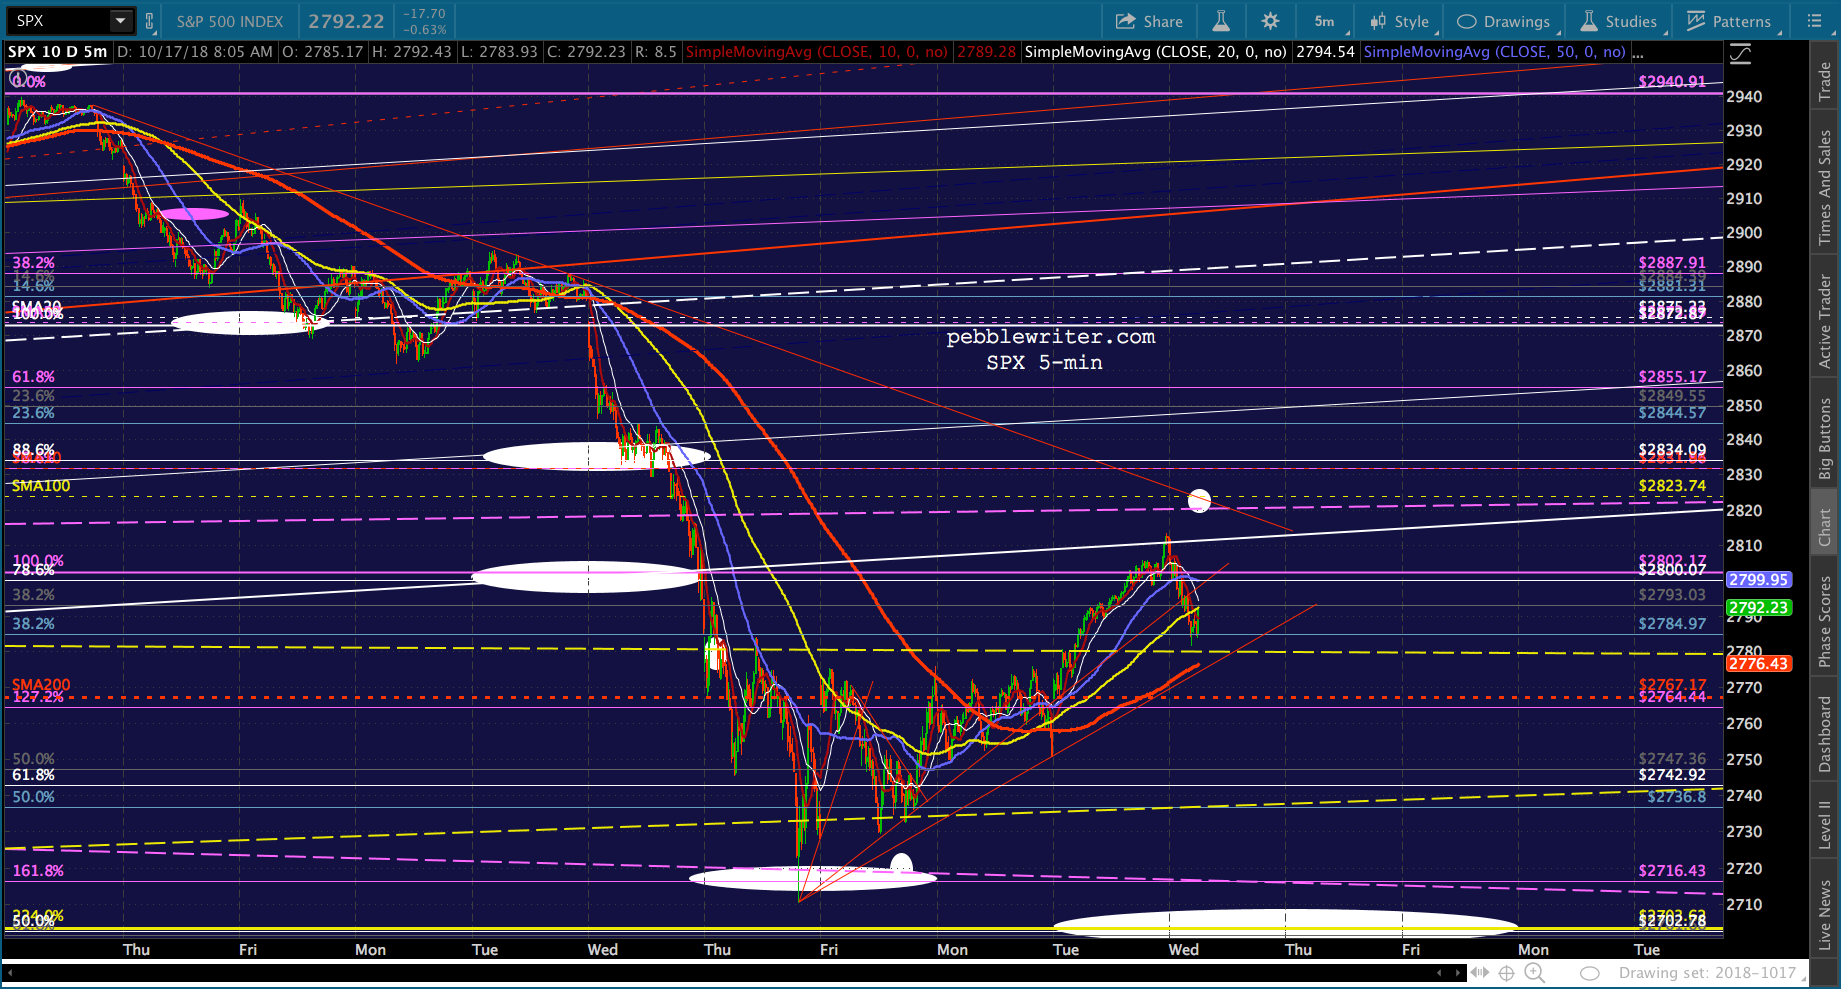
While SPX is backtesting the white channel which broke down last week. We’ve had many instances this past year or two of SPX rejoining a broken channel. So, I’ll not be shocked if it happens again — the power of algos, etc.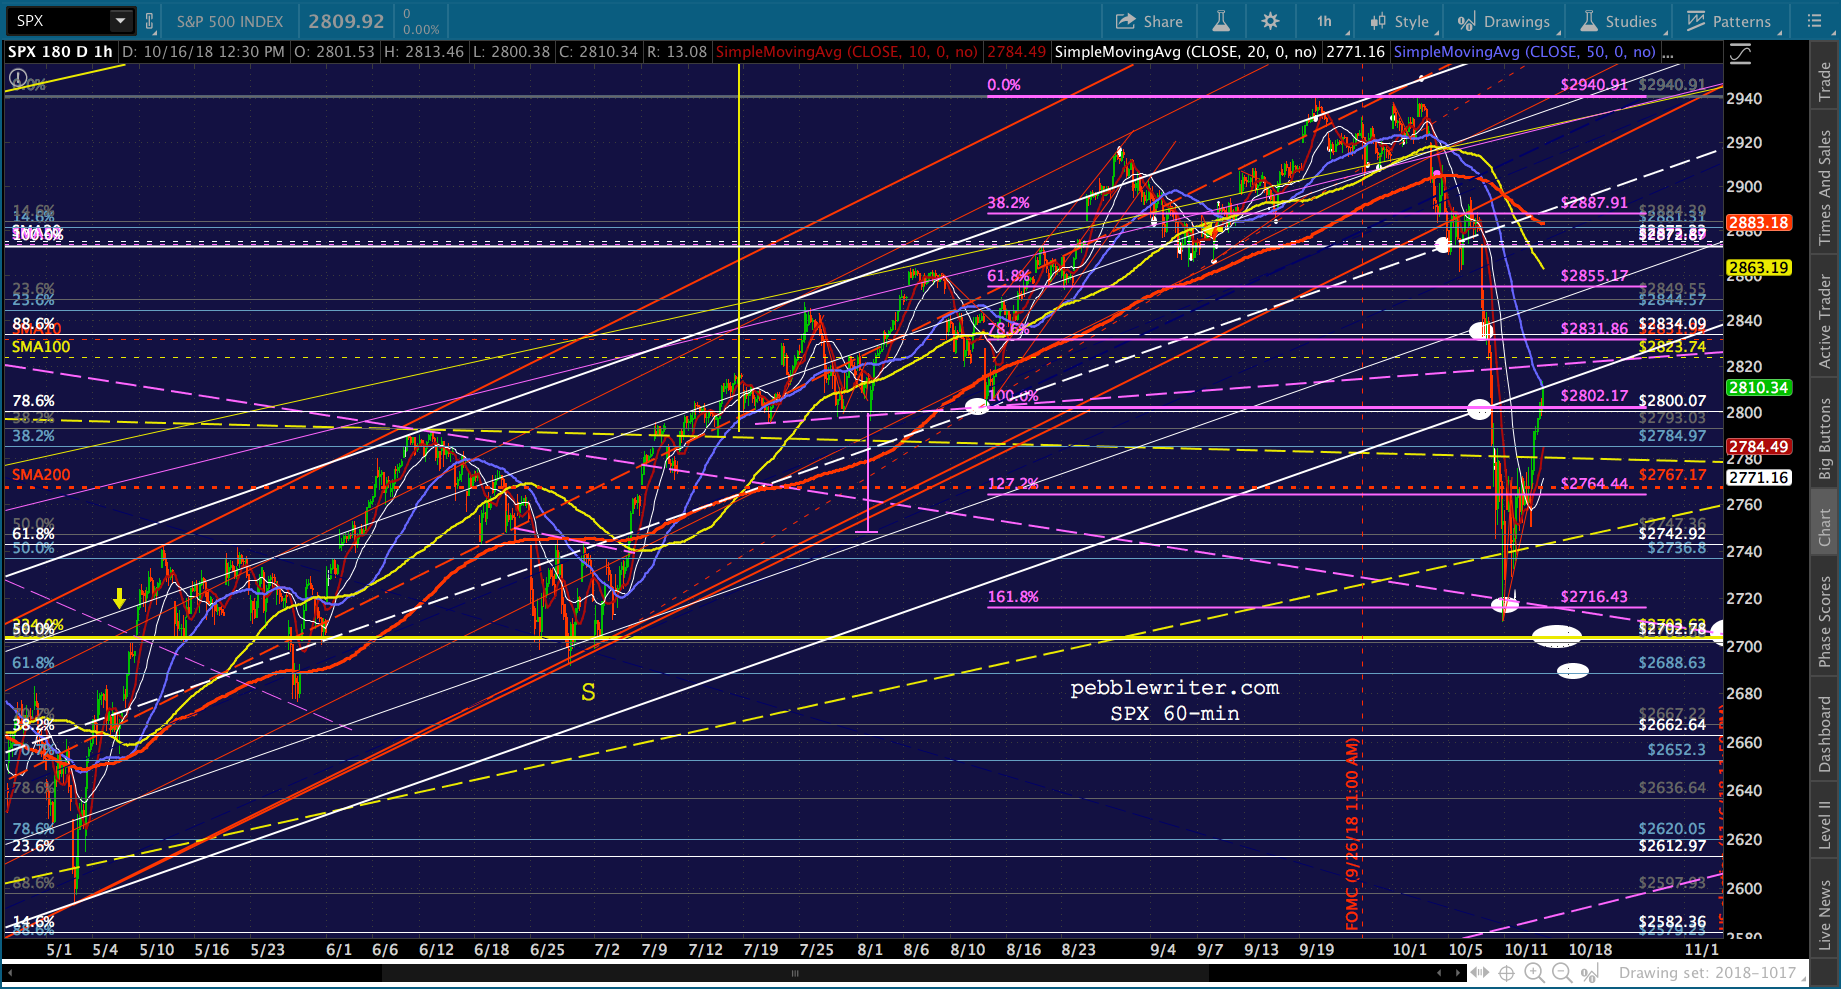 But, there are several charts pointing towards a late October (22-23) hiccup, which could turn into something bigger. The failure to backtest 2703 is still staring us in the face and, in my opinion, should be resolved before any big gains are attempted.
I believe we go lower from here and would recommend shorting for anyone stopped out during yesterday’s meltup. There are a number of potential targets between here and the SMA200.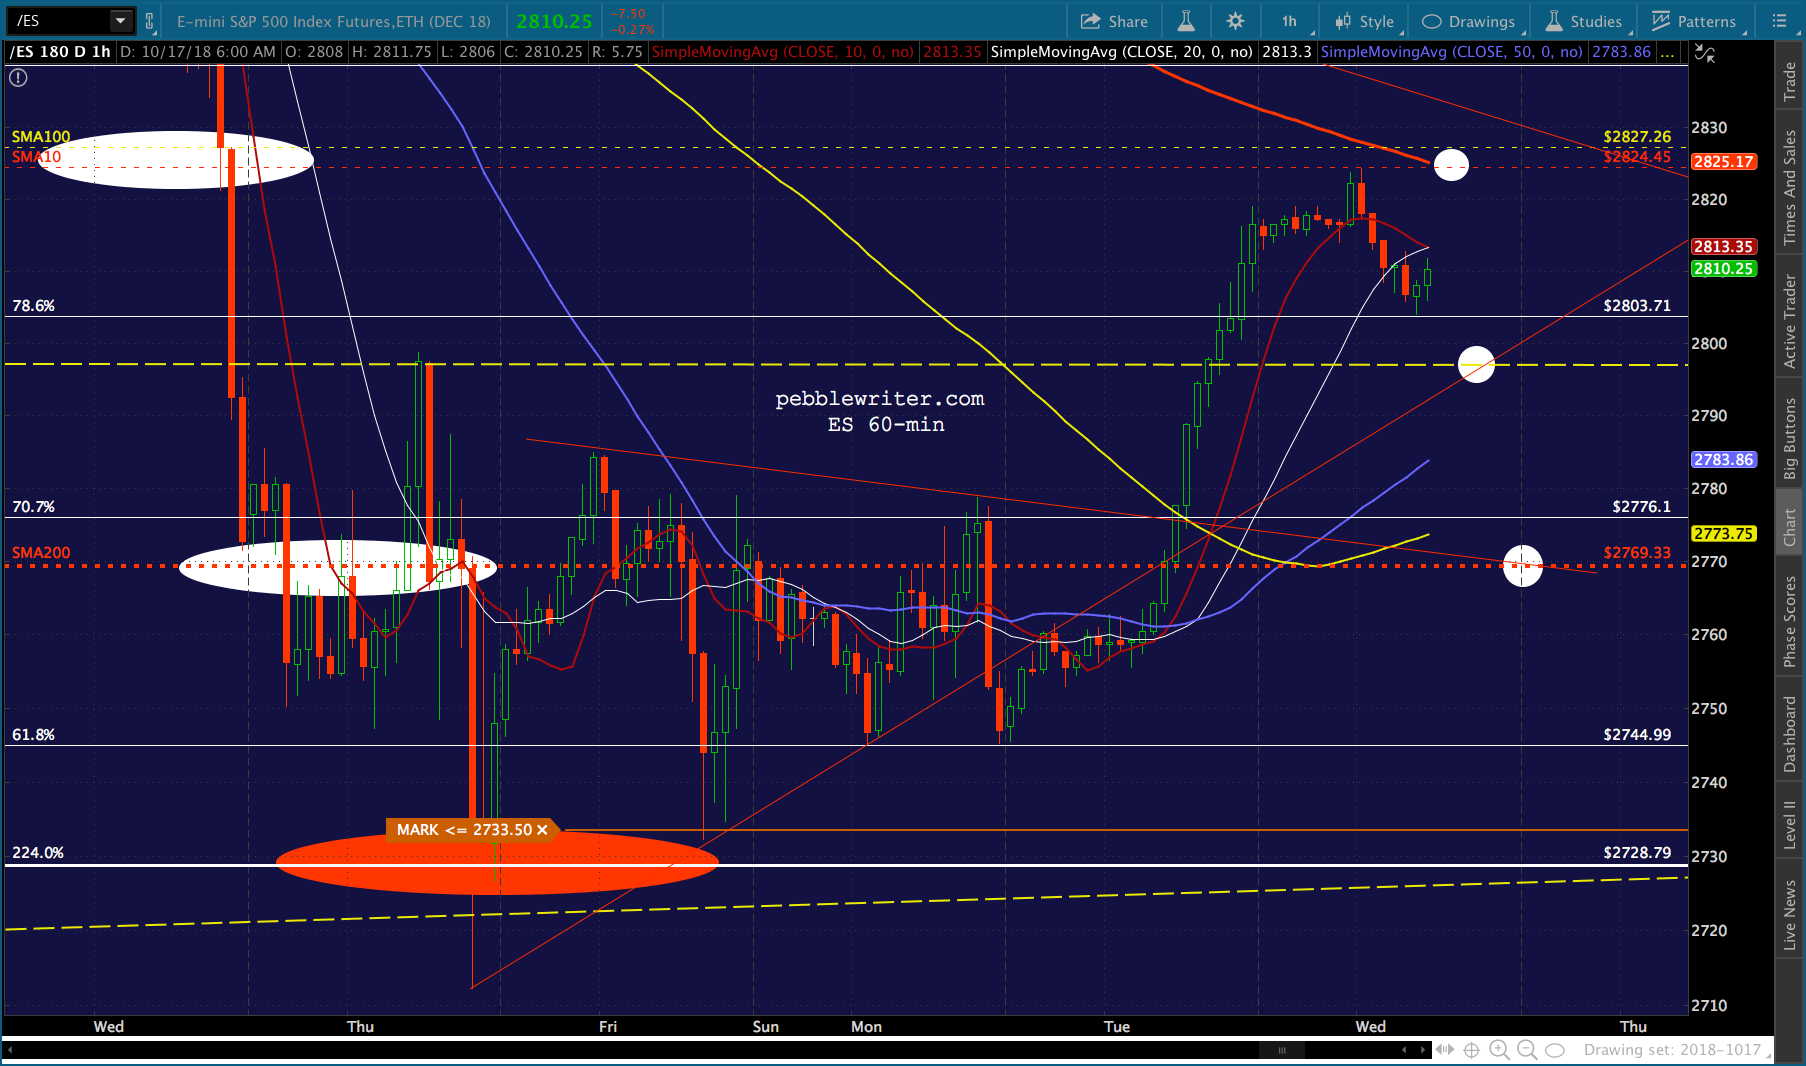
But, keep an eye on SPX’s 5-min chart. A push above the SMA100 and red TL would trigger more buying.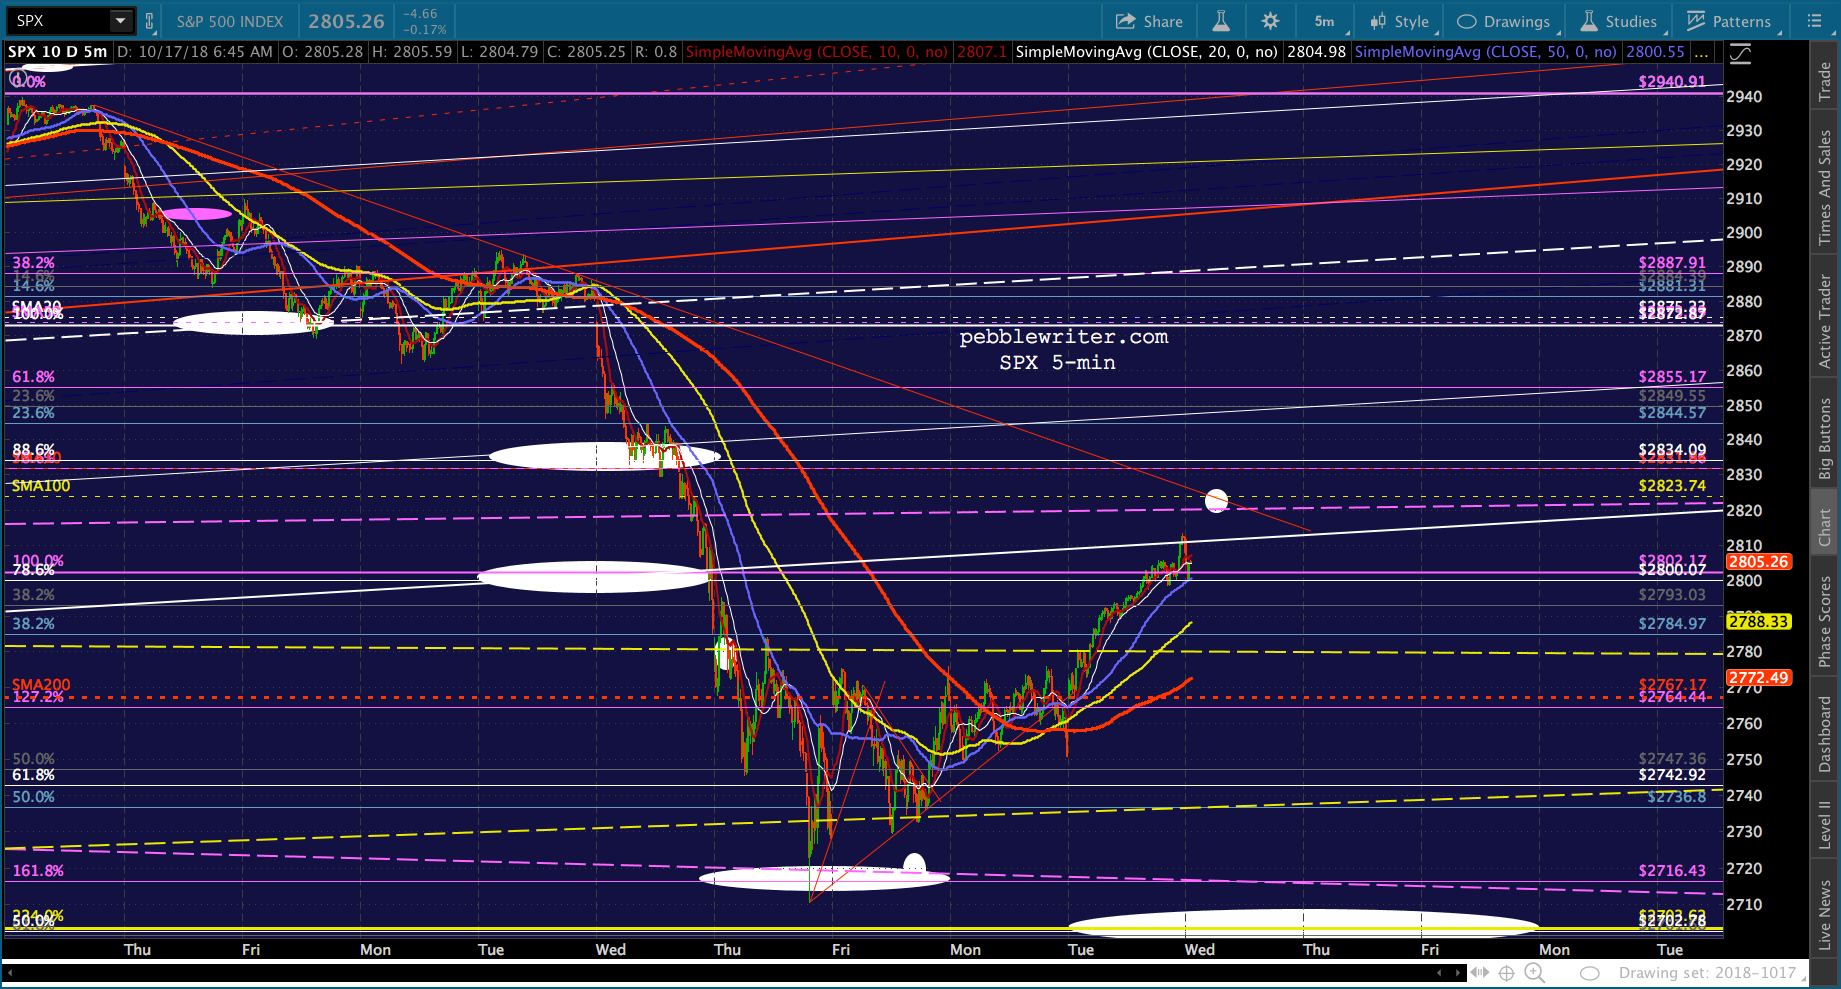
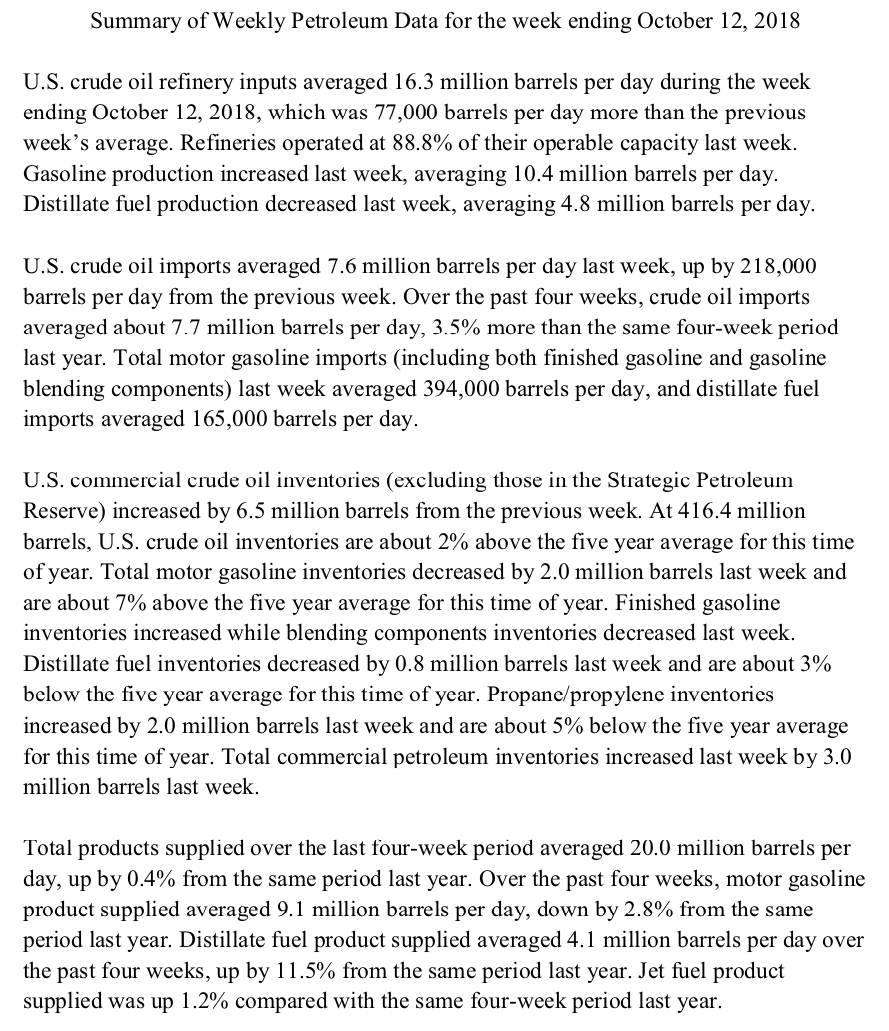
And, watch at 10:30 for the EIA’s inventory report. If Trump is as serious as he claims to be about getting gas prices back down, this would be an opportune time to massage the numbers. Yesterday’s API report showed unexpected draws in oil and gas.
One other chart to keep an eye on: COMP. Note that after lingering below its SMA200 for several days, it suddenly popped back above. The rising red channel, however, remains broken.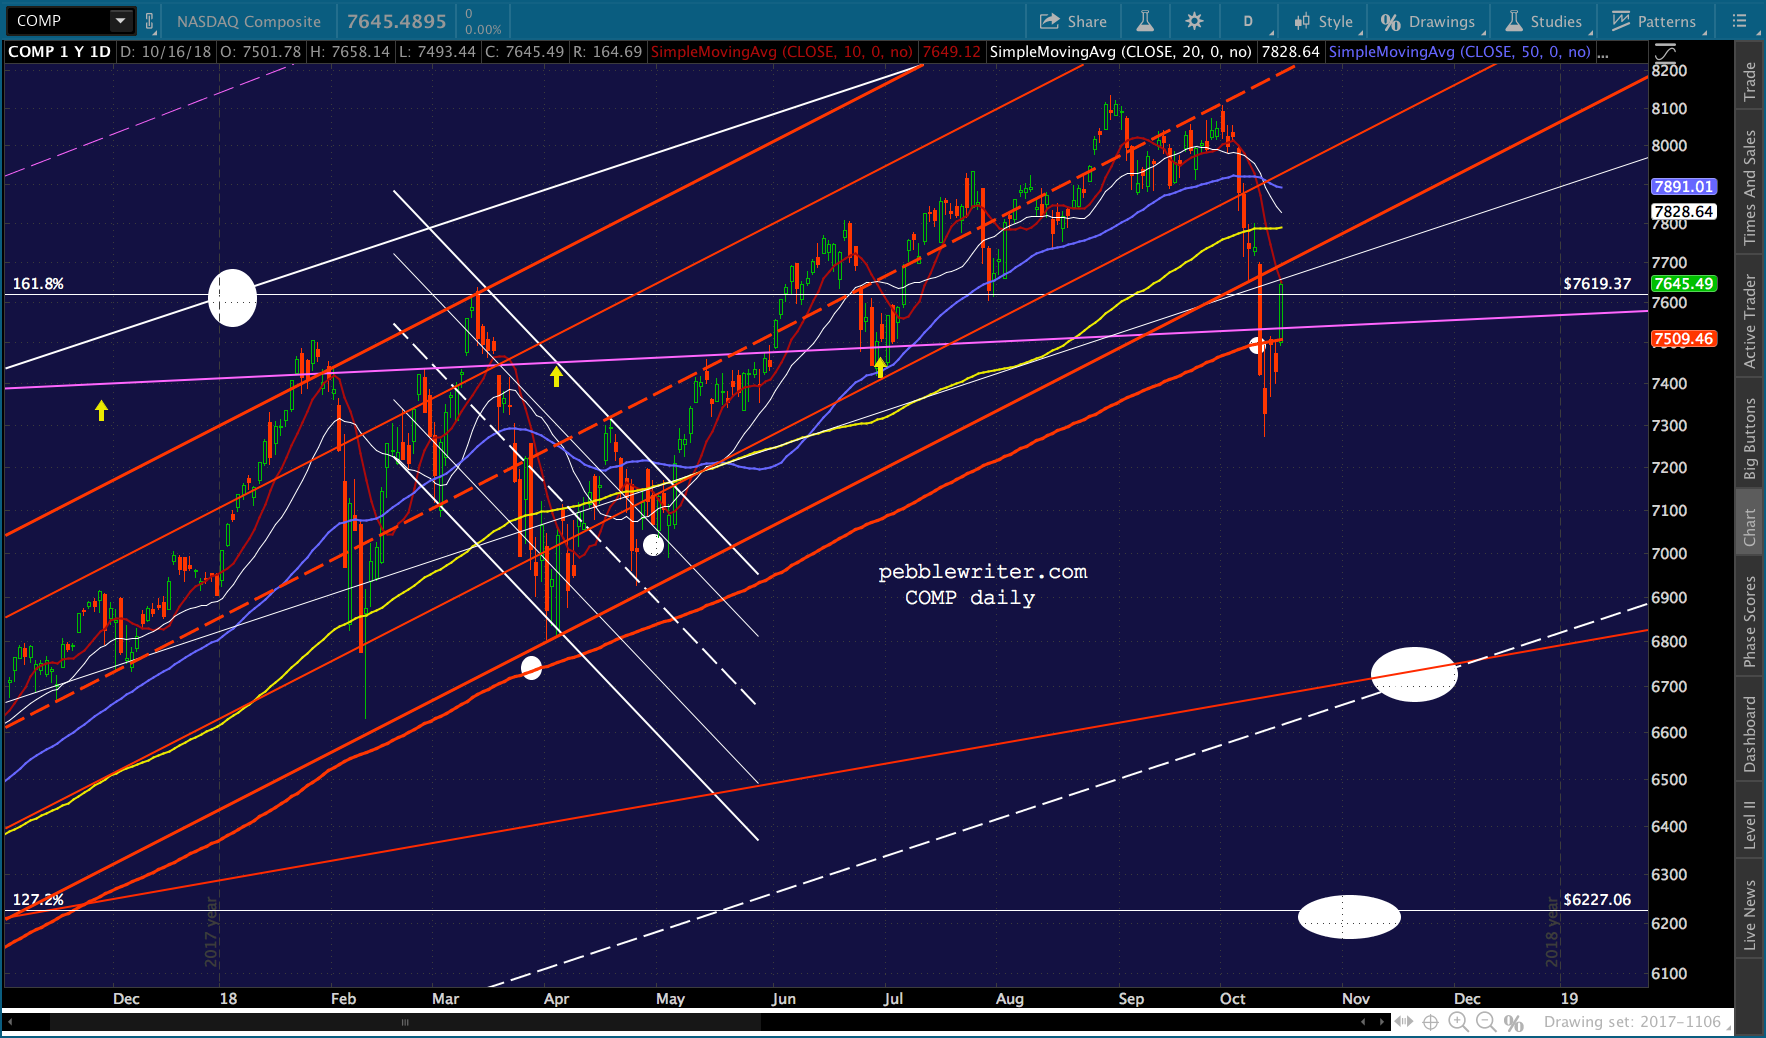
The currency picture has not changed. DXY is back above its red neckline.


 UPDATE: 11:00 AM
EIA’s was certainly more bearish than API’s report…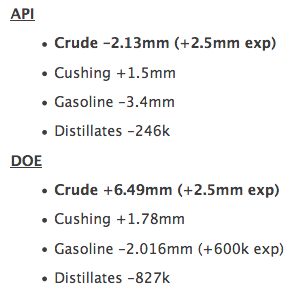
 CL and RB are both off nearly 3%.
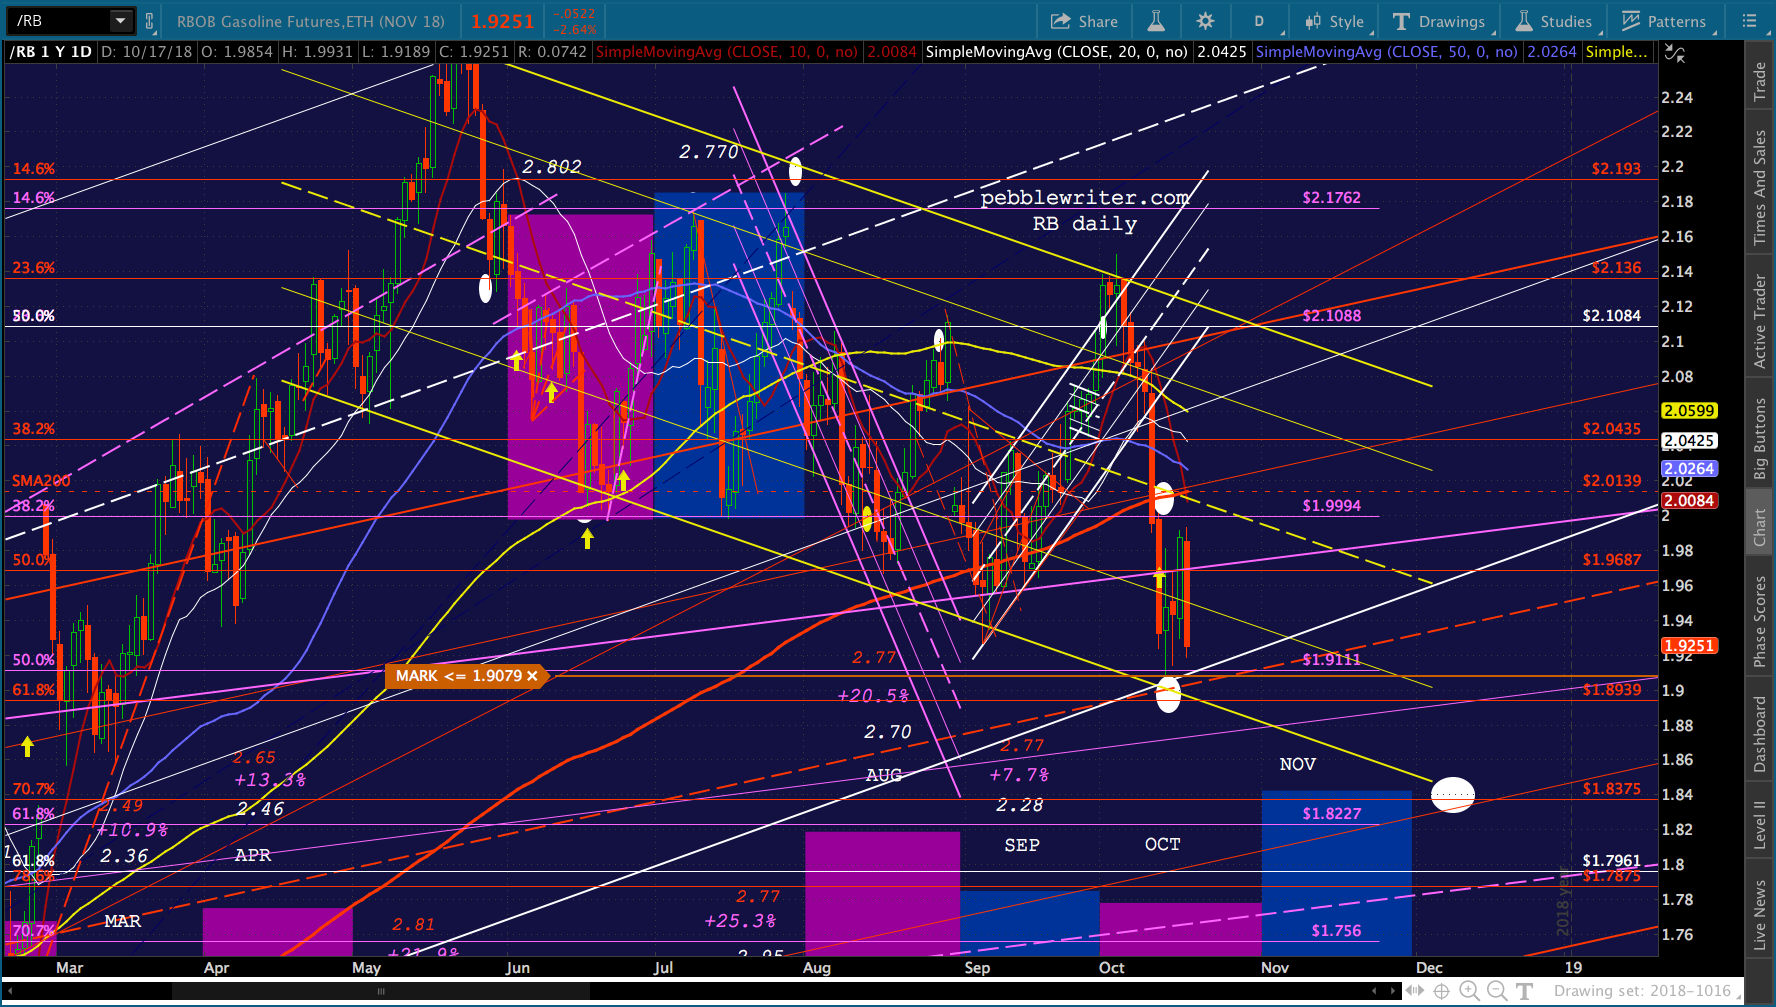
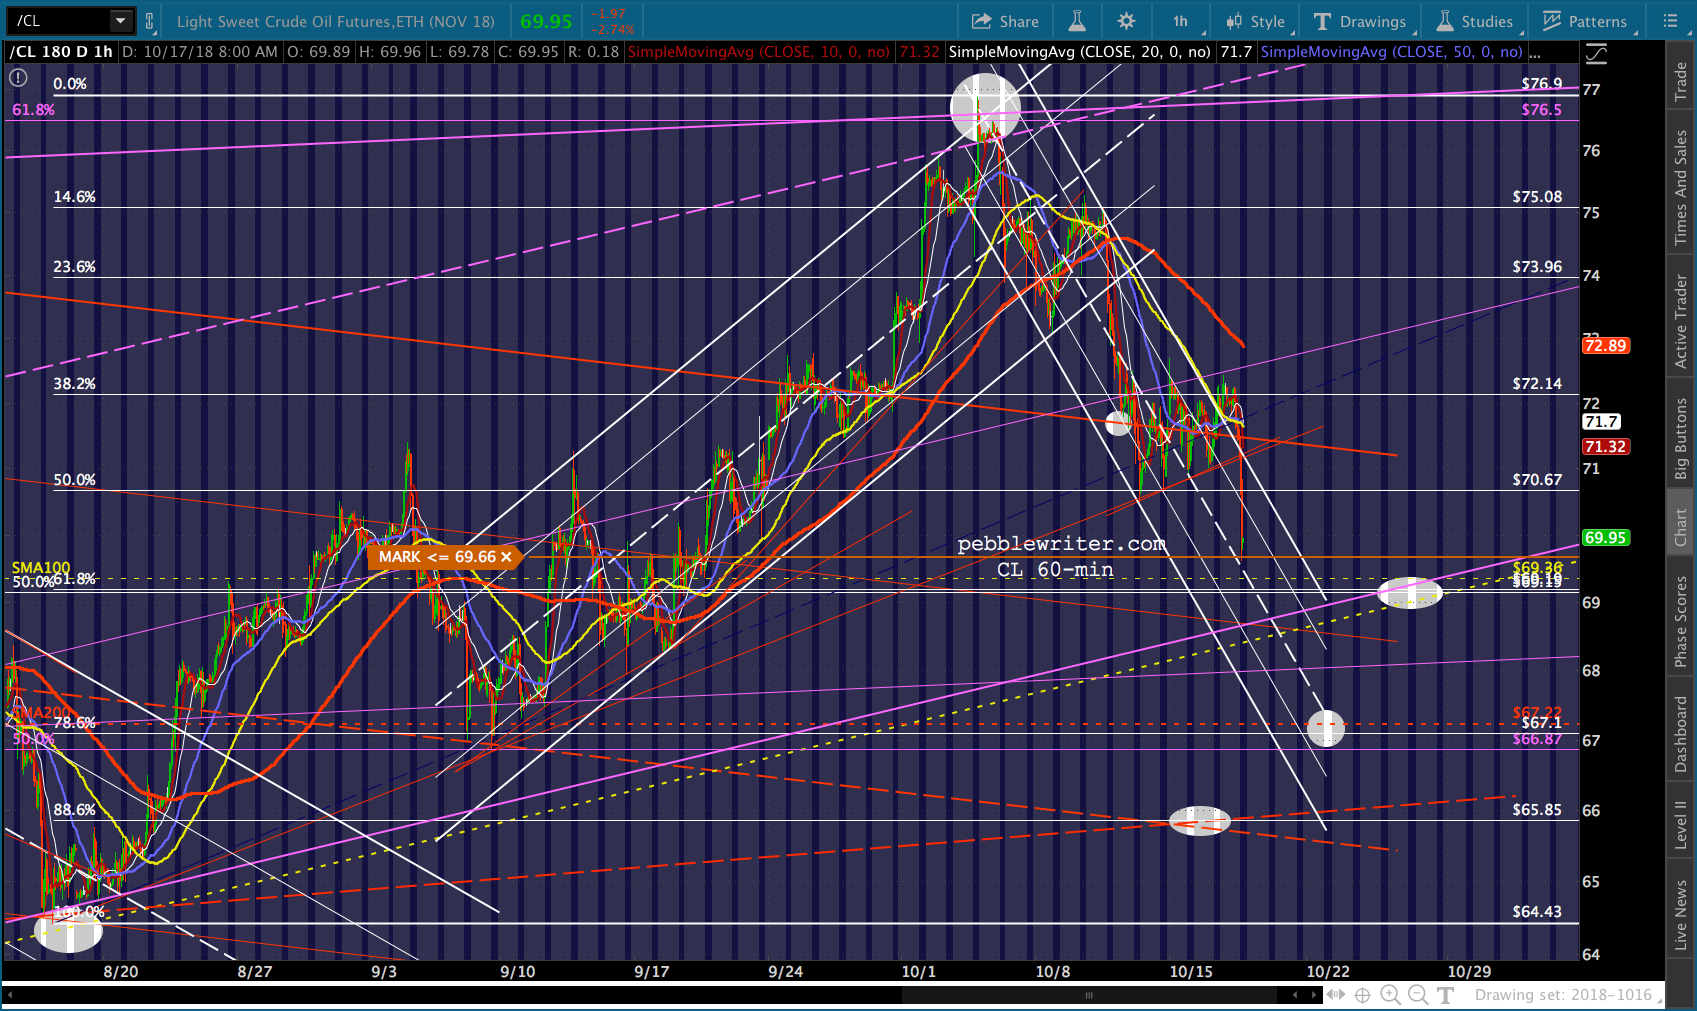
Since ES and SPX can both fall a little further without their uptrends being at risk, I suspect both RB and CL will continue lower until reaching their .618s. Just be wary of a reversal at SPX’s TL and SMA200. It would be unusual for RB and CL to continue lower at the same time that SPX is meant to bounce higher.