

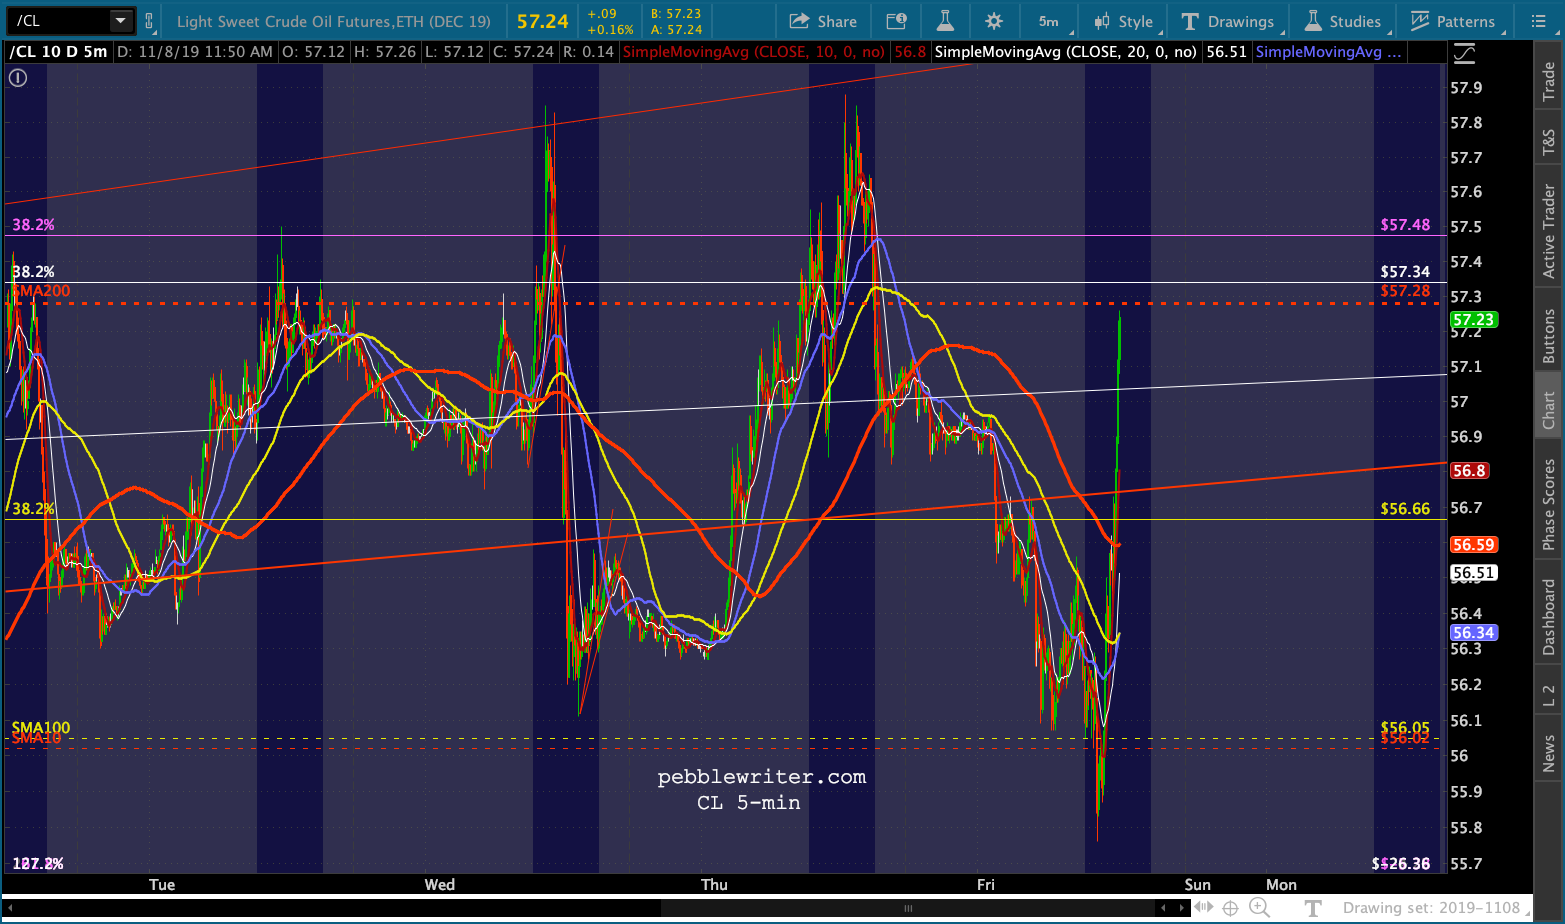
It’s not too surprising that there’s been a firm floor under oil and gas prices, given the upcoming Aramco IPO. But, isn’t it funny how CL has popped above its SMA200 every single day this week, even in the wake of dismal inventory data?
 Just like it’s funny that ES, which pretty obviously should have given up all its overnight trade data related gains should have given up at least most of them after the Reuters laid a little trade truthiness on us.
 If it had done so before the close, ES would have put in another bearish-looking daily candle. But, it waited until later in the evening, which allowed ES to leave a bullish candle in its wake. Funny how that happened.
 VIX is well-known for timely “breakdowns” that last anywhere from a few seconds to a few minutes which remind the algos of the glory which awaits them if they’ll simply buy-buy-buy. Today, like yesterday, it hit at exactly 9:00 AM – about the time futures were trying to decide whether the market should open in the green or the red. Watch for it to happen again if stocks should have the nerve to slip lower.
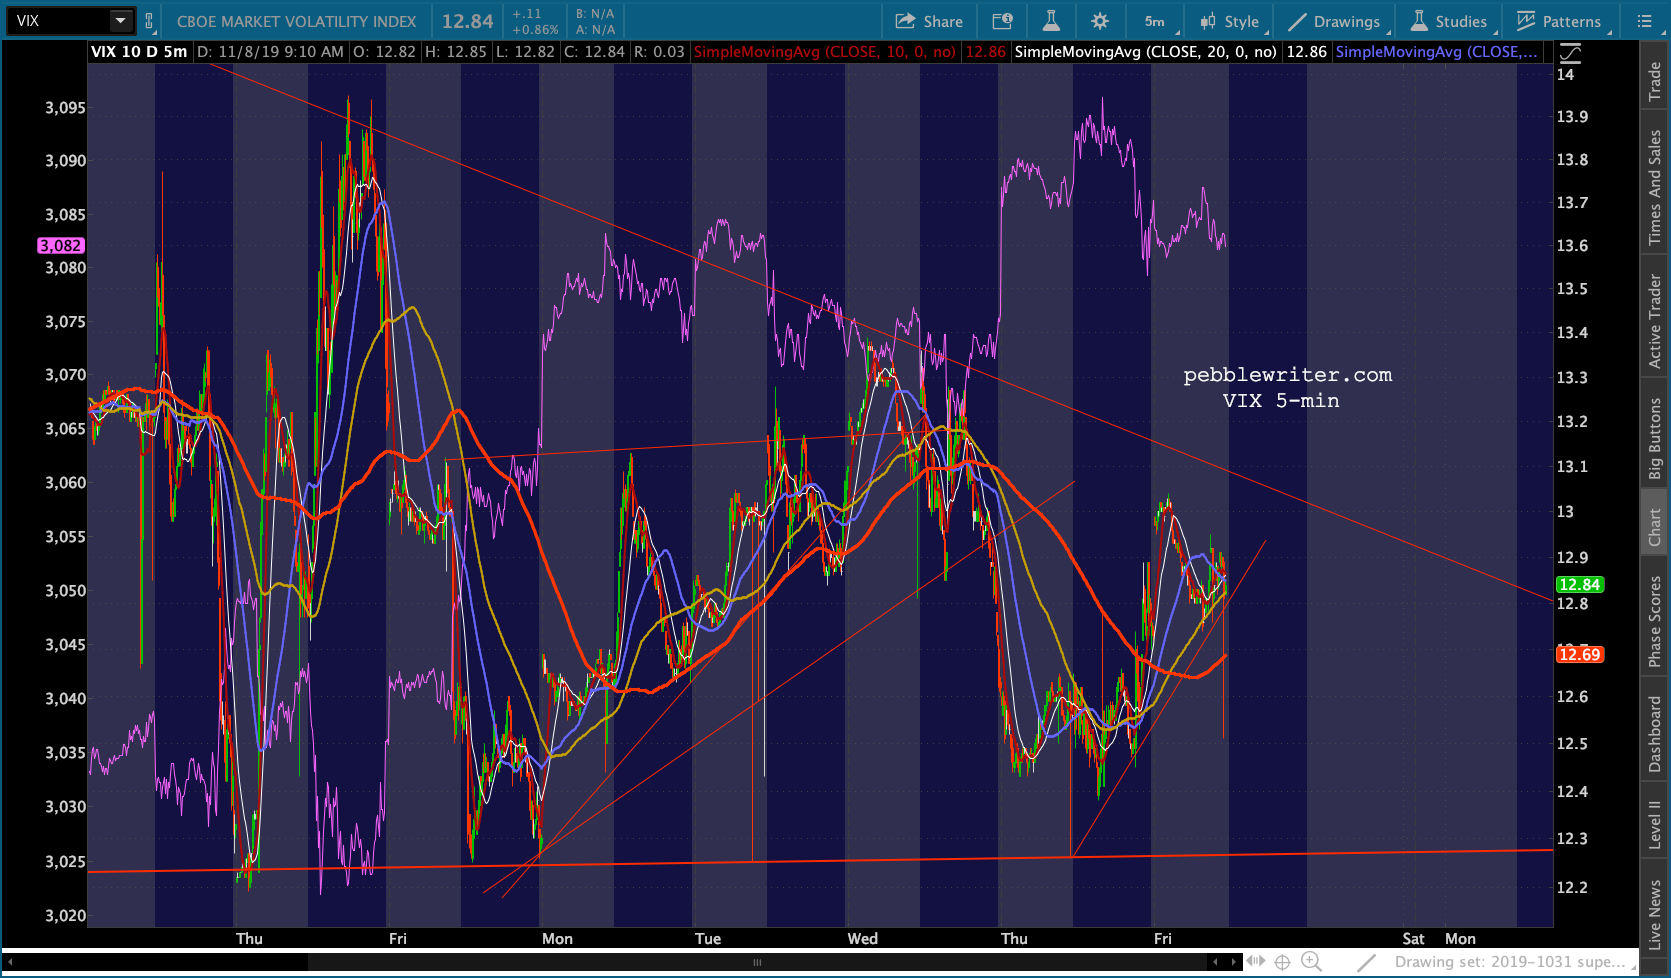 But, the champion of bullish appearances has to be the USDJPY, which has reminded us of its incredible upside potential over the past month, repeatedly pushing above its SMA200 and pumping the Nikkei 12% in the process.
 Combined with timely soundbites from the White House on the incredible successes being achieved on the trade front, the market can’t be blamed for ramping higher most every day. But, what happens if the narrative changes? What happens if one or more of the factors fueling the machine runs dry?
continued for members…
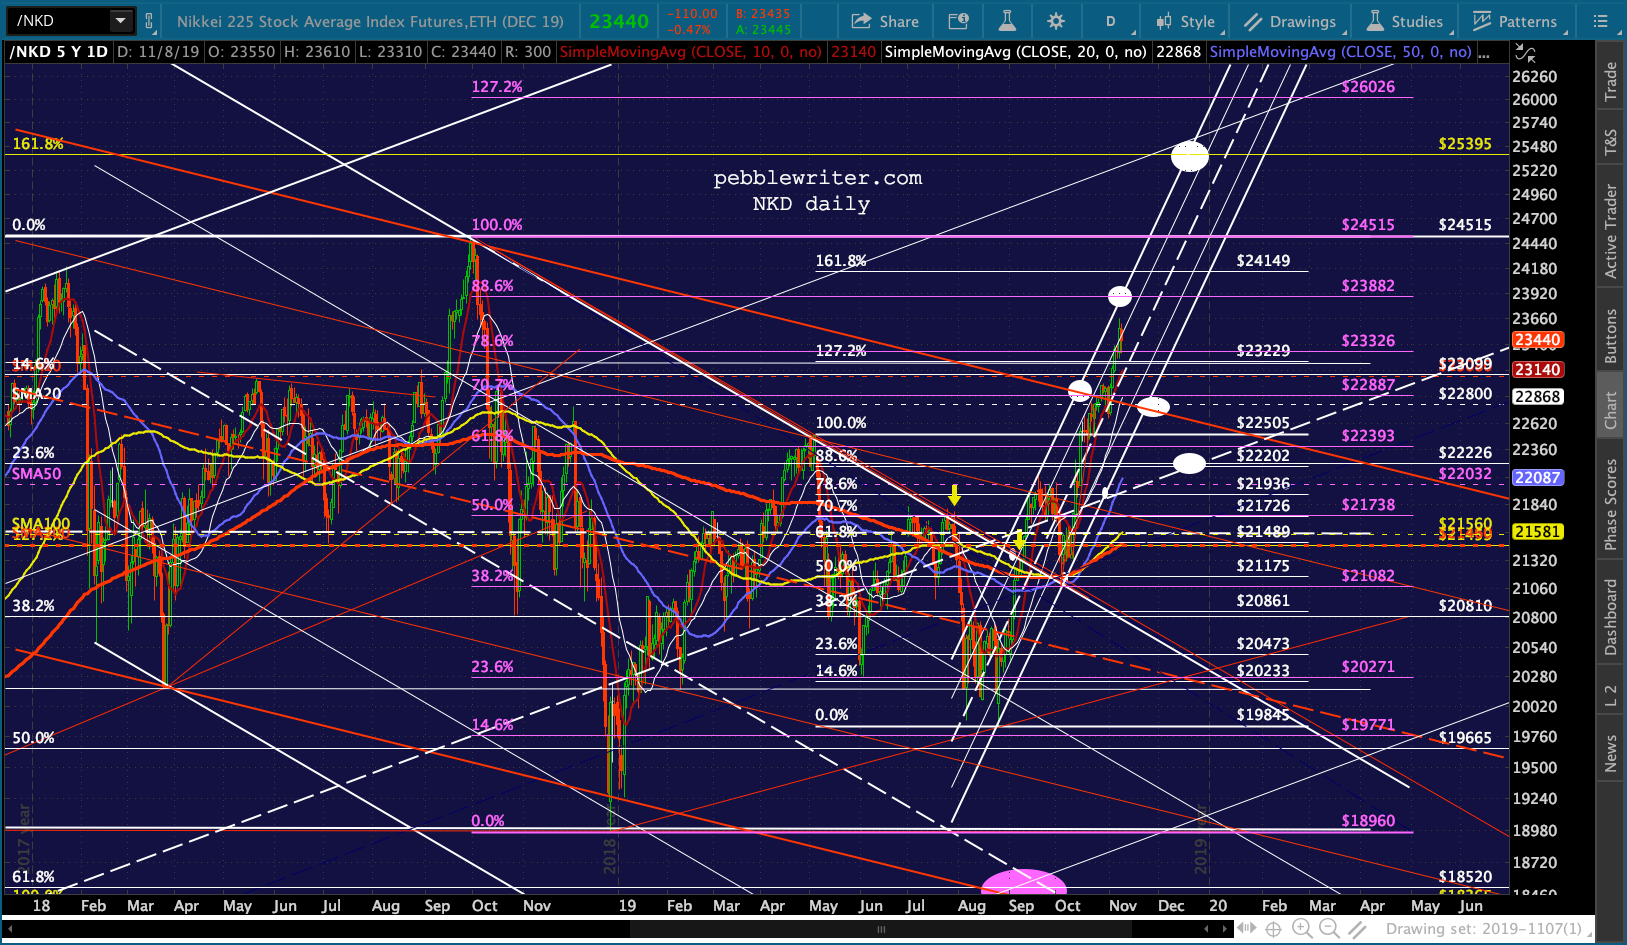
Like CL, USDJPY is on a mission. In this case, it’s working very hard to get NKD to break out to new highs like all the other major indices. As the weekly chart shows, it’s been working on reaching its 1.618 since Jan 2018.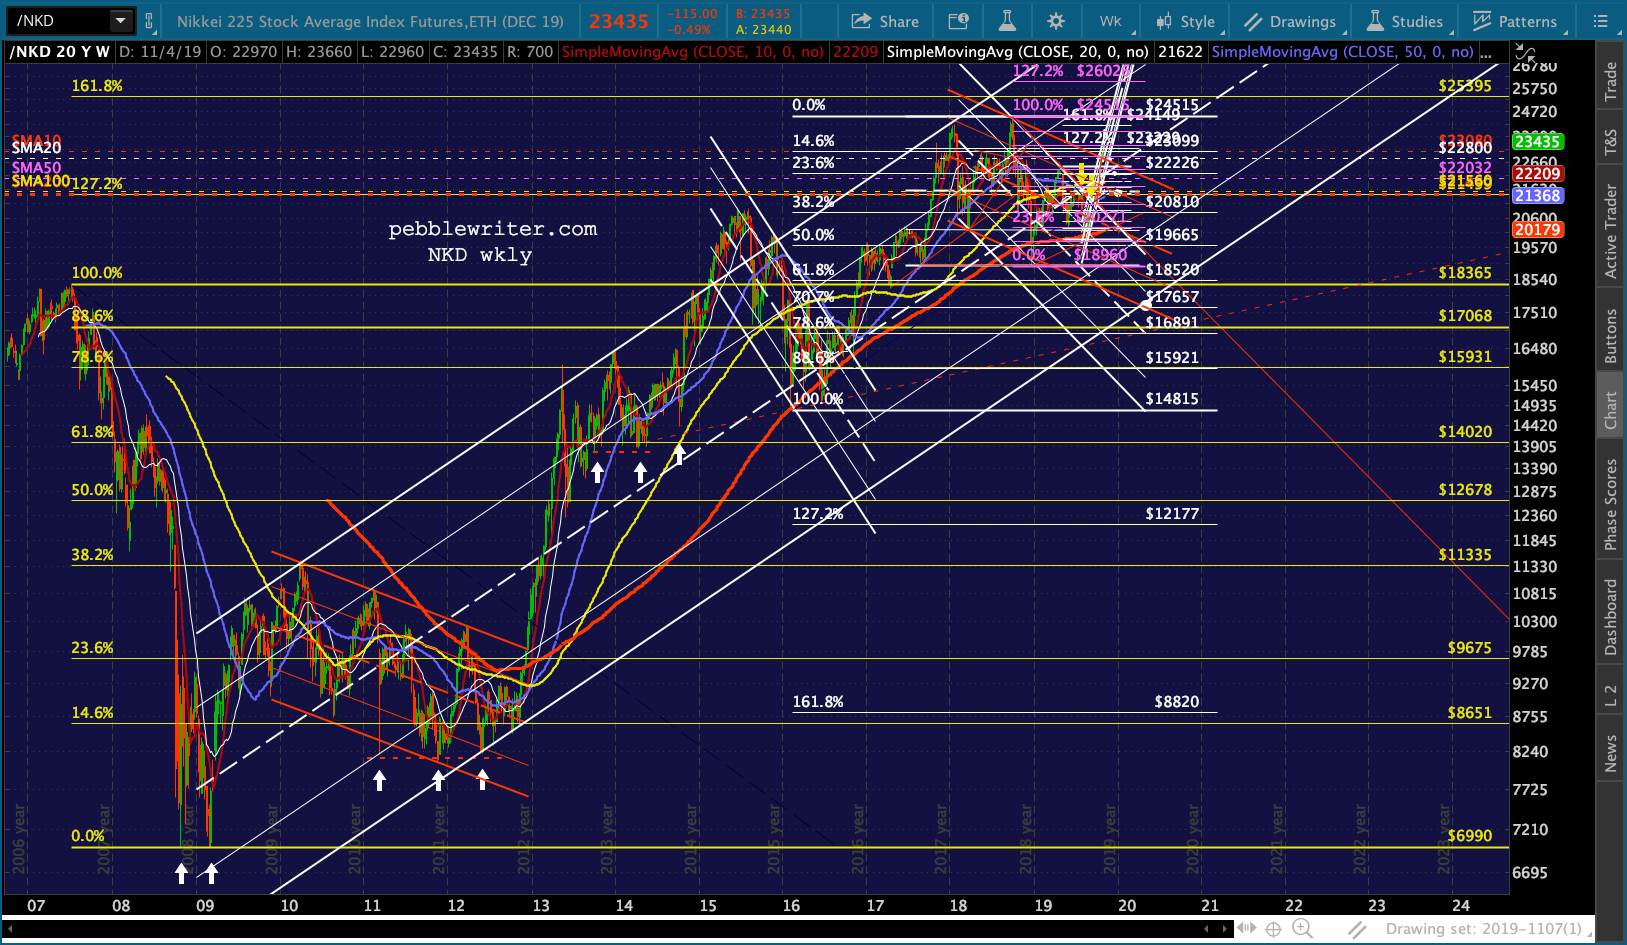 The Nikkei fell 62% between 2007 and 2009. By Jan 2018, it had posted a 246% gain off its lows. It couldn’t quite make it. It tried again in October, making a higher high but failing again. At that point, there were two pretty convincing looking falling channels it could have taken in order to flesh out the big rising white channel.
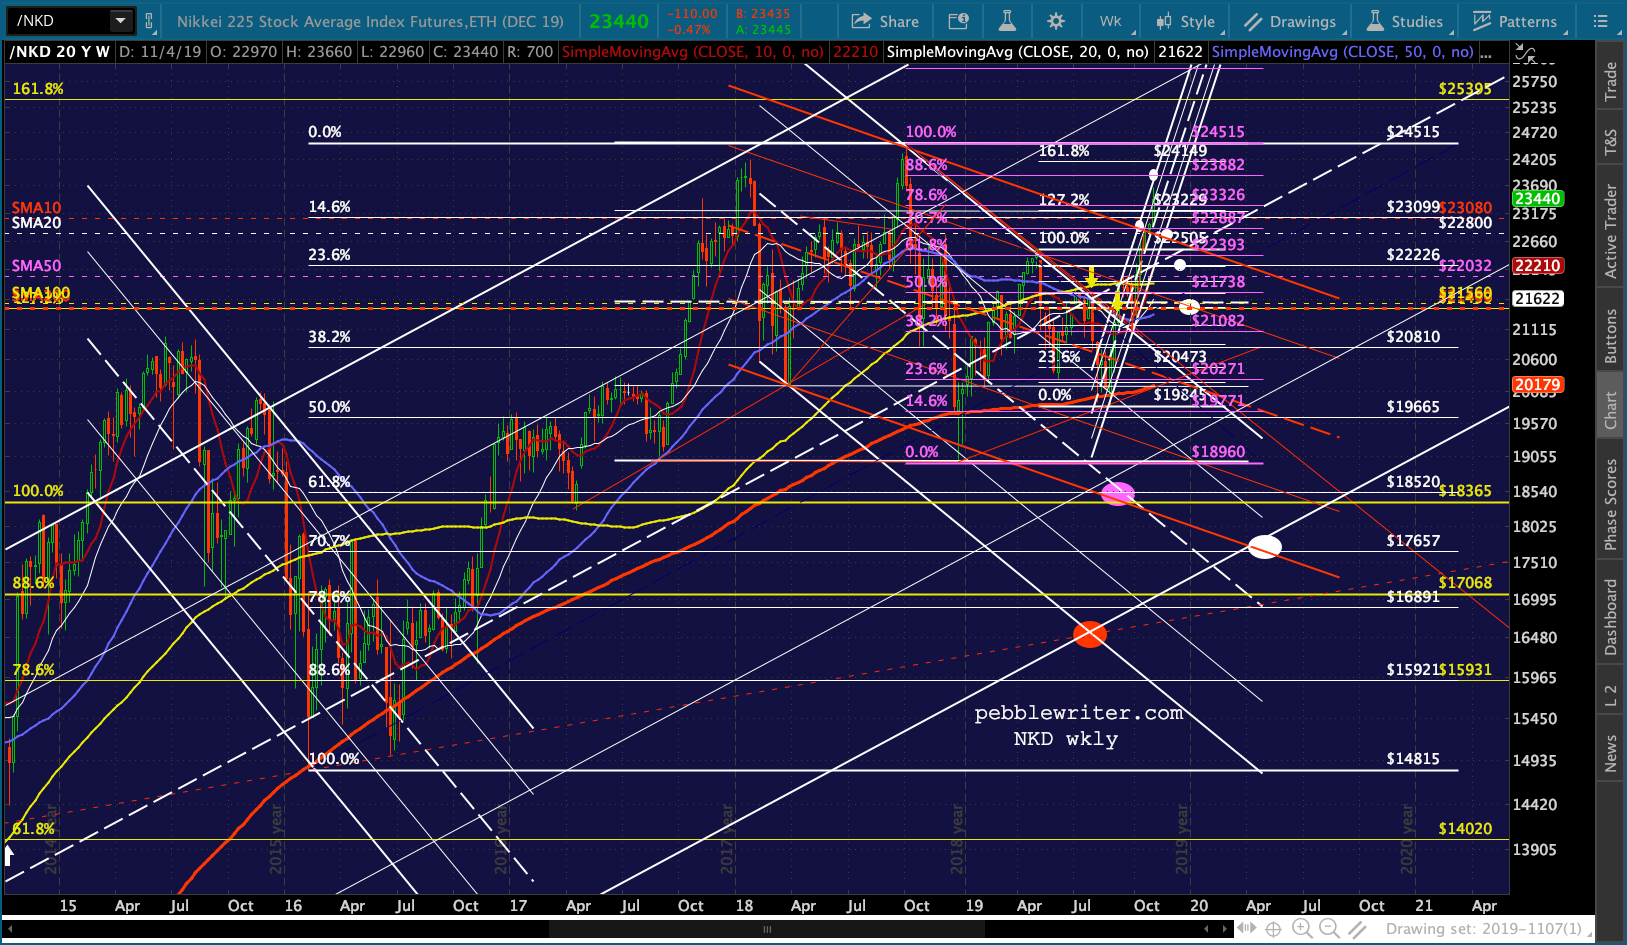 It broke out of the falling white channel in September and the red channel just last week.
 The white channel breakout happened when USDJPY broke out of its falling white channel. And, the red channel breakout occurred as the result of all the SMA200 “breakouts.”
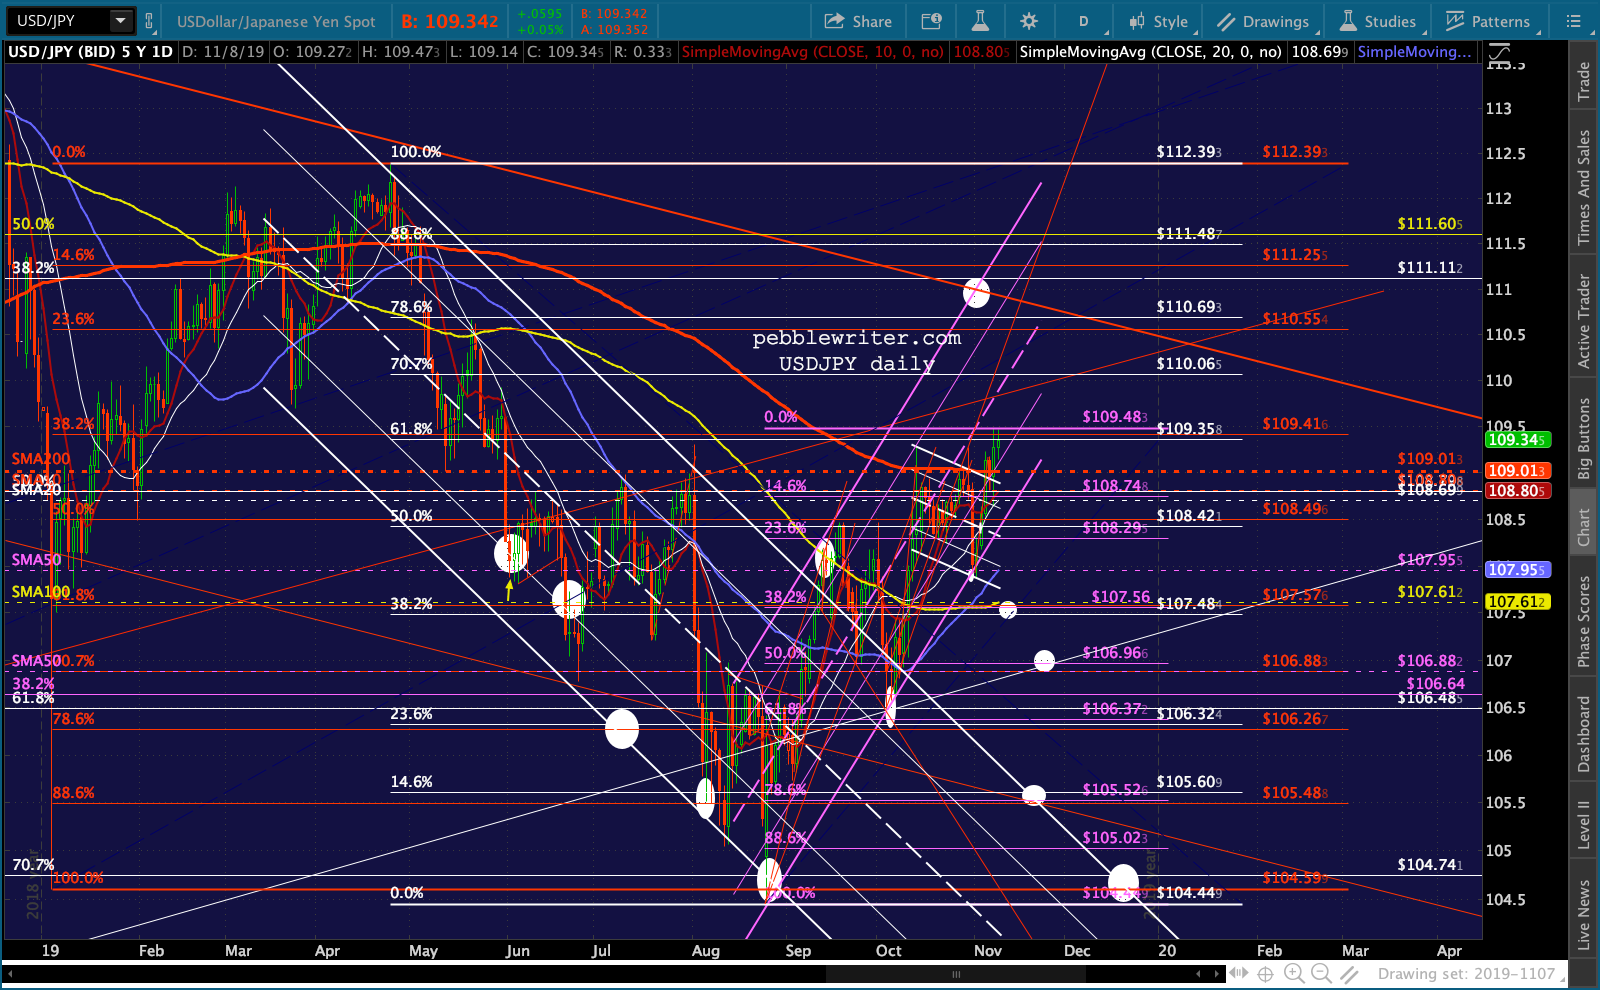 At this point, USDJPY is testing its .618 (for the 4th time since Oct 14) and is completing a big fat IH&S Pattern. If stocks get in trouble, or just need a nudge, we want to keep an watchful eye on it as a pop up to the red channel would be the go to rescue.
* * *
I spent last night looking at very long-term charts of the SPX. This is a close-up showing SPX bumping up against the midline of a long-term channel shown in purple and completing a Butterfly Pattern at the purple 1.272.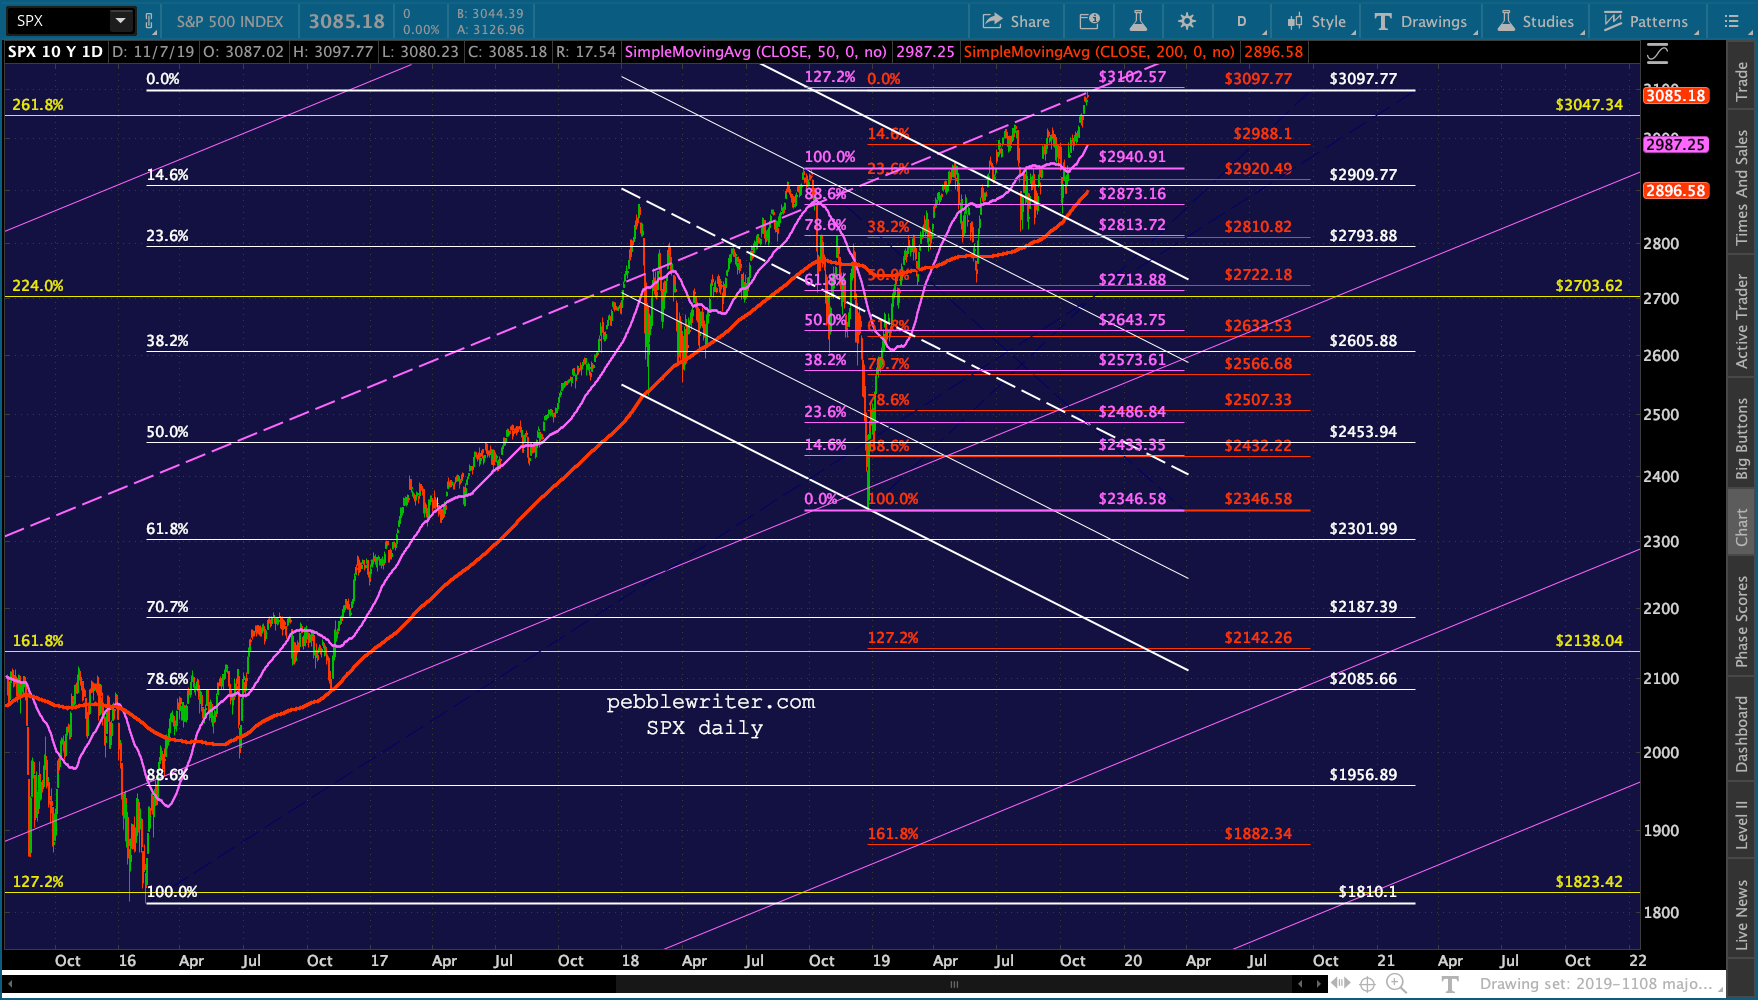 I’ve left the falling white channel in there to show that it was a very good fit until this past June when the plunge to the SMA200 resulted in a sudden VIX breakdown, a USDJPY rebound, and a 20% bounce in CL. More importantly, it got the Fed’s attention and precipitated 3 rate cuts.
Anyway, SPX broke out of the channel, backtested it 4 times, with the last being on Oct 3 when SPX didn’t even bother to backtest the SMA200. As they say, water under the bridge.
Getting back to this big purple channel… I’ve added .146, .382 and .618 lines to the usual .236, .500 and .786. And, it has worked pretty well over the past 30 years.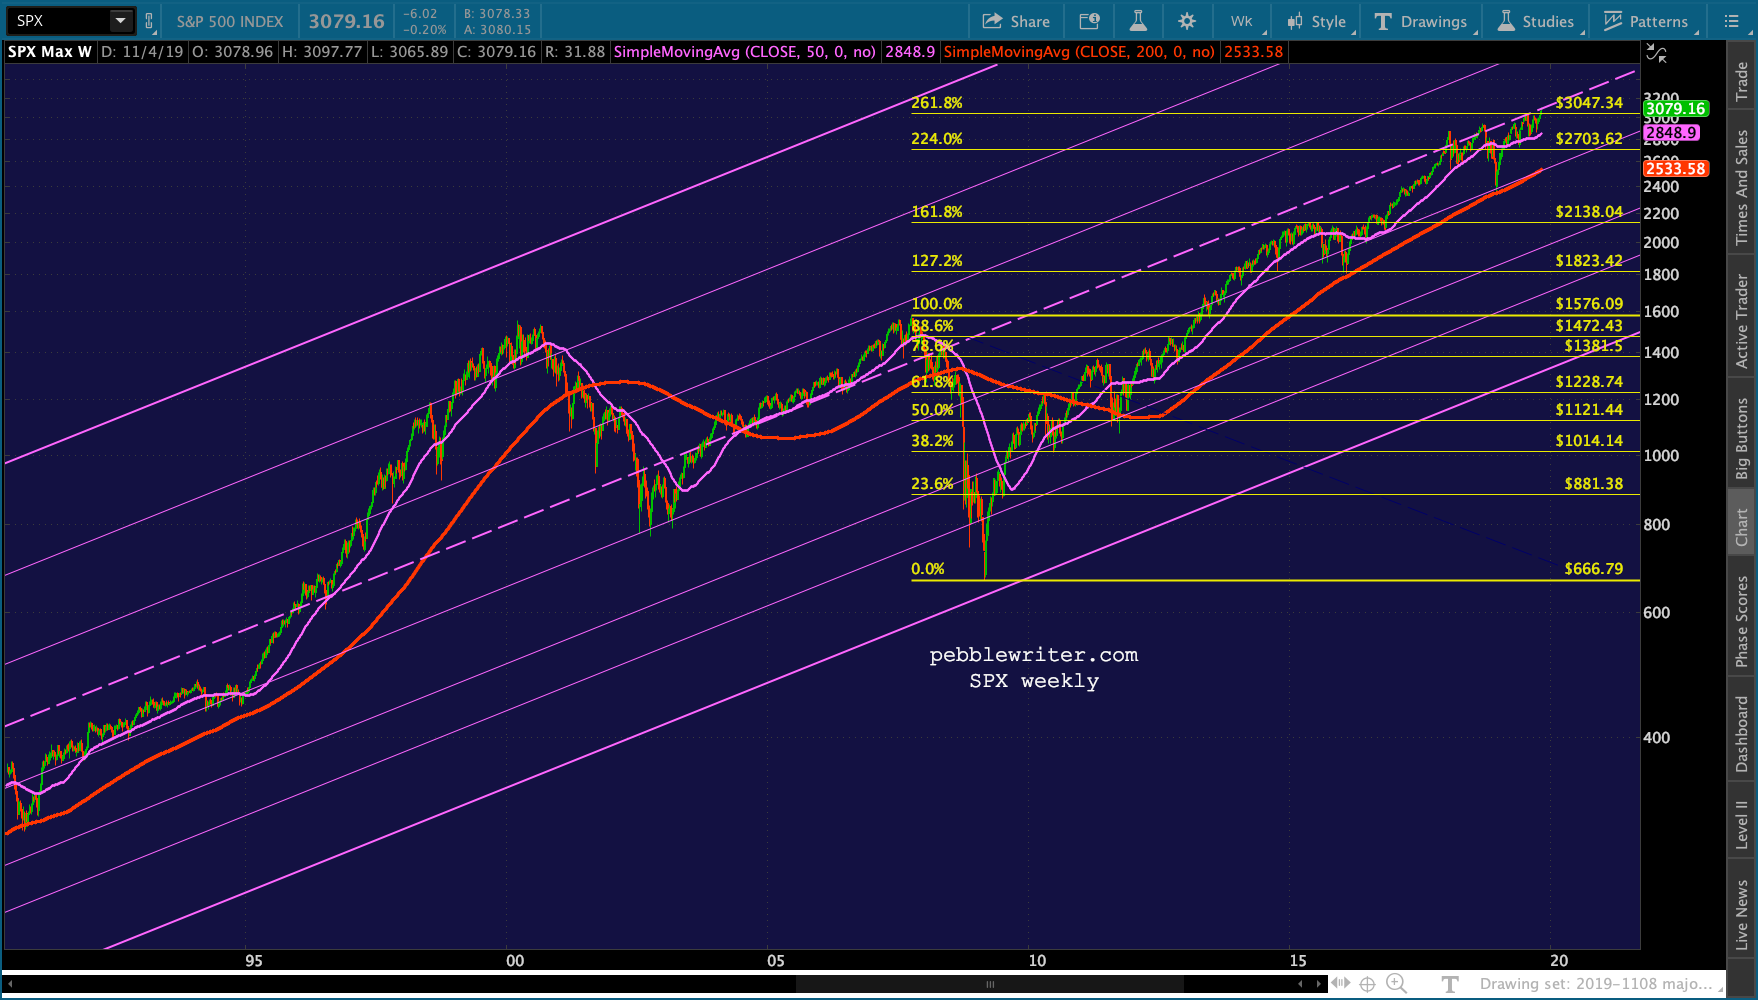 Going further back, we can see it explains the 1987 flash crash and the 1974 and 1982 lows exceptionally well.
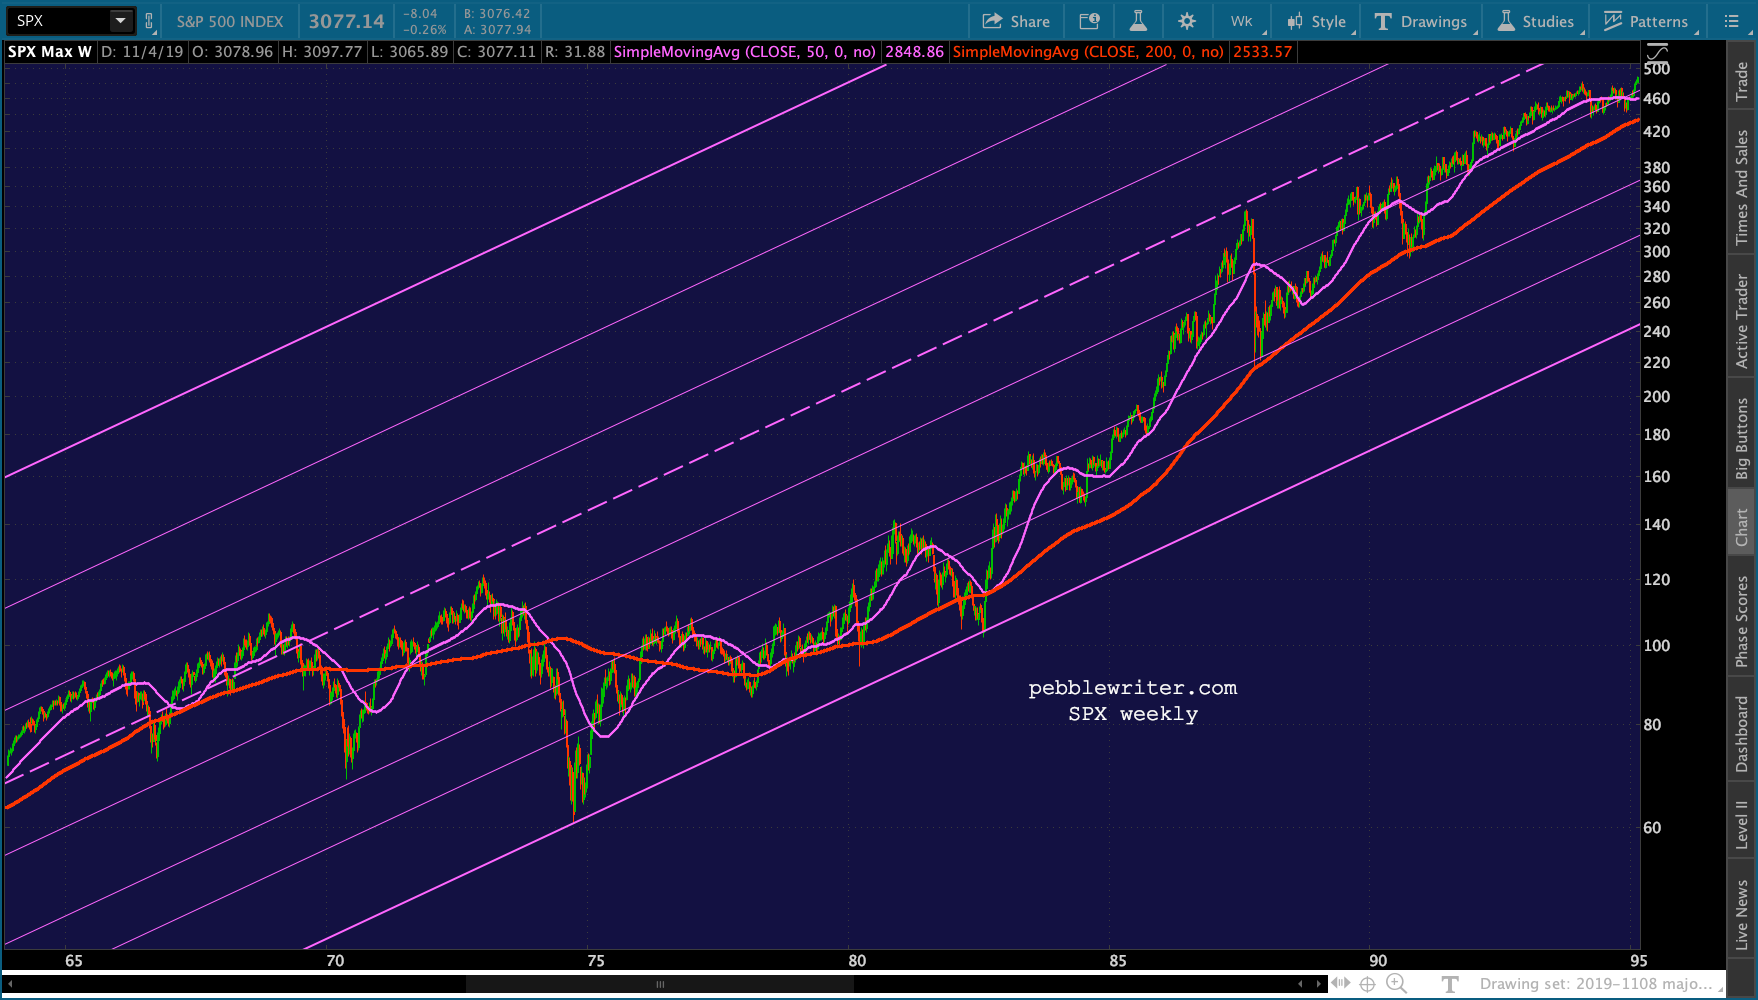 It’s only when we get back to the Depression that it begins to lose its fit — which is pretty good considering the index didn’t exist in its current form until 1957.
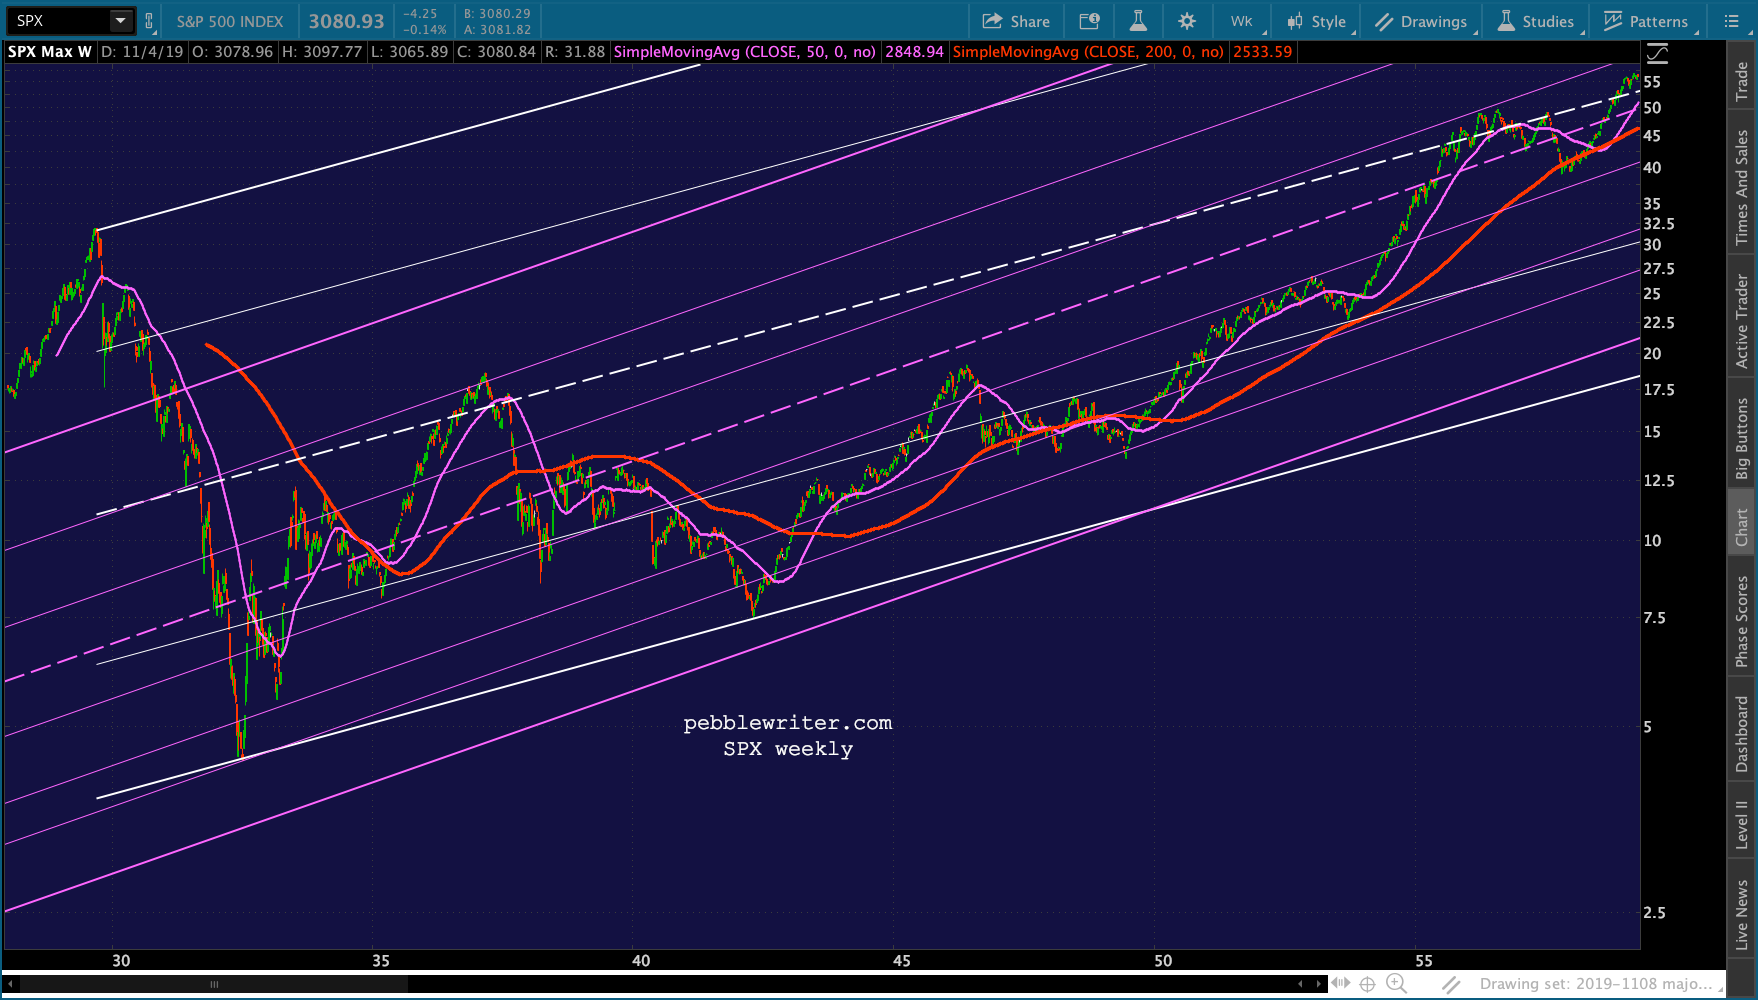 BTW, if we extend the white channel which appears to be the better fit from 1929 to 1945, it ends up in a pretty interesting place…
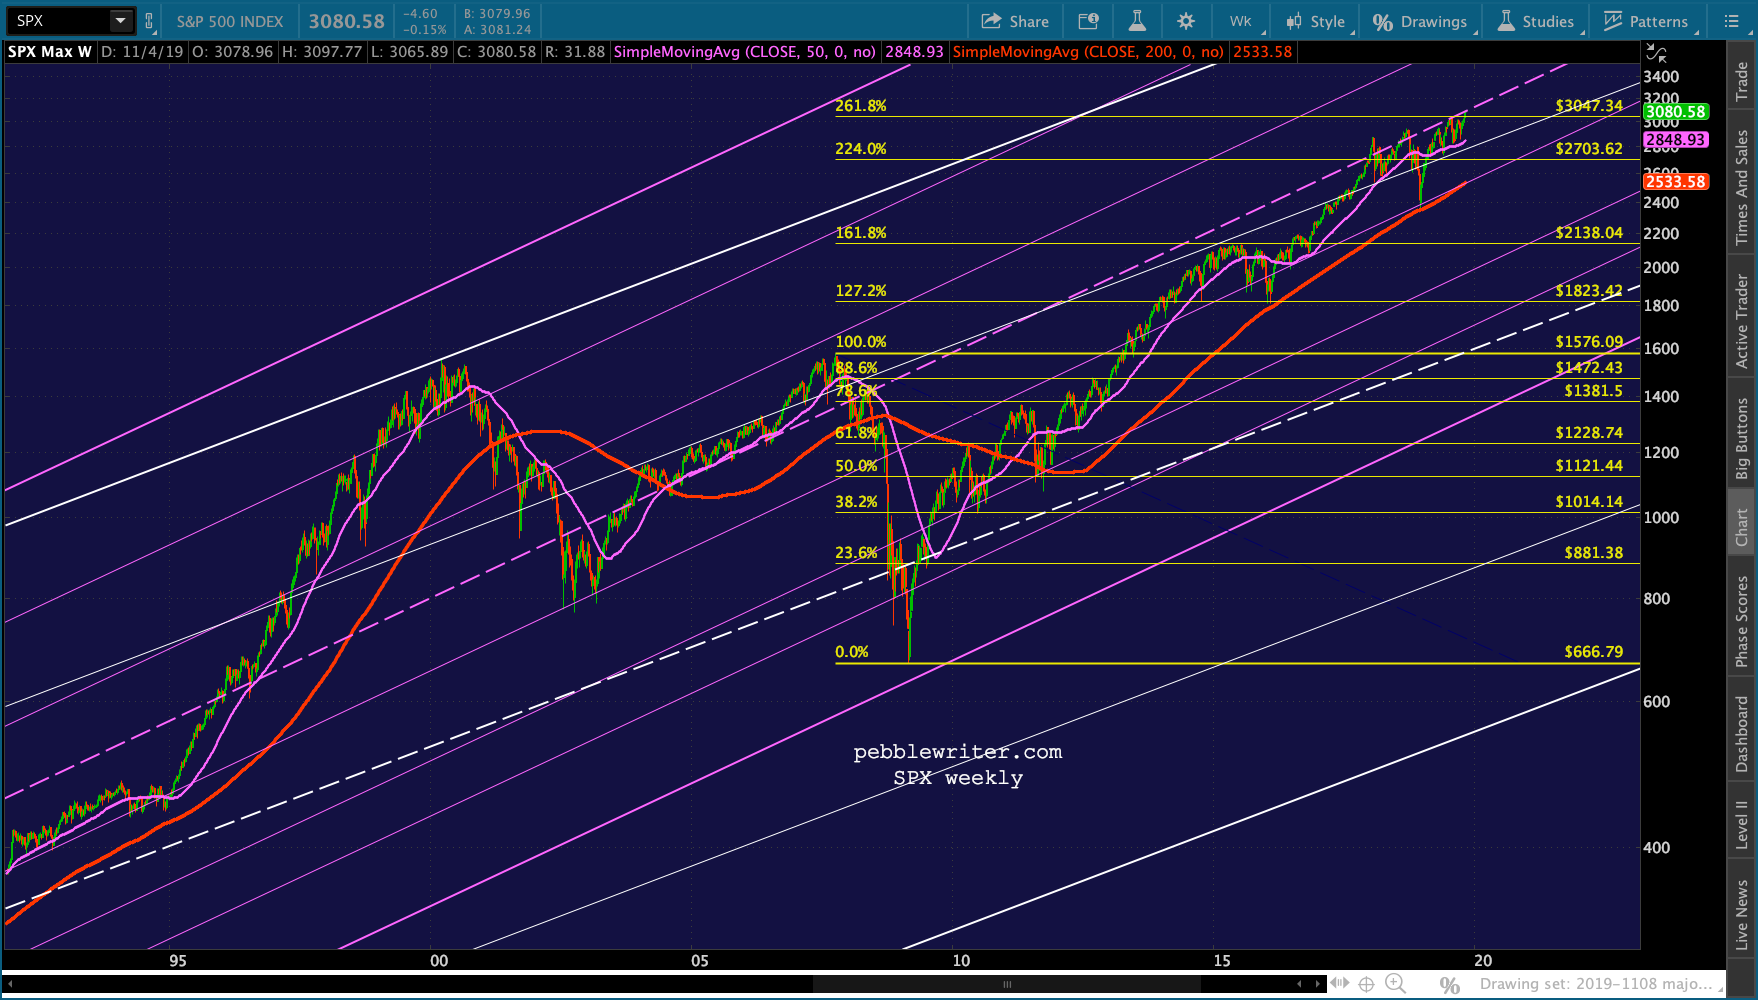 The conflict between the two is fascinating. The purple .382 line justified all the bottoms from 1991 to 2008 and the purple midline justified all the bottoms from 2003 to 2008. It was the breakdown from the purple midline which got the 2007-2009 crash rolling.
An aside, notice how well the weekly SMA200 did in providing support in 2011, 2016 and 2018. It did well in 1946, 1953, 1957 1968, 1980, 1987 and 1990 too.
If the white midline had held at 880 in Nov 2008 (about the time the initial QE discussions were ramping up) it would have limited the 2008 decline to a .886 retracement of the 2003-2007 rally. But, SPX broke below it which cast it as an undesirable channel.
Although, isn’t it interesting that the 2004-2006 and 2015 highs and several of the important stick saves since Feb 2018 have relied on the white .786?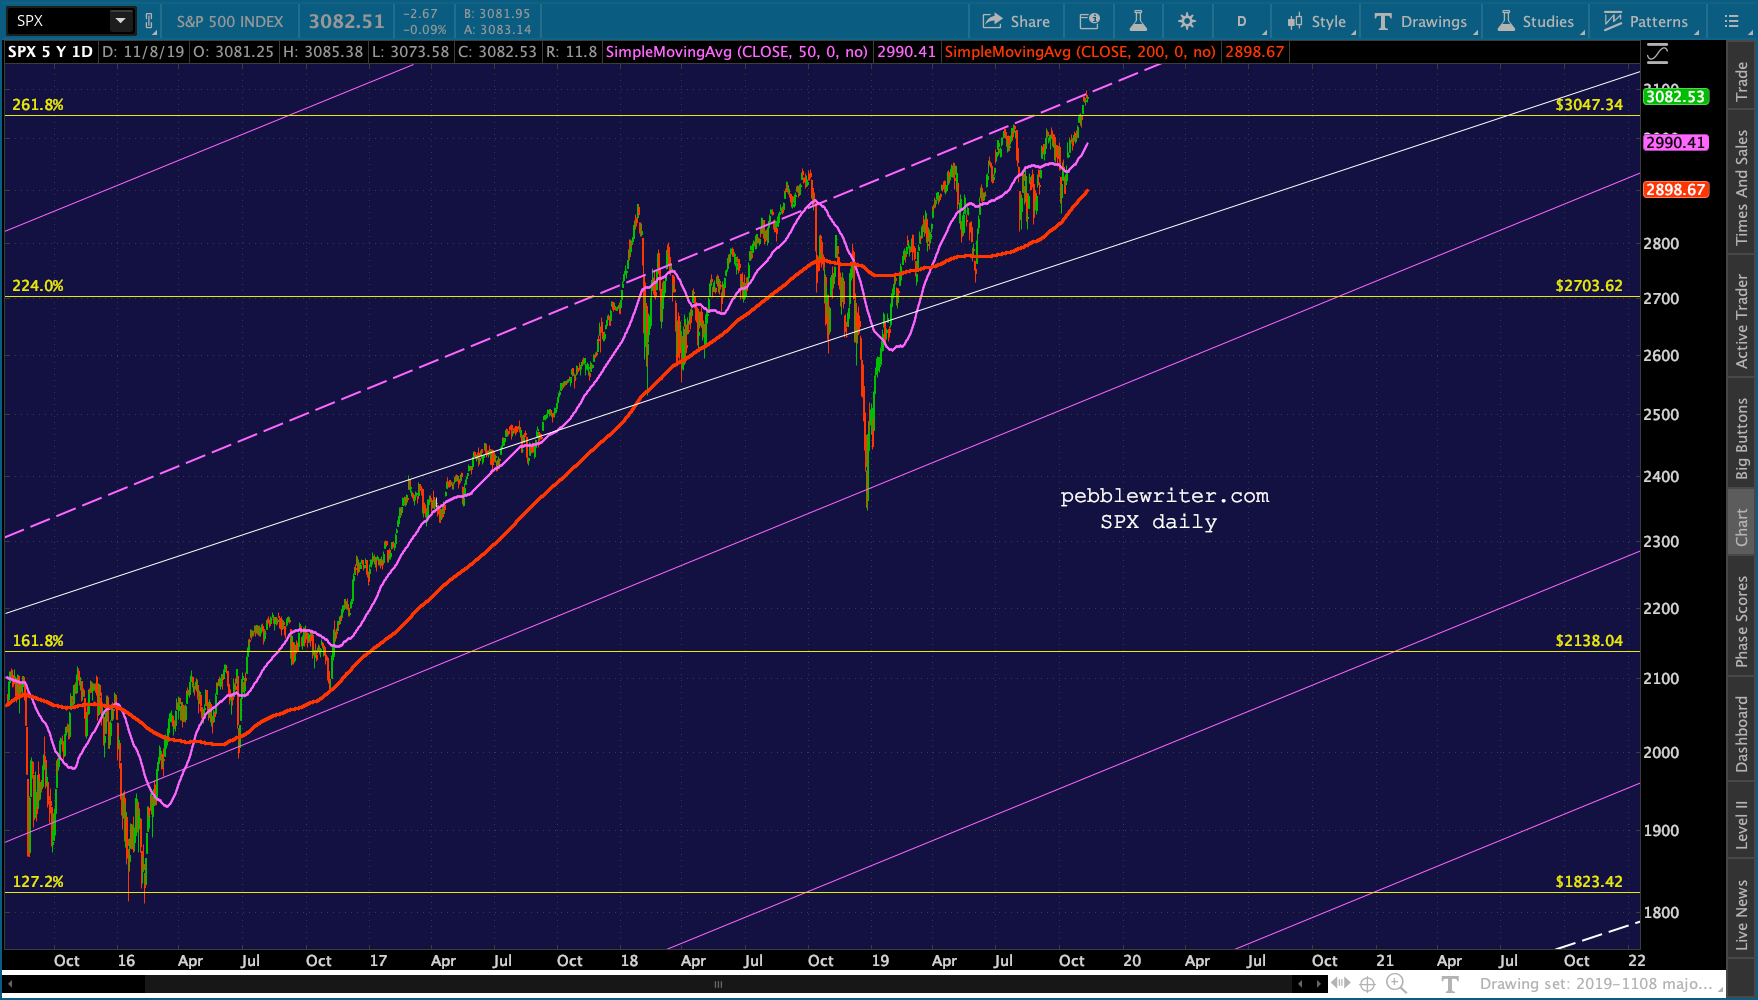 For now, the purple channel seems to be the one that matters. And, we care about the here and now, not the 30s. A couple of other observations…
When SPX pushed above the midline in Jan 2018…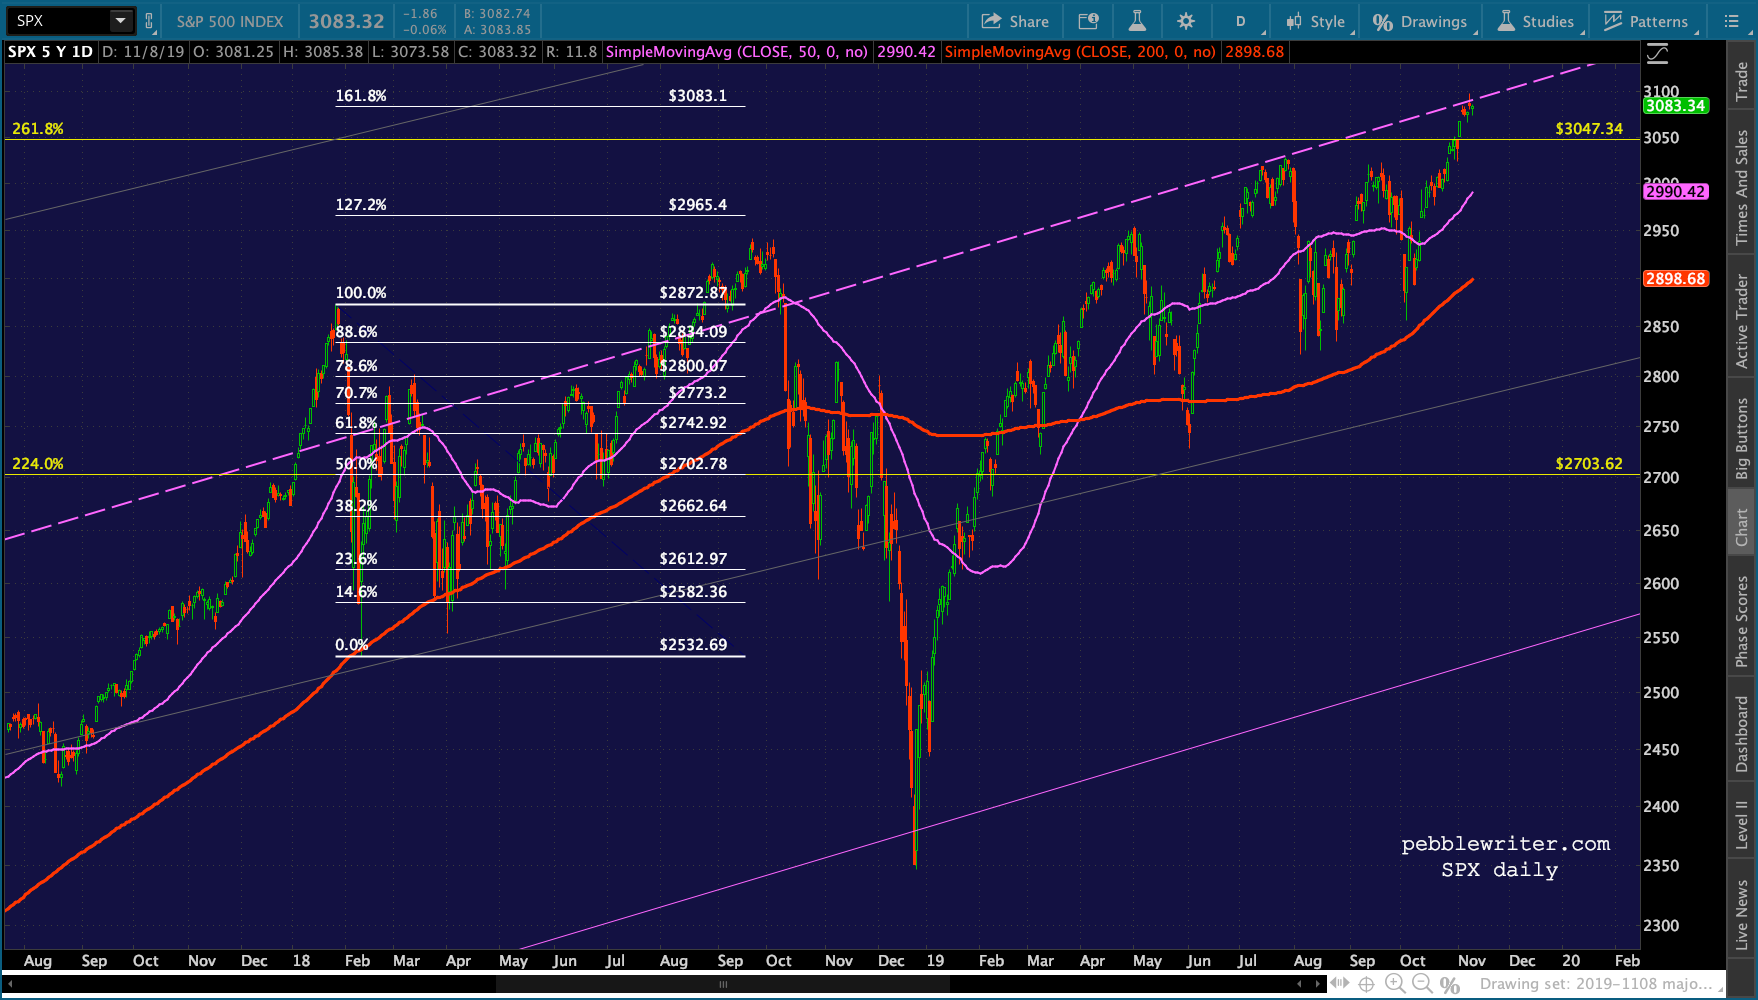 …it was because CL made new highs and broke out of its rising channel. I posted this one on Jan 10, 2018 showing the breakout and suggesting that it would cause inflation problems — which it did. We had 4 rate hikes in 2018.
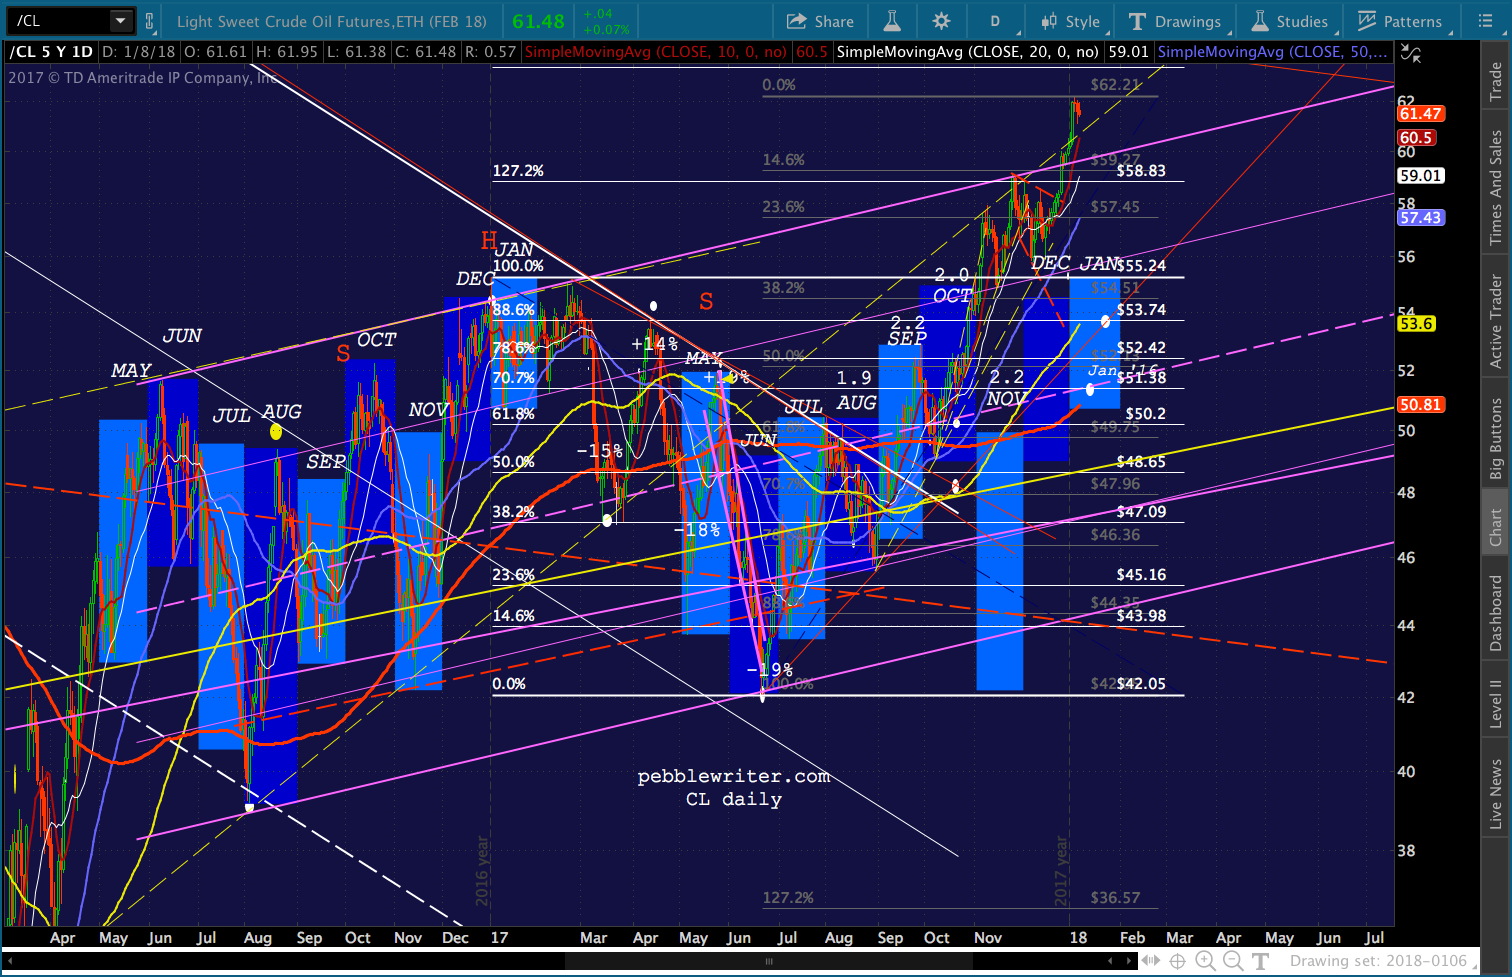 SPX fell back below the midline, bounced off the SMA200, and rallied back to the midline again — right where it intersected the .886 Fib retracement in late July. But, CL pushed up to a series of new highs, USDJPY bounced to new highs off its SMA200, and of course VIX broke down. It got SPX above the midline to new highs, but they didn’t last.
SPX topped out on Oct 3 when oil peaked and plunged in the wake of Khashoggi’s murder. It brought inflation back down and stopped the rate hikes, which is what Trump was after when he offered to run interference for MBS. And, in fact, the next FOMC move was a rate cut in Aug 2019.
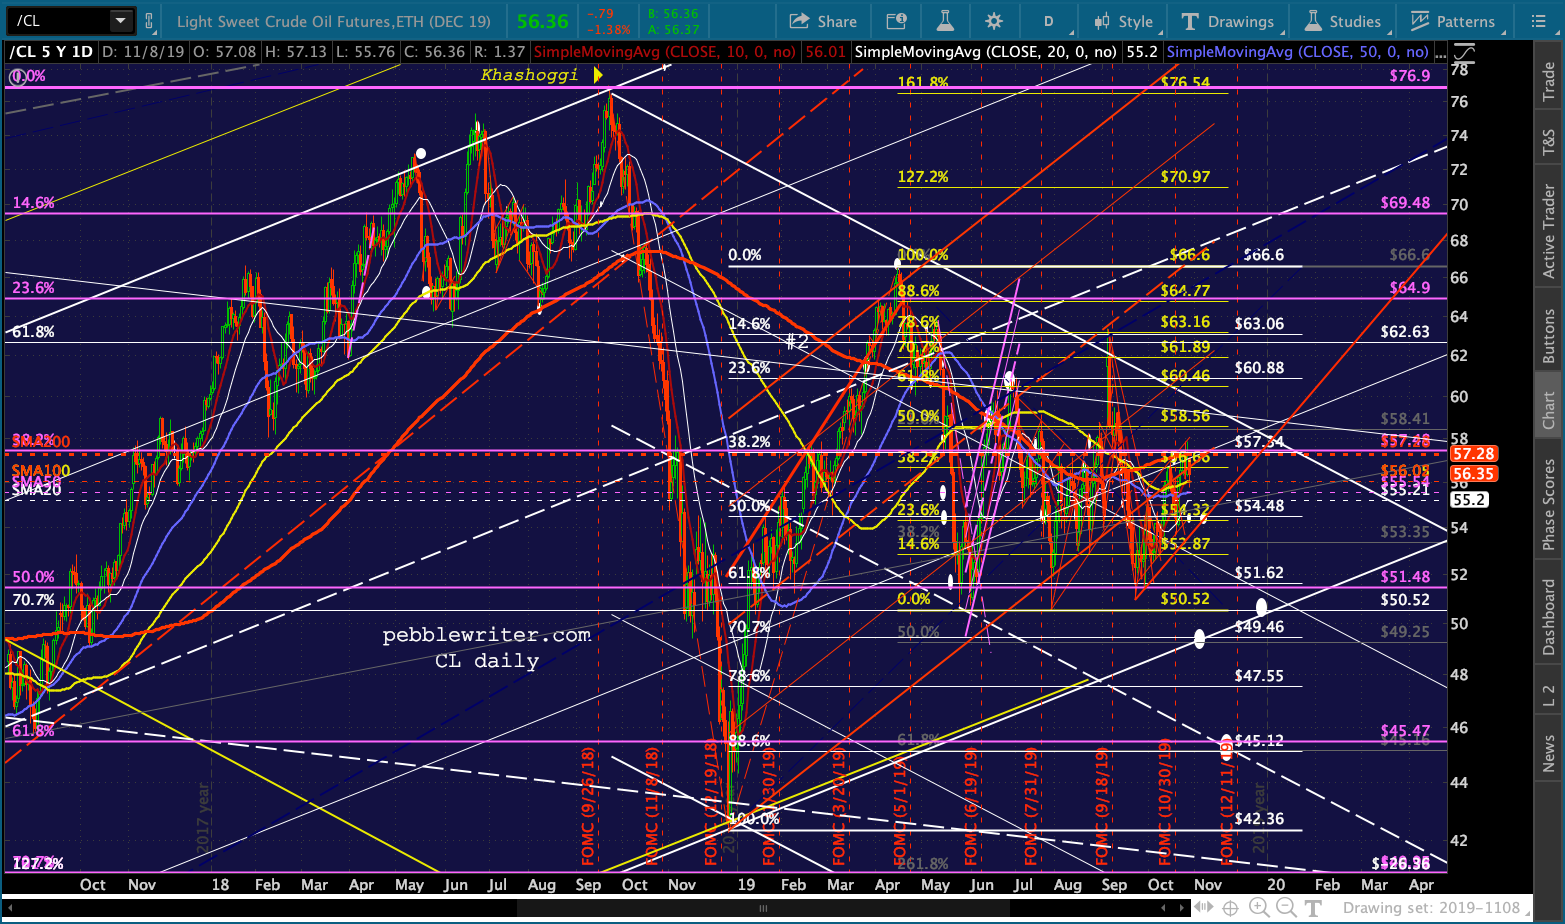 It’s no coincidence that SPX and CL both bottomed at the same time in Dec 2018. But, it has bounced over and over since then and CPI hasn’t been as tame as the rate cuts would suggest.
CL bounced 57% by Apr 2019 but was roughly on par with its Apr 2018 prices. CPI came in at 2.00 that month. I has seen a couple of bounces since then, but they didn’t last long and CPI has been limited to 1.65 to 1.81%. Check the chart, though, and you can see that the YoY drops from 2018 were substantial.
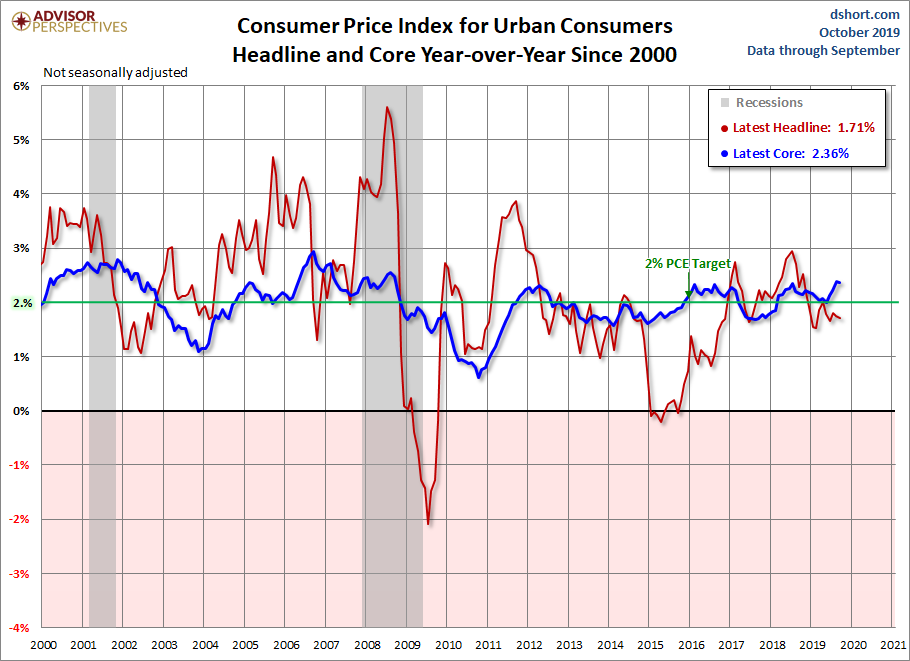
In other words, if not for the YoY drop, CPI might easily have topped 2%. This is why core CPI has topped regular CPI for most of the year. From Doug Short’s excellent Advisor Perspectives:
 This is why we’ve seen such tension between Saudi Arabia’s desire to push oil higher for the Aramco IPO and the need to keep it lower to compensate for what would otherwise be a problematic rise in CPI — problematic as it would put upward pressure on interest rates again. We’re already seeing it in the 10Y, which has technically broken out.
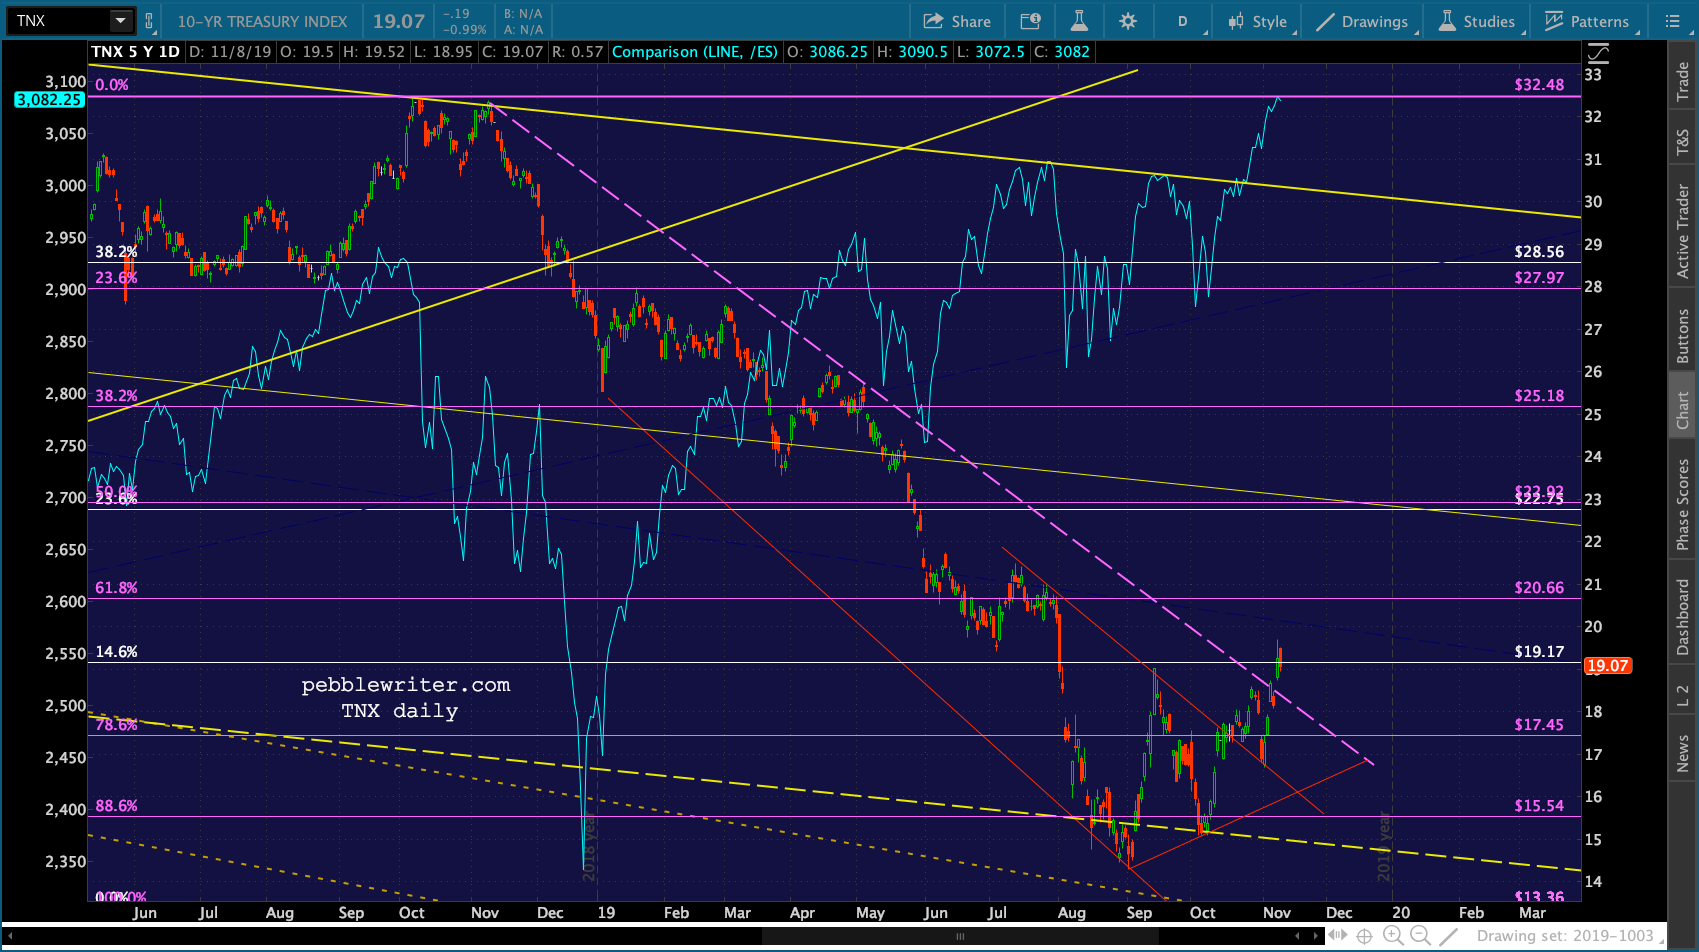 And, here’s the problem…the past two months gas prices have fallen versus 10% their 2008 levels. In Nov 2018, gas prices collapsed 8% MoM. In Dec 2018, they fell another 12%. With prices currently around 2.62, we’re going to see a November YoY increase instead of a decline.
 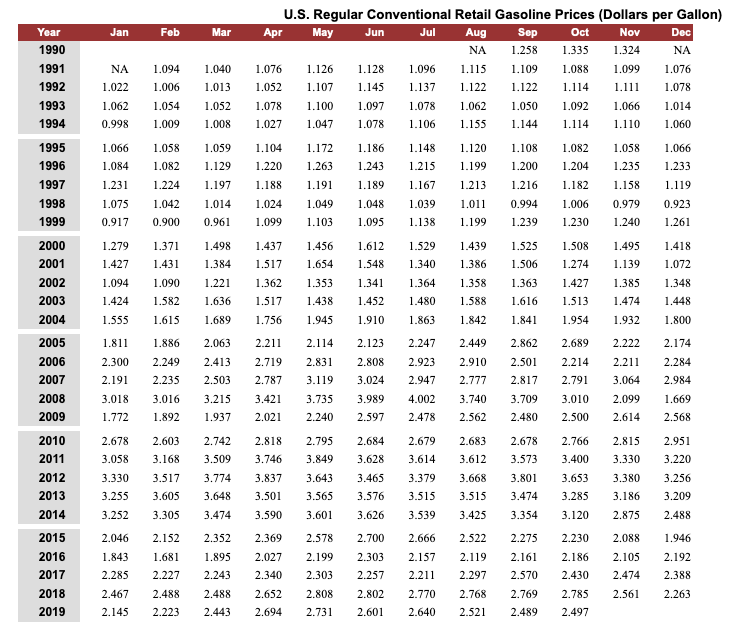 October CPI should be alright when reported next week, but November’s will be much higher unless gas prices drop .30 – .40/gallon. That would imply RB dropping to around new lows. It could be a real drag on the market and it certainly explains the panic over getting Aramco’s IPO done ASAP. Bottom line, RB and CL’s horseshit sideways shuffle is not long for this world.
If Aramco is postponed, watch out for a collapse in CL, RB and SPX. Otherwise, they might hold on until 3 nanoseconds after the deal is done.
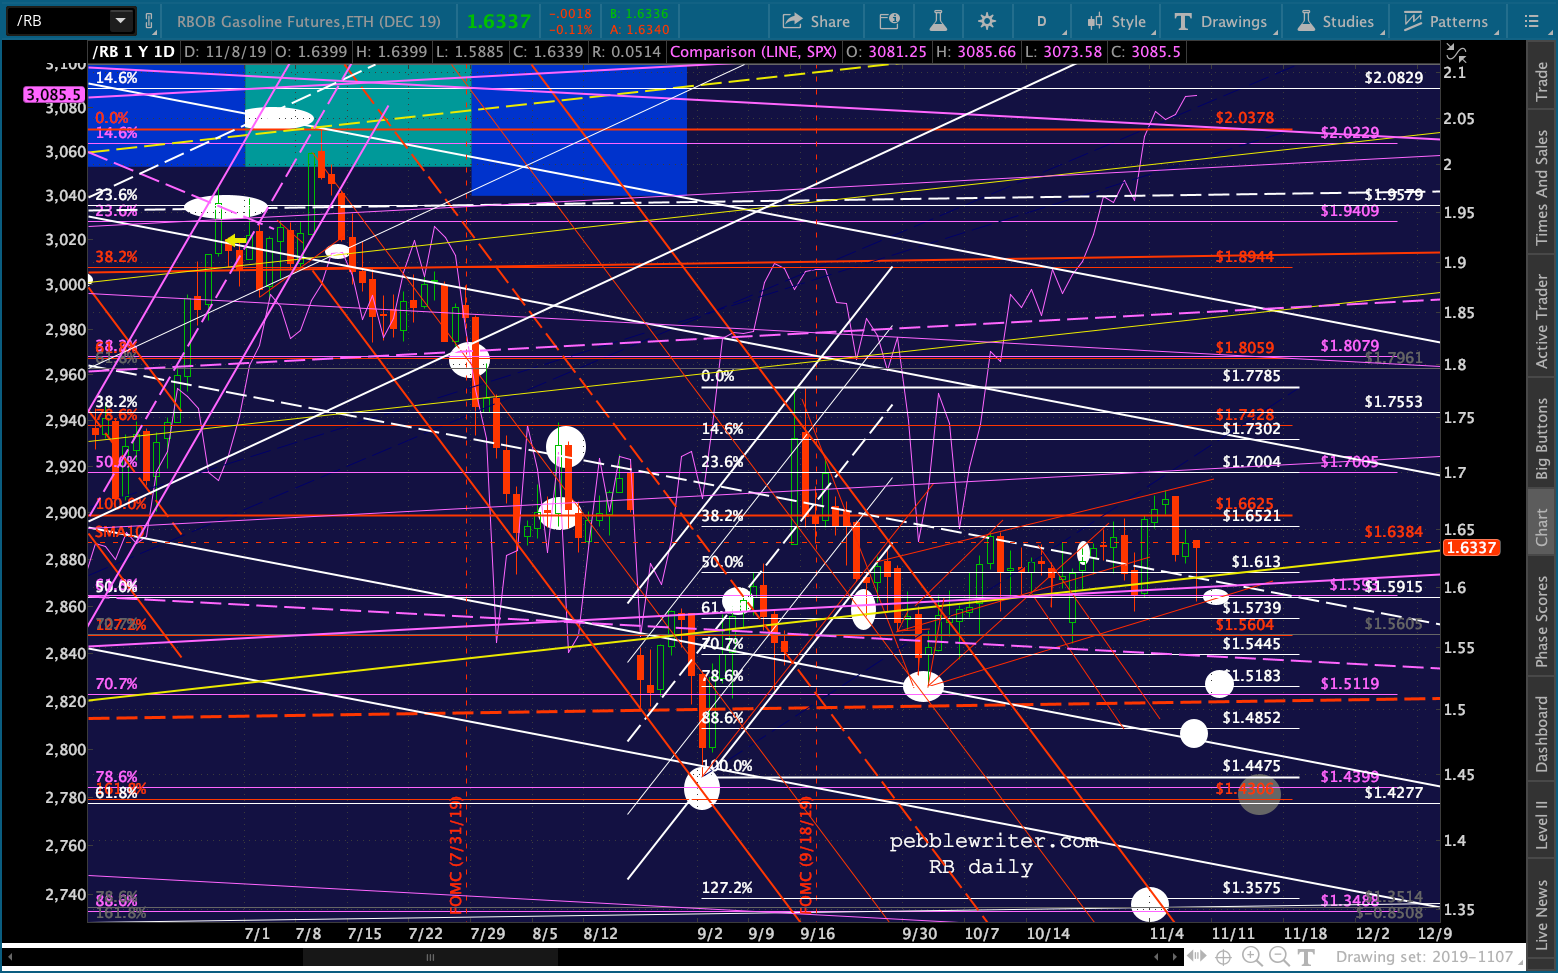 In the meantime, though, we’ll get more of this crap…
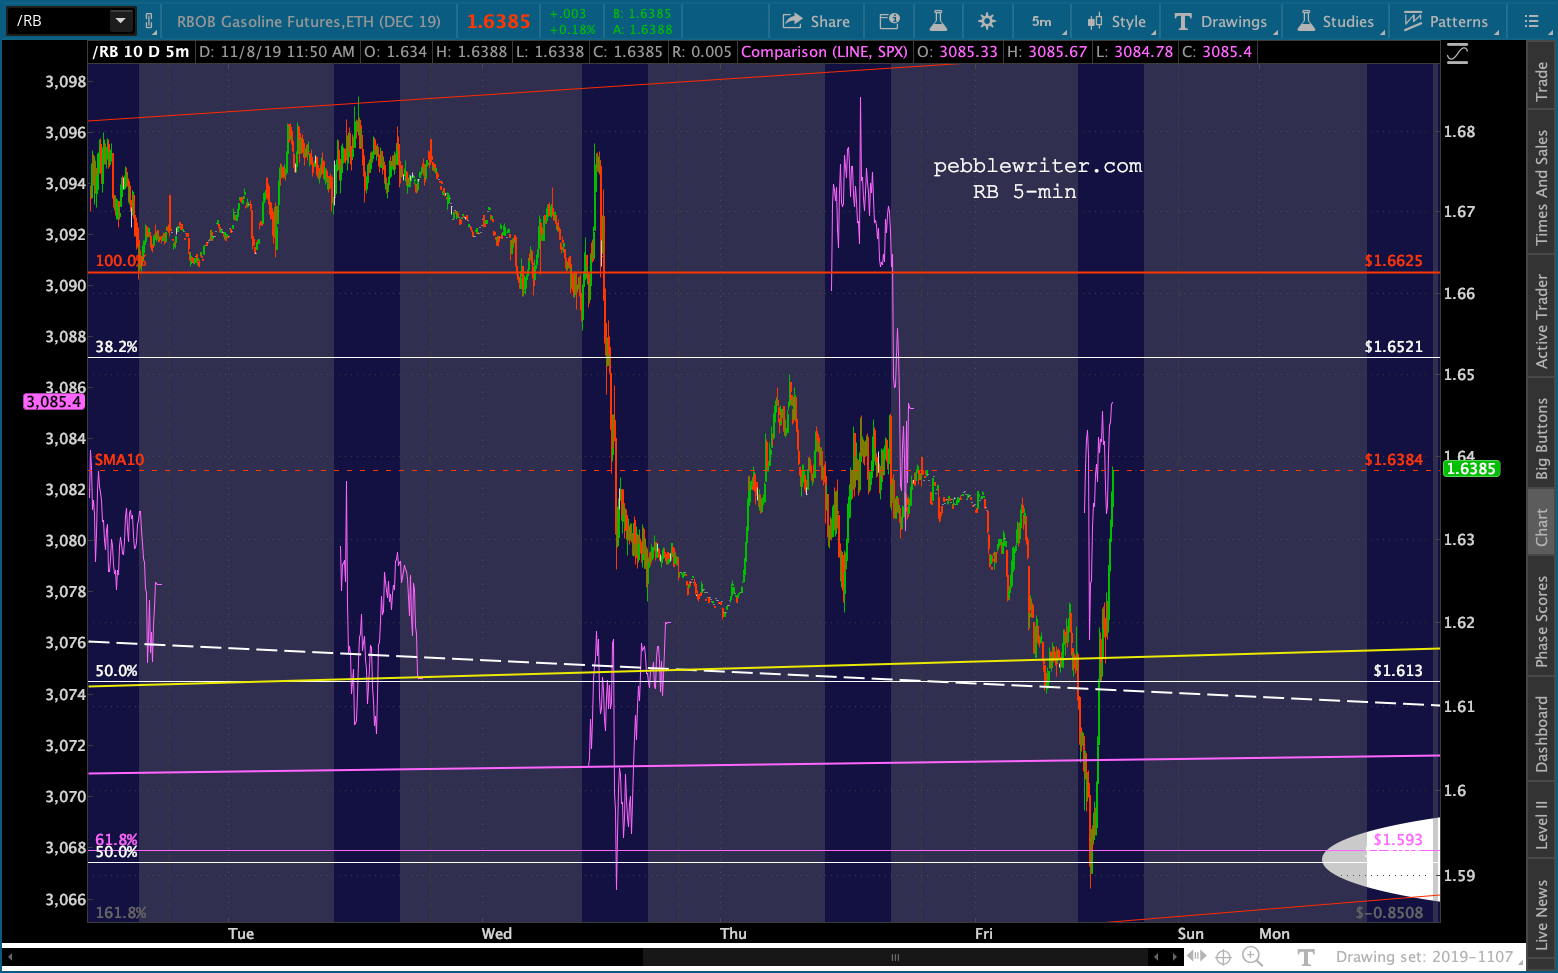
 …which, along with this crap…
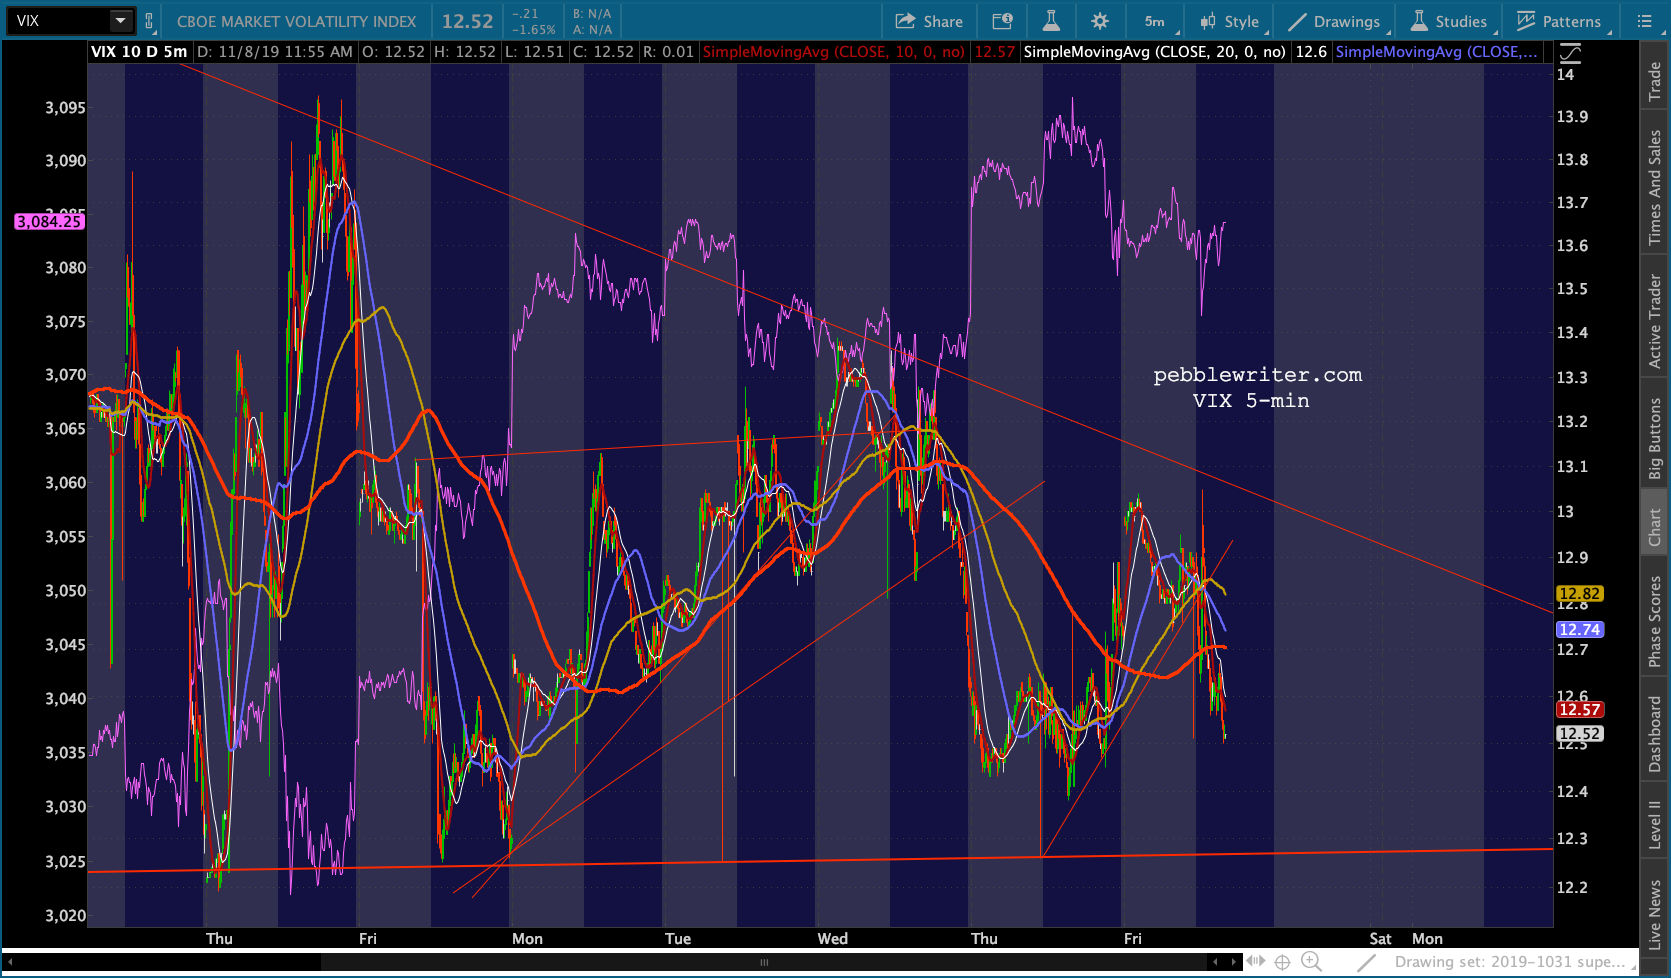 …will produce more of this crap.
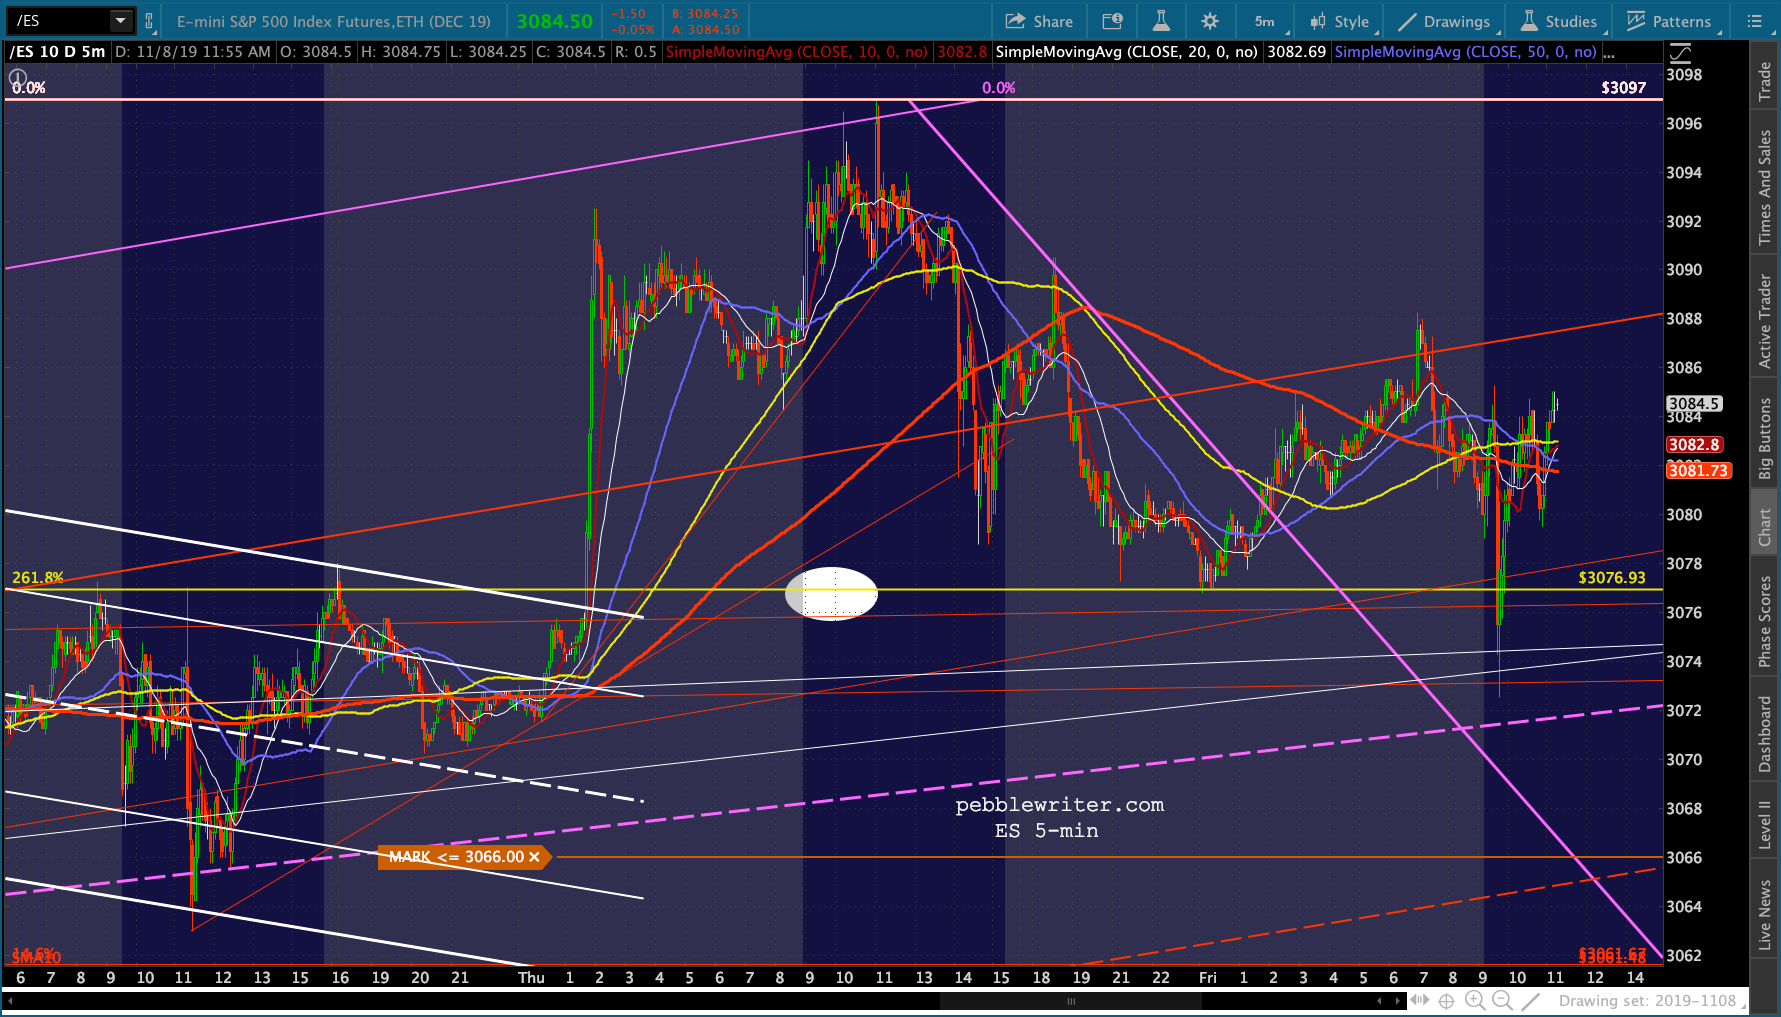 If oil/gas prices end up collapsing, what will keep stocks afloat? The algos don’t seem to care that trade headlines haven’t resulted in actual results. So, there’s always that. And, I’d be shocked if Trump hasn’t ginned up a draft agreement for immediate release in case the market starts tanking. But, what if it gets away from him or Navarro spooks the markets, etc?
Could USDJPY pick up the slack? In the short run, sure. But, note that JGB rates have already risen quite a bit due to yen weakness. When USDJPY bottomed at 104.44 on Aug 26, JGBs were -0.26%.
Now, with USDJPY up at 109.48, they’re pushing -0.05%. If oil and gas plunge, the BoJ could handle a cheaper yen (higher USDJPY.) But, if they don’t, the BoJ might actually have to pay interest on their bonds. Wouldn’t that suck?
Bottom line, they can’t really afford to let USDJPY rally much more without it creating inflation pressures which would push rates higher. Paradoxically, as rates go higher, the yen would strengthen, causing USDJPY to fall and stocks to go along with it. Everybody knows Japan can ill afford positive rates.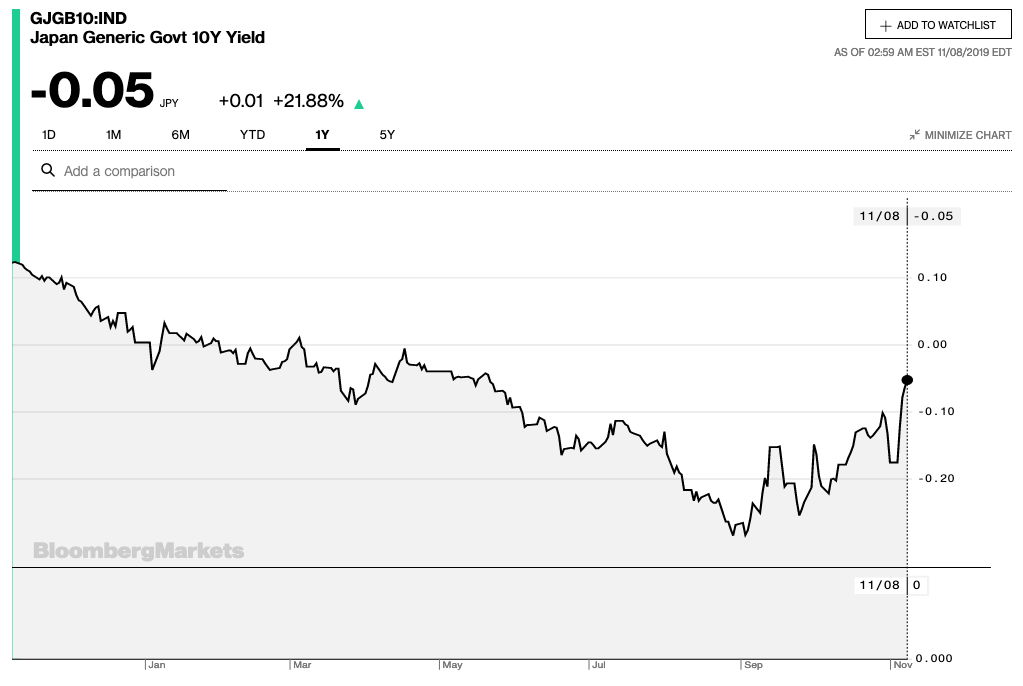 As we’ve discussed ad nauseum, VIX is in a great position to be able to pick up the slack. A moment ago, it was within 0.13 of breaking below this TL from Dec 2017. It’s been bouncing off of it for over a week — and algos are paying very close attention.
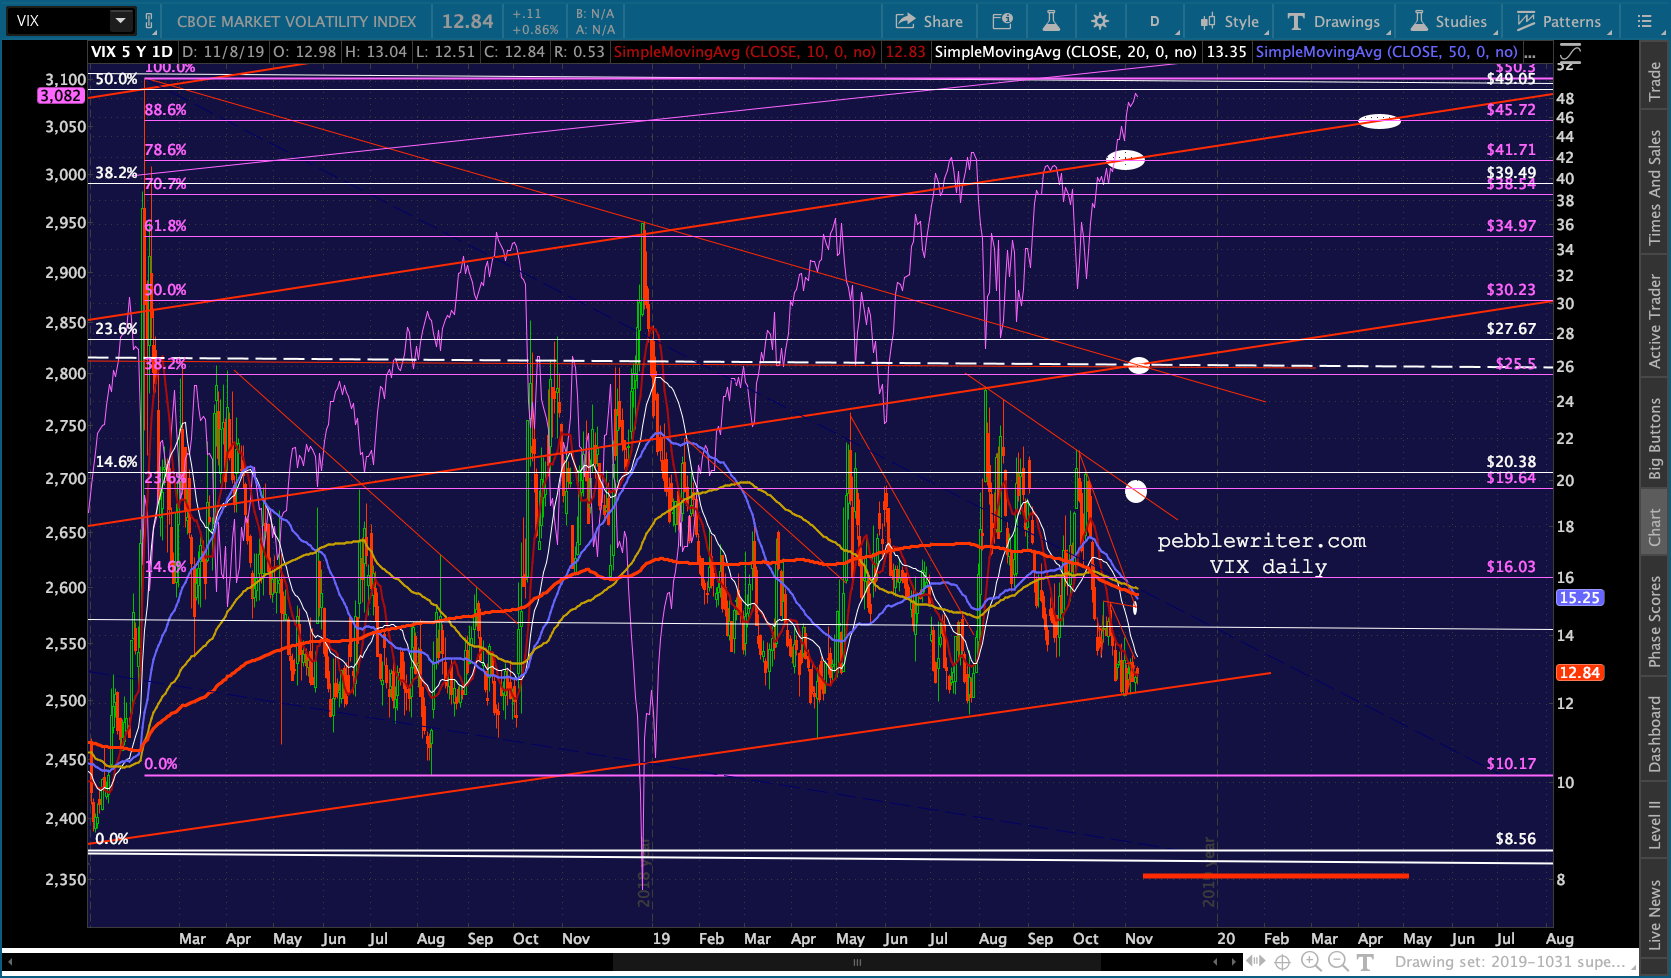 I feel like I’m going around in circles now, so will stop. Yes, the market should be tanking — at least 6% to the SMA200. But, if CL/RB can continue their intraday “rallies” and USDJPY can continue at least sideways and VIX can remain within striking distance of its red TL, we won’t see a selloff. If China talks break down or Aramco gets done, it should be quite a different story — as long as VIX isn’t able to make new lows.
Last month’s pessimism has burned off, with the put/call ratio recently falling to levels not seen since Jan 2018. The next few days will be critical to keeping the rally alive.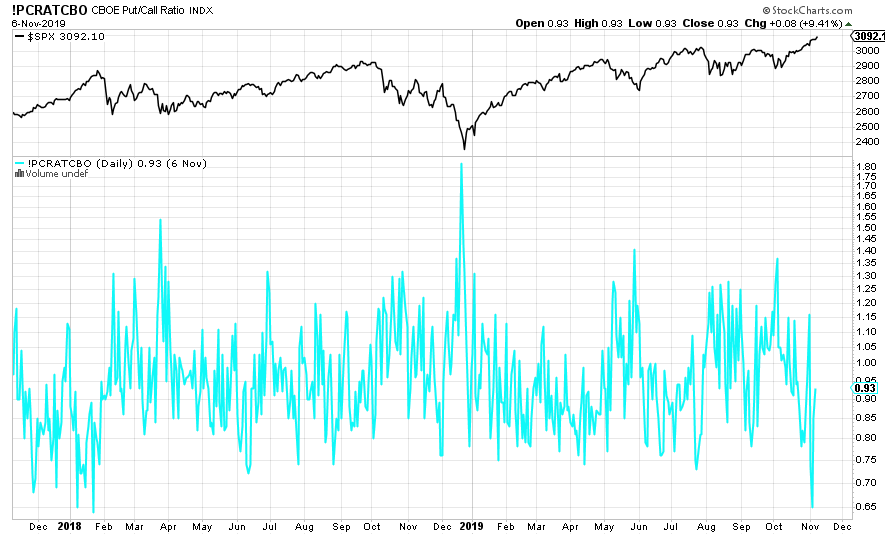 I’m going to take the rest of the day off but will be close by in case things unravel. Although the market will be open (bonds closed) on Monday, I plan on posting in the morning and then taking the rest of the day off.
GLTA.