

Friday the 13th – an inauspicious day to break a new analog! With SPX nailing our downside target and futures breaking out of the falling wedge pattern yesterday, we’re off to the races.

These things don’t always work out. But, when they do, it can be a career-making trading opportunity. The one which worked out absurdly well was back in 2011. The 22% correction played out almost exactly as forecast, with the vicious 11-day, 18% plunge starting on the very day and within 1 point of what the analog promised. You can read all about it HERE.
continued for members…I referred to this analog yesterday when discussing the possibility of a reversal at the 20% off mark. Turns out that in addition to the price moves, the days count is suspiciously similar to the 2000 top.
The first part of it is shown below…
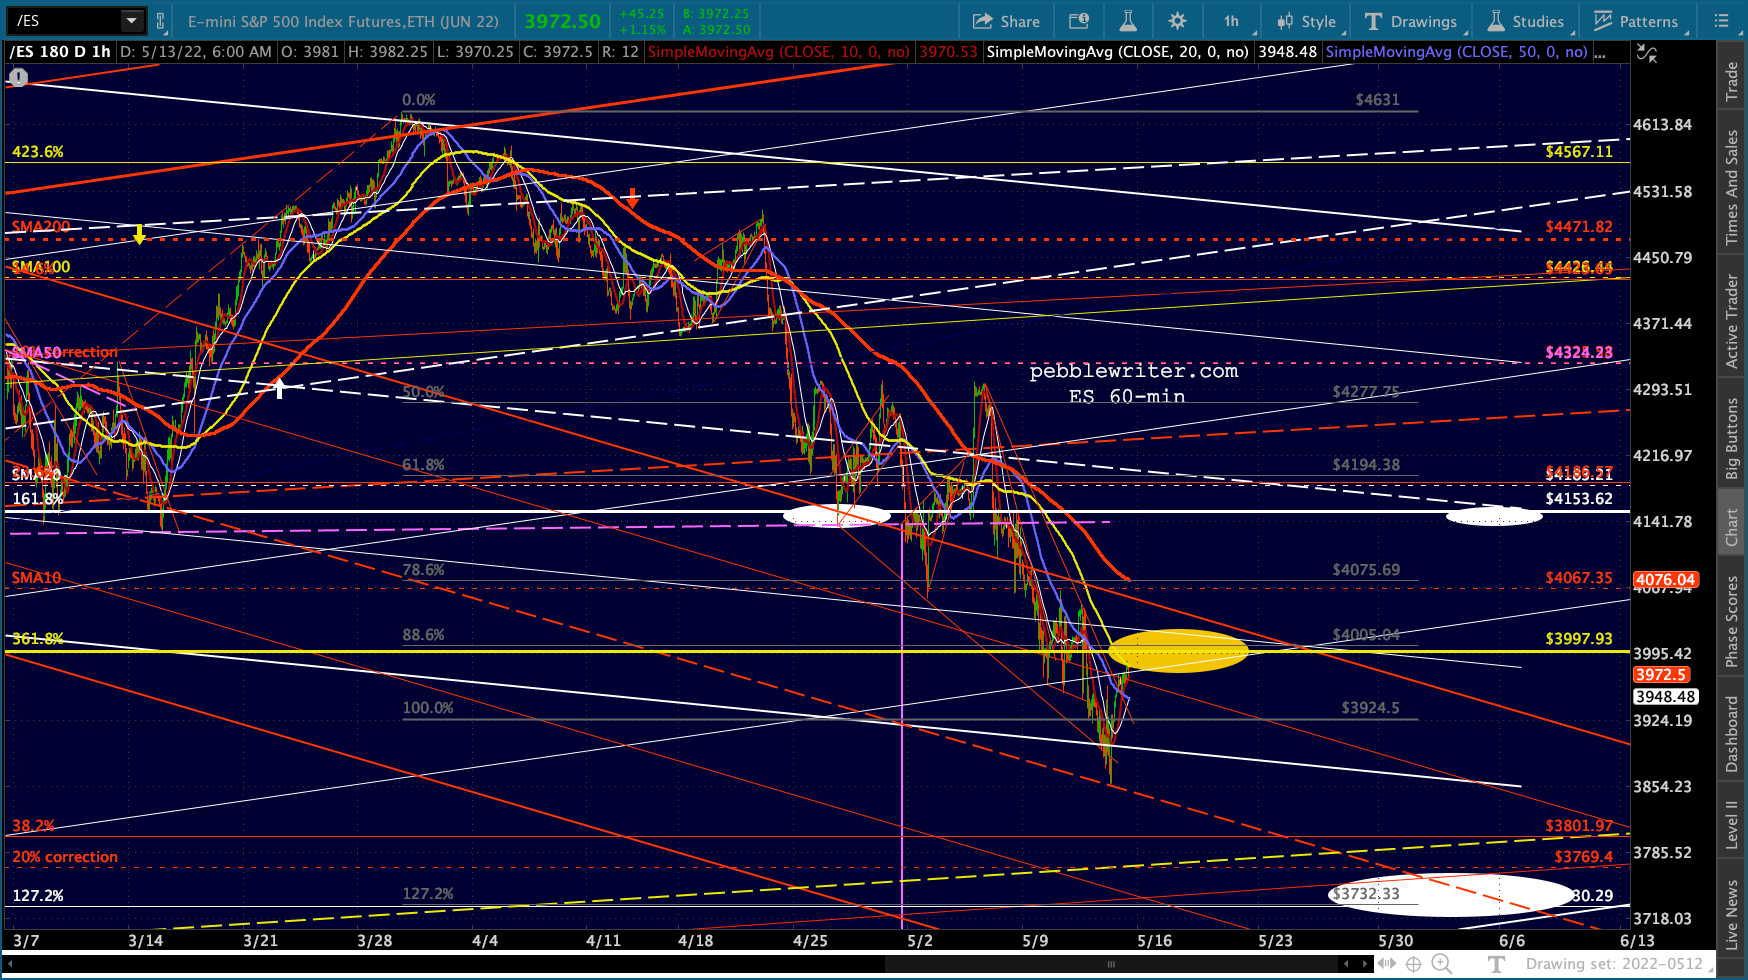
 I’ll be working on it throughout the day to confirm, but the key is breaking back above ES’ yellow 3.618 Fib.
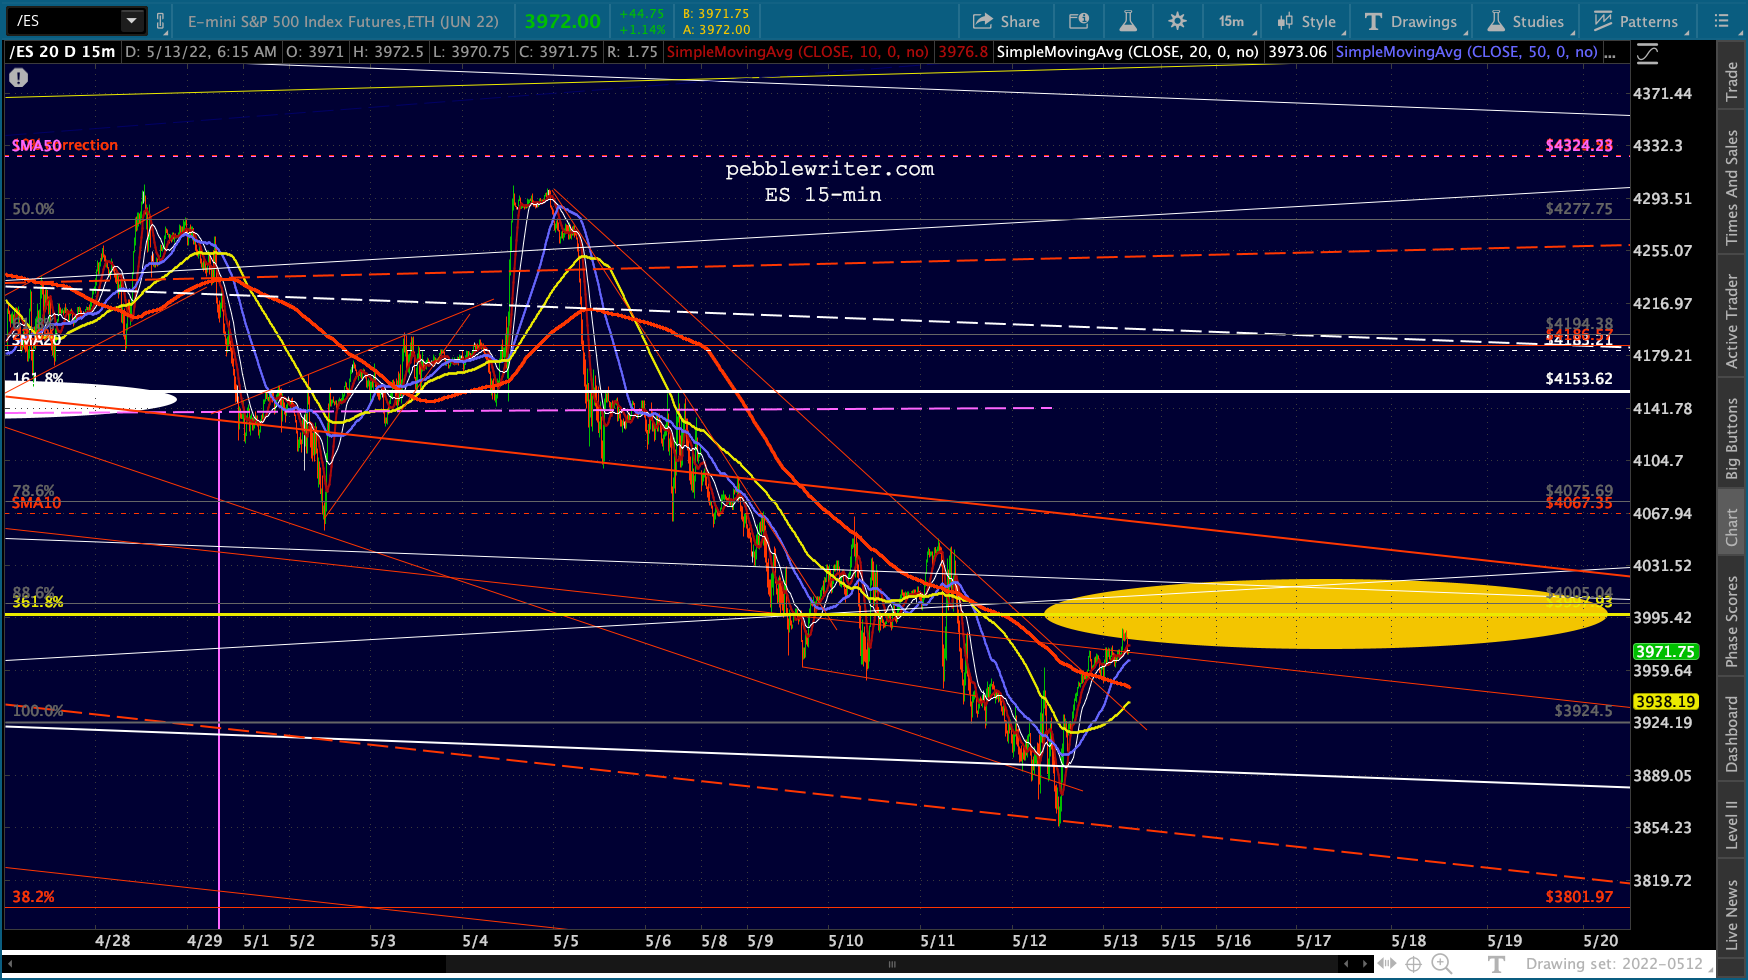
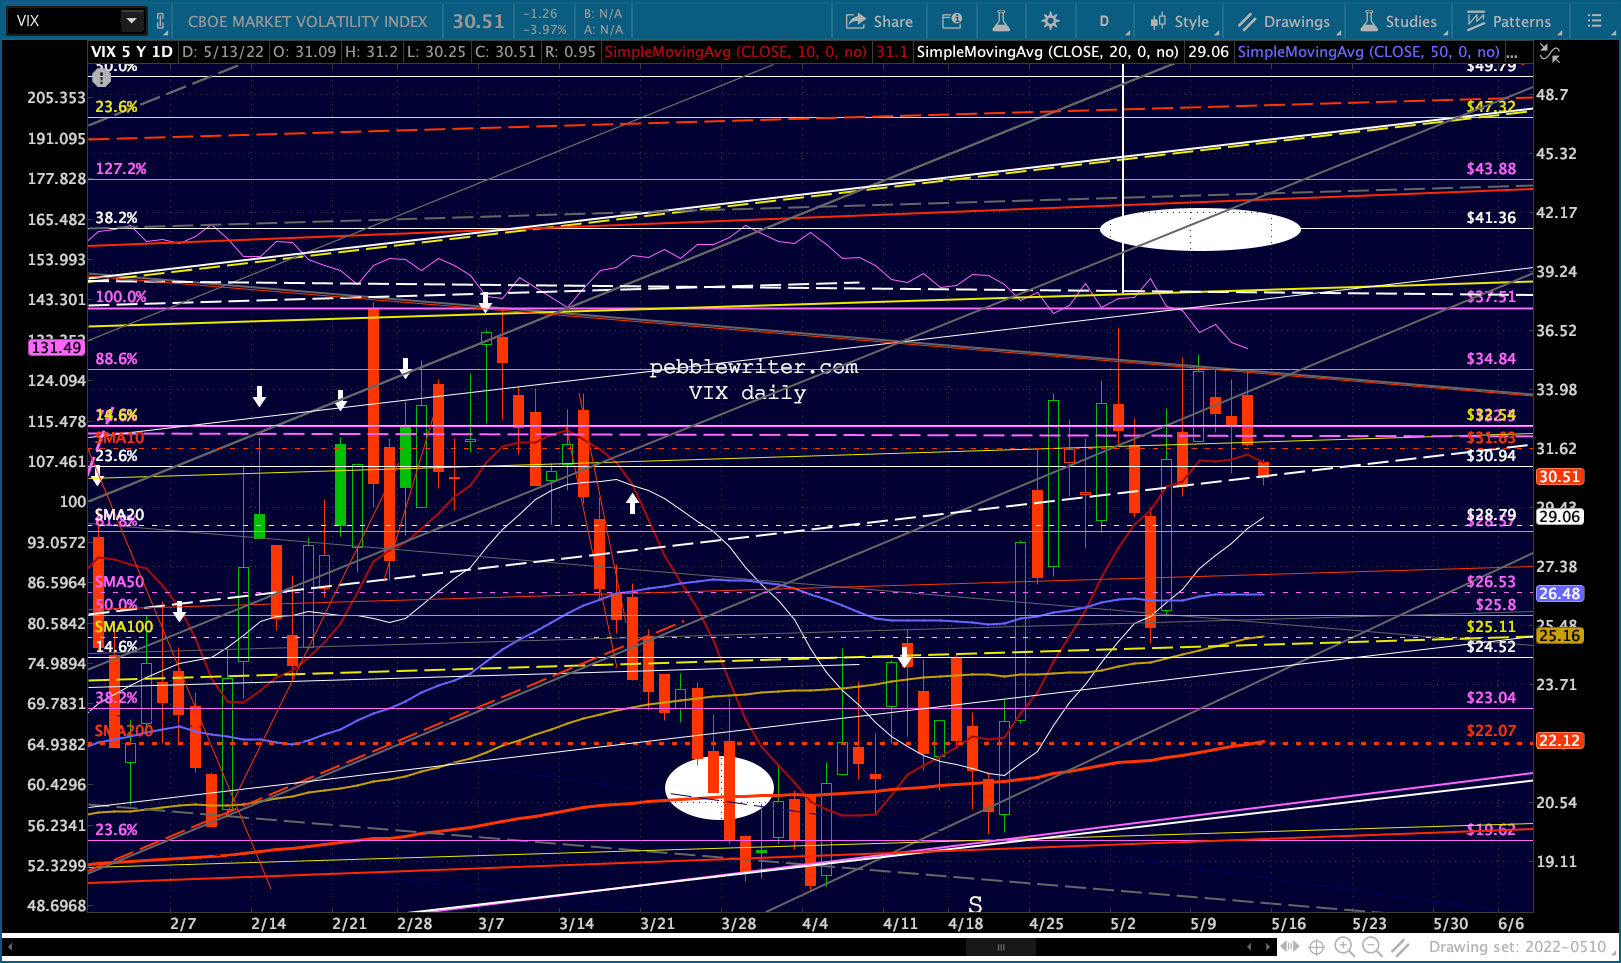
 The fact that VIX broke down below its SMA10 is icing on the cake.
 UPDATE: 9:00 PM
Finally wrapping it up…long day of charting! Thanks for your patience.
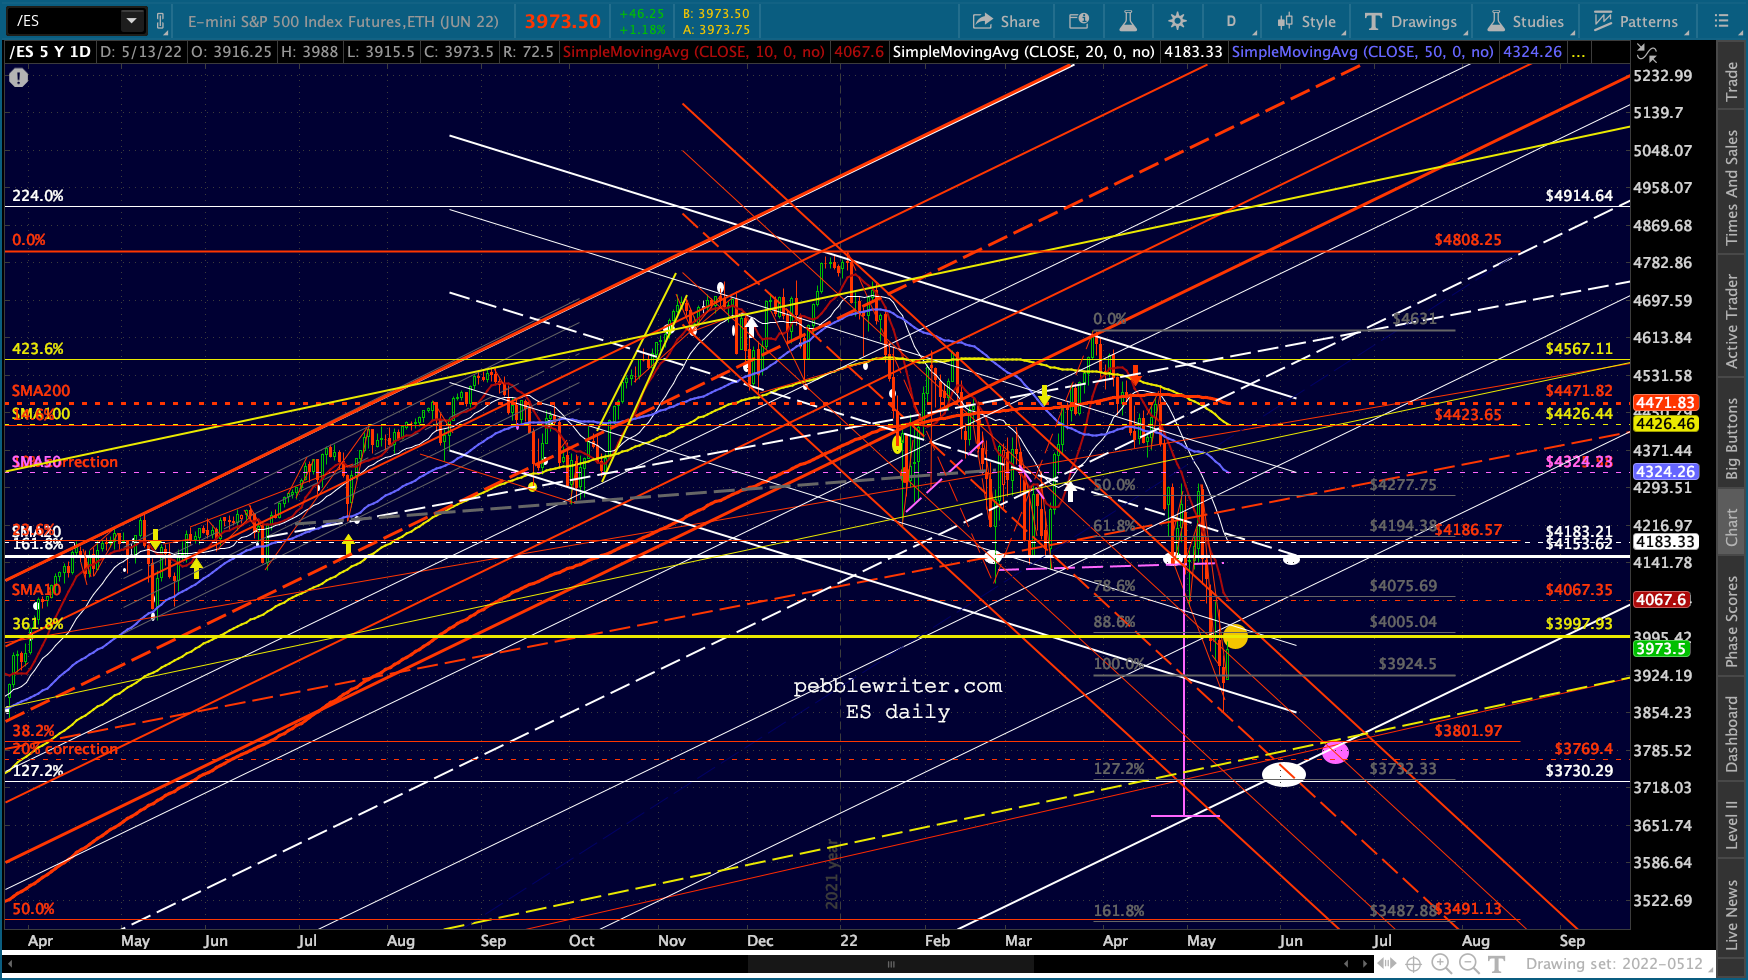
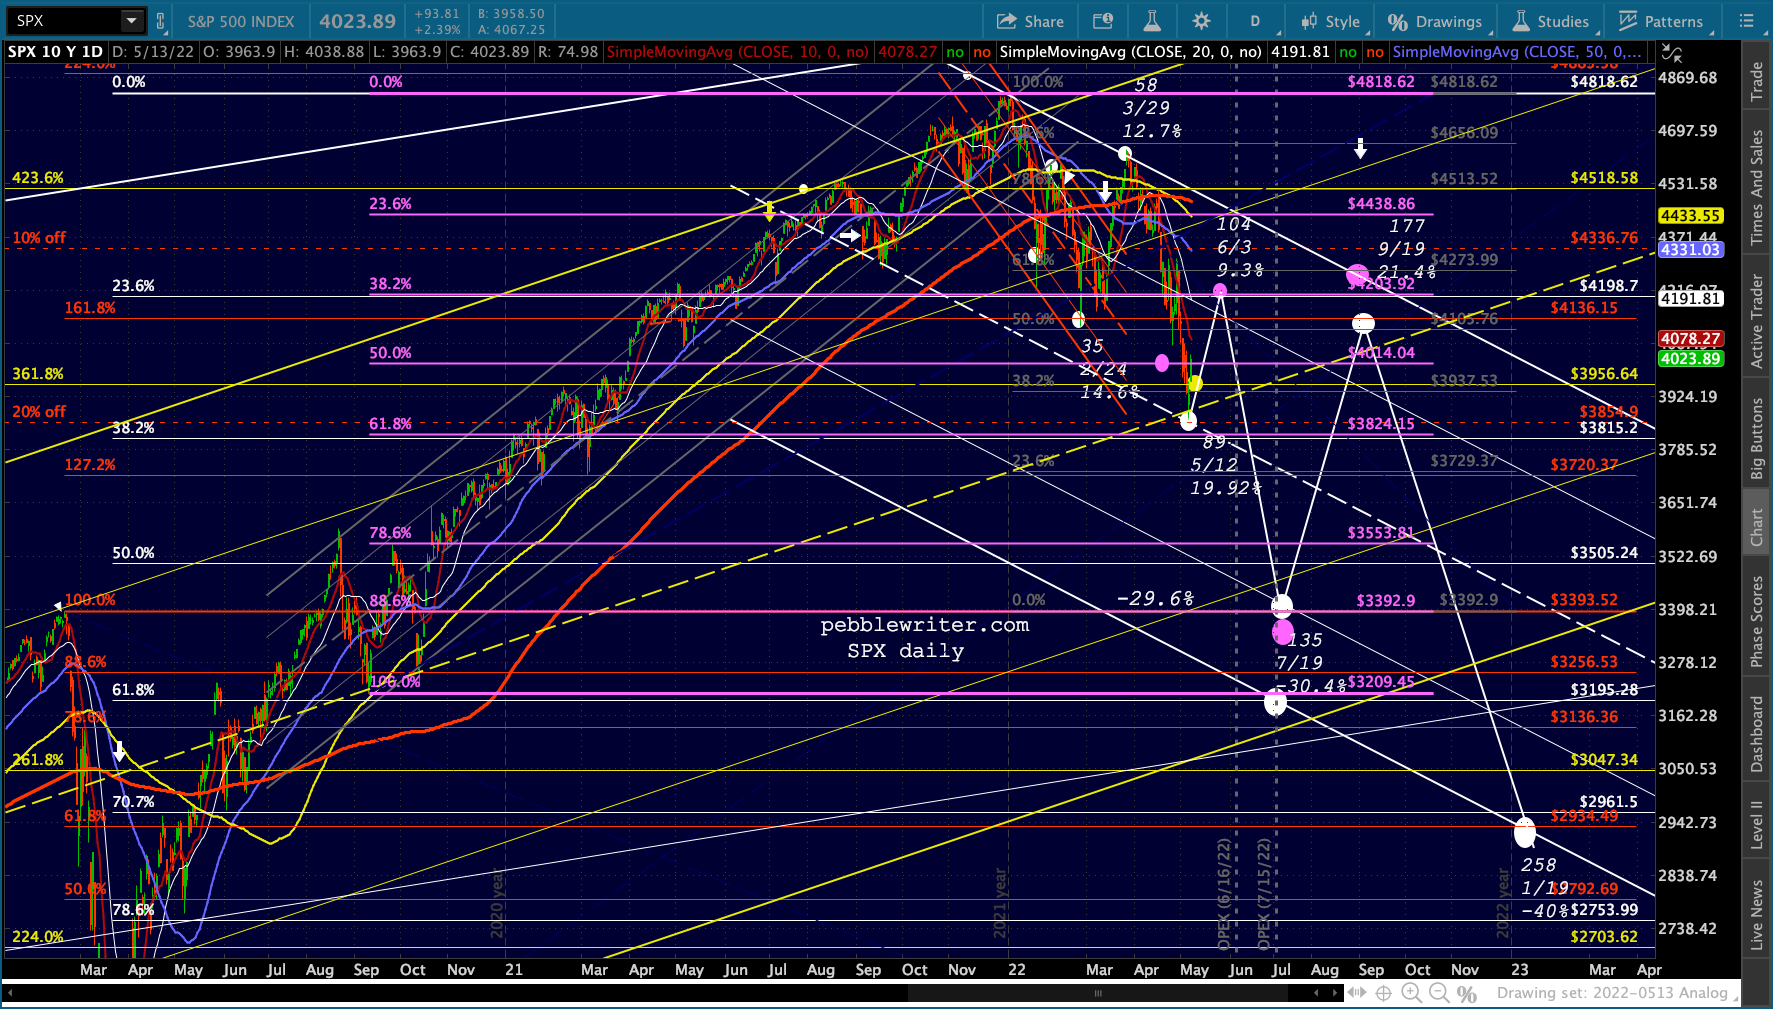
I like the way the day ended with SPX/ES both back above the 3.618. Should be some serious short covering going on which would accelerate as they rise above the SMA10 and SMA20.
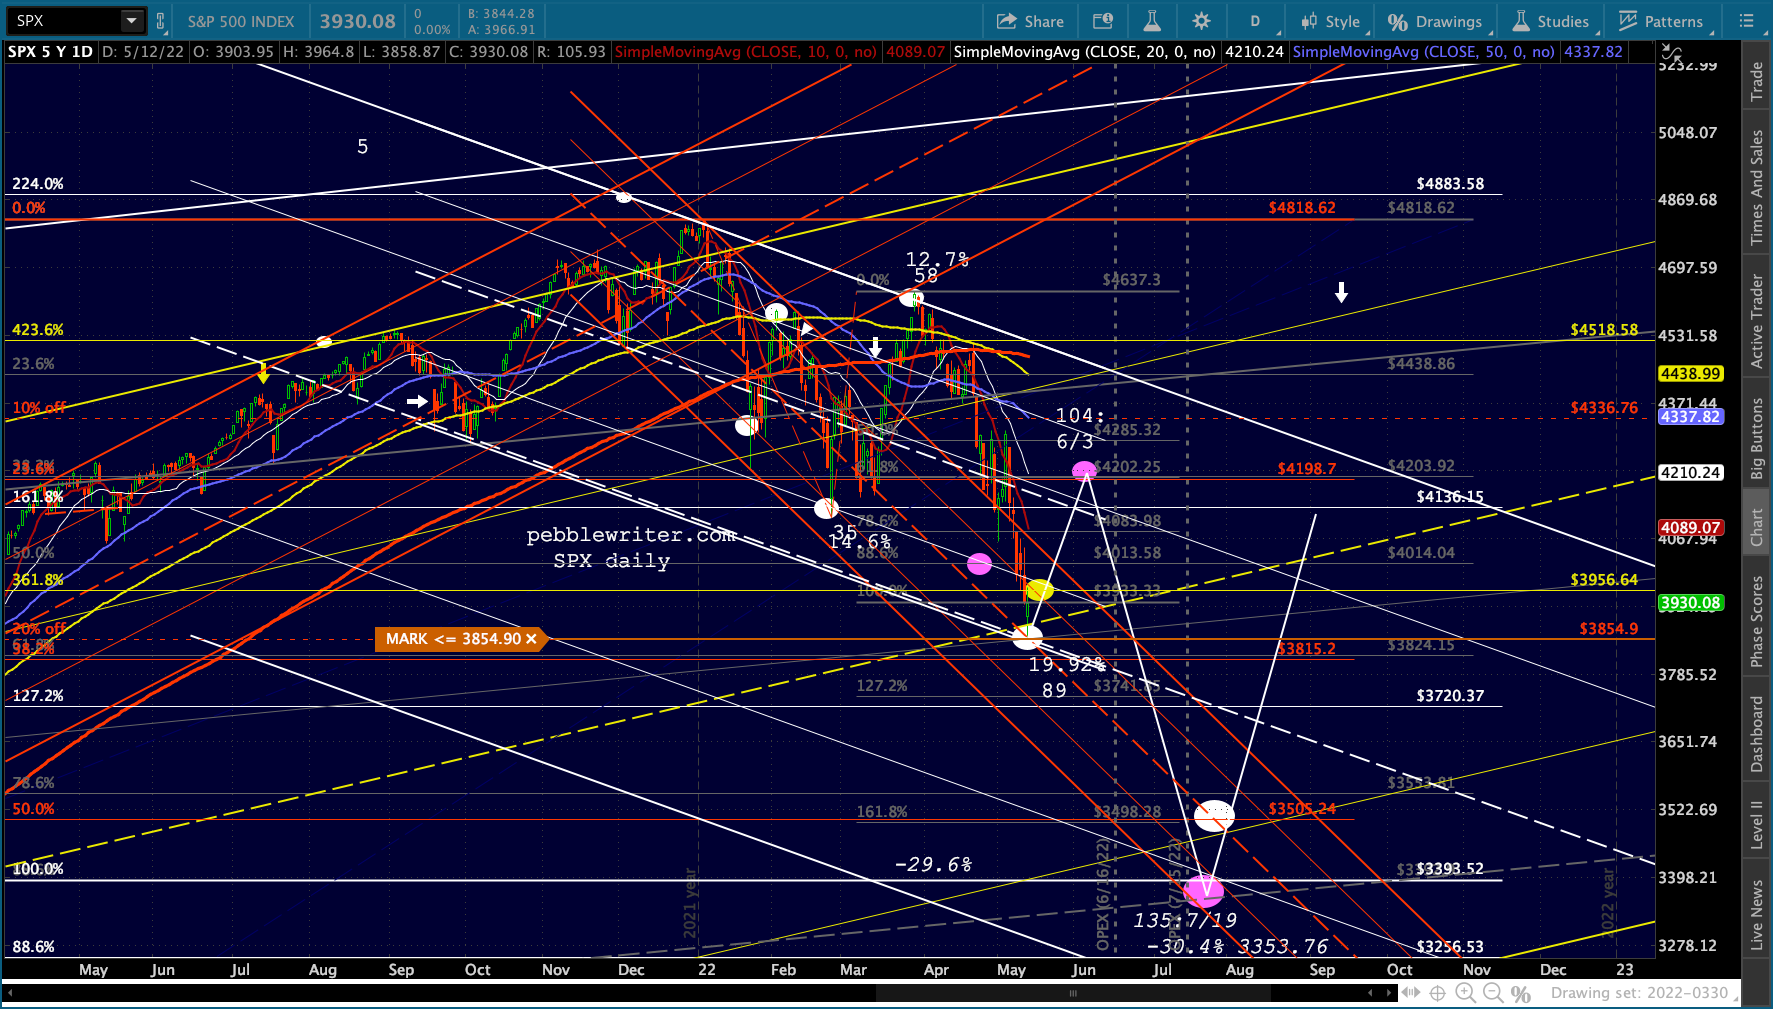
If it plays out as did 2000-2003, it would look like this. For new folks, the gist of it is to reflect the same percentage moves in the same time frame. With any luck, we even get similar retracements (e.g. 61.8% drop) here and there too. For a refresher, I recommend the analog primer mentioned above, available HERE.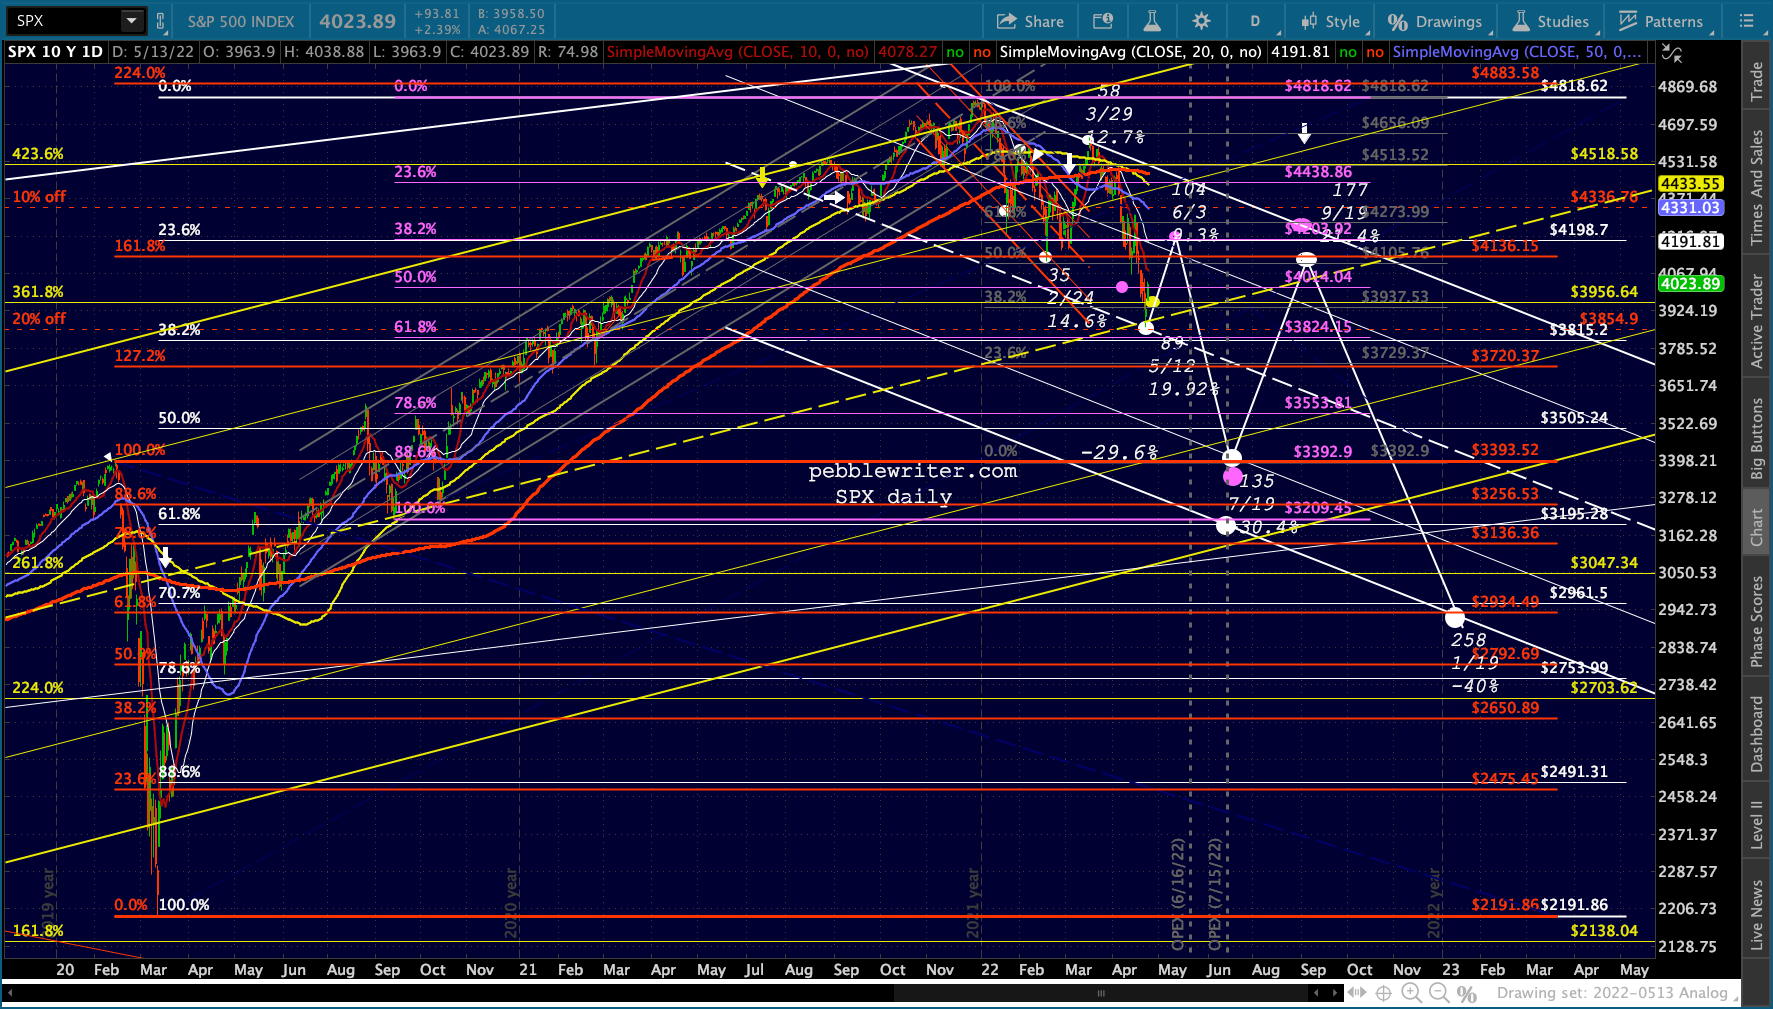
 I’ll be noodling on this over the weekend, adjusting where obvious changes need to be made. I have always liked the idea of a backtest of the Feb 2020 highs. So, I was excited to see that this one provides for one around July 19.
At that point, SPX would have fallen 40%. We all wonder what it would take before the Fed changes their mind about tackling inflation, or the Ukraine war ends and oil plunges 50%, etc. These things are impossible to accurately forecast. All I know is that the conditions leading up to this latest bull market are eerily similar to those in 2000: sky high, speculative prices, especially in tech.
There are big differences, as well. There was no ZIRP back in 2000. The 10Y reached 6.8%. Note, however, that SPX topped out when rates reached the top of the falling yellow channel.
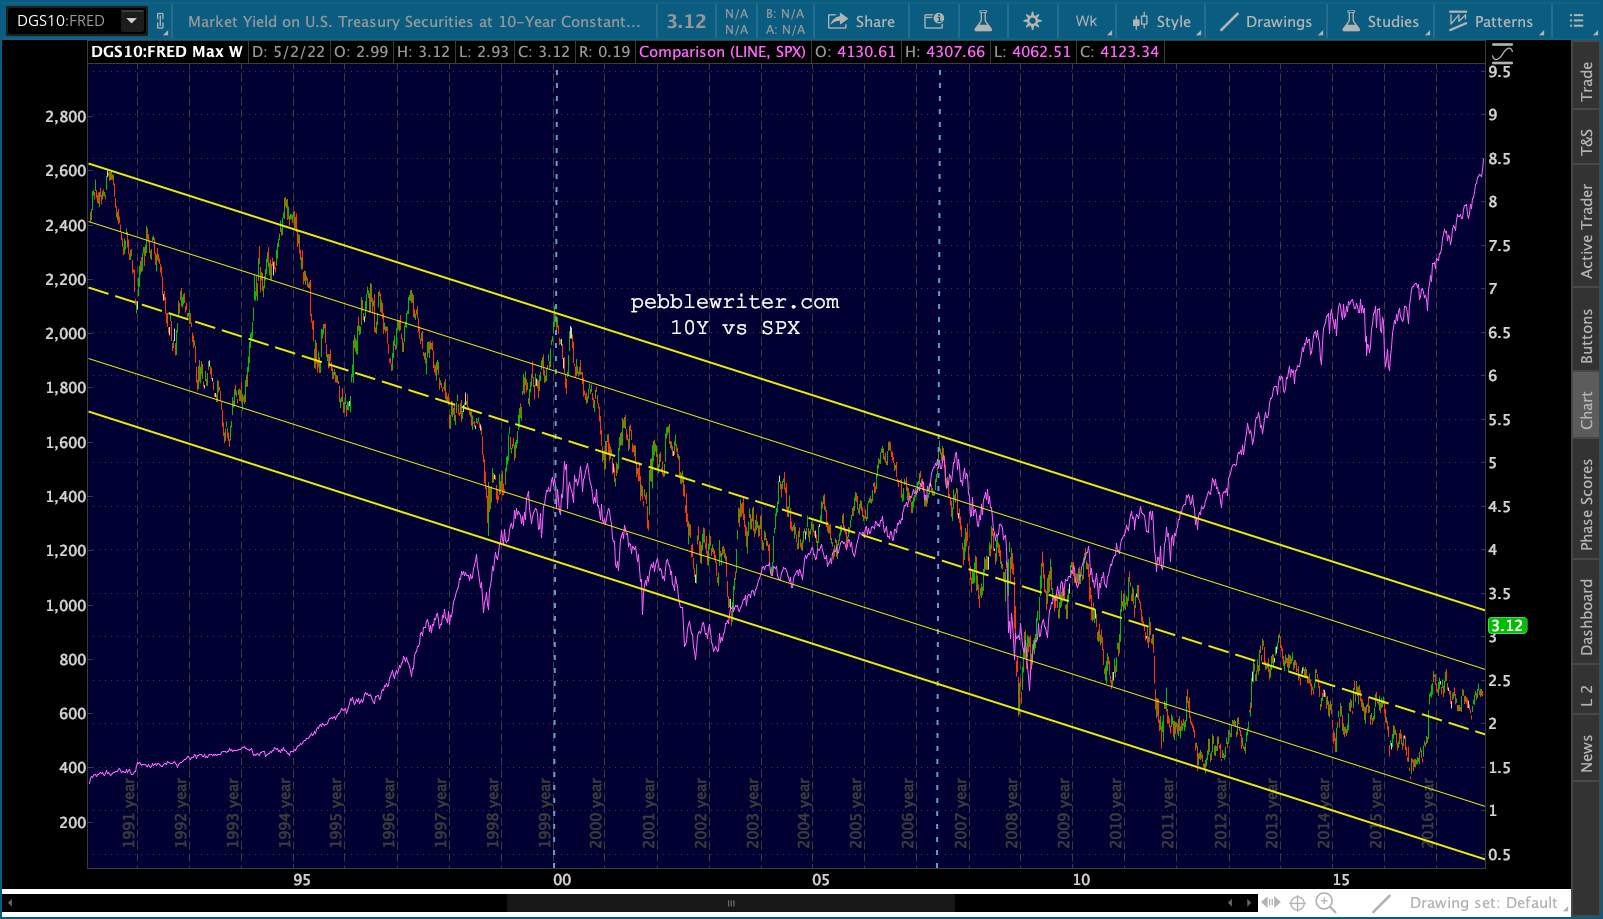 This time, the correction started when the 10Y reached the top – same as 2000, 2007, and 2018 – and has accelerated as the 10Y pushed above the top. Arguably, this is a much more serious situation given the $30 trillion in debt in just the US.
 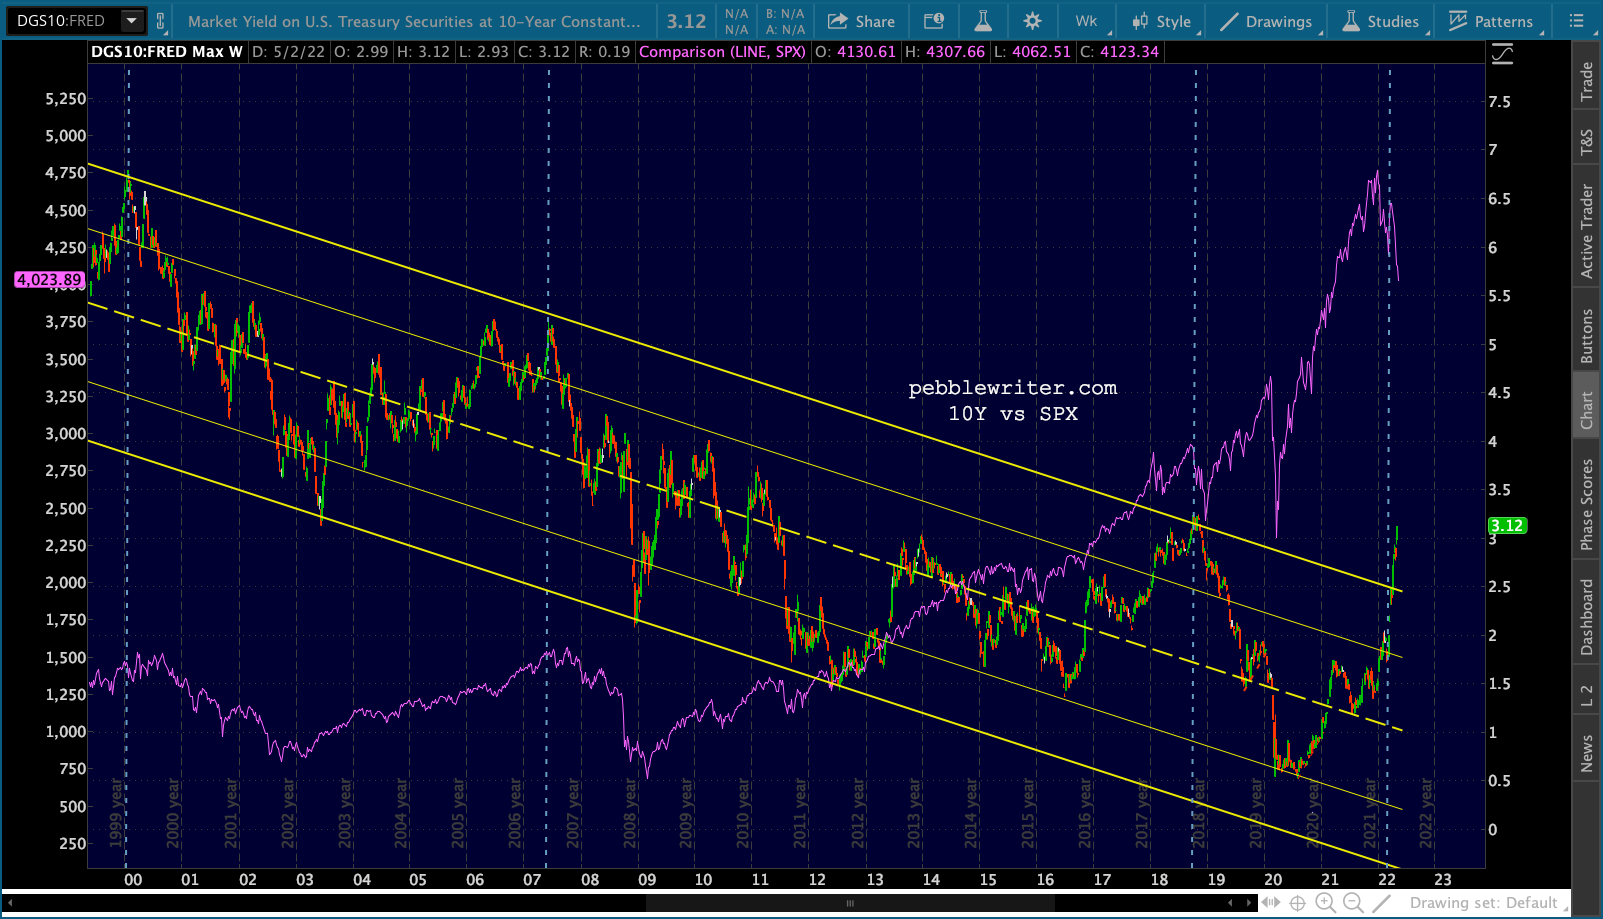 Another difference – at least so far – is that those past deadly spikes in the 2s10s occurred when the 2Y plunged faster than the 10Y.
 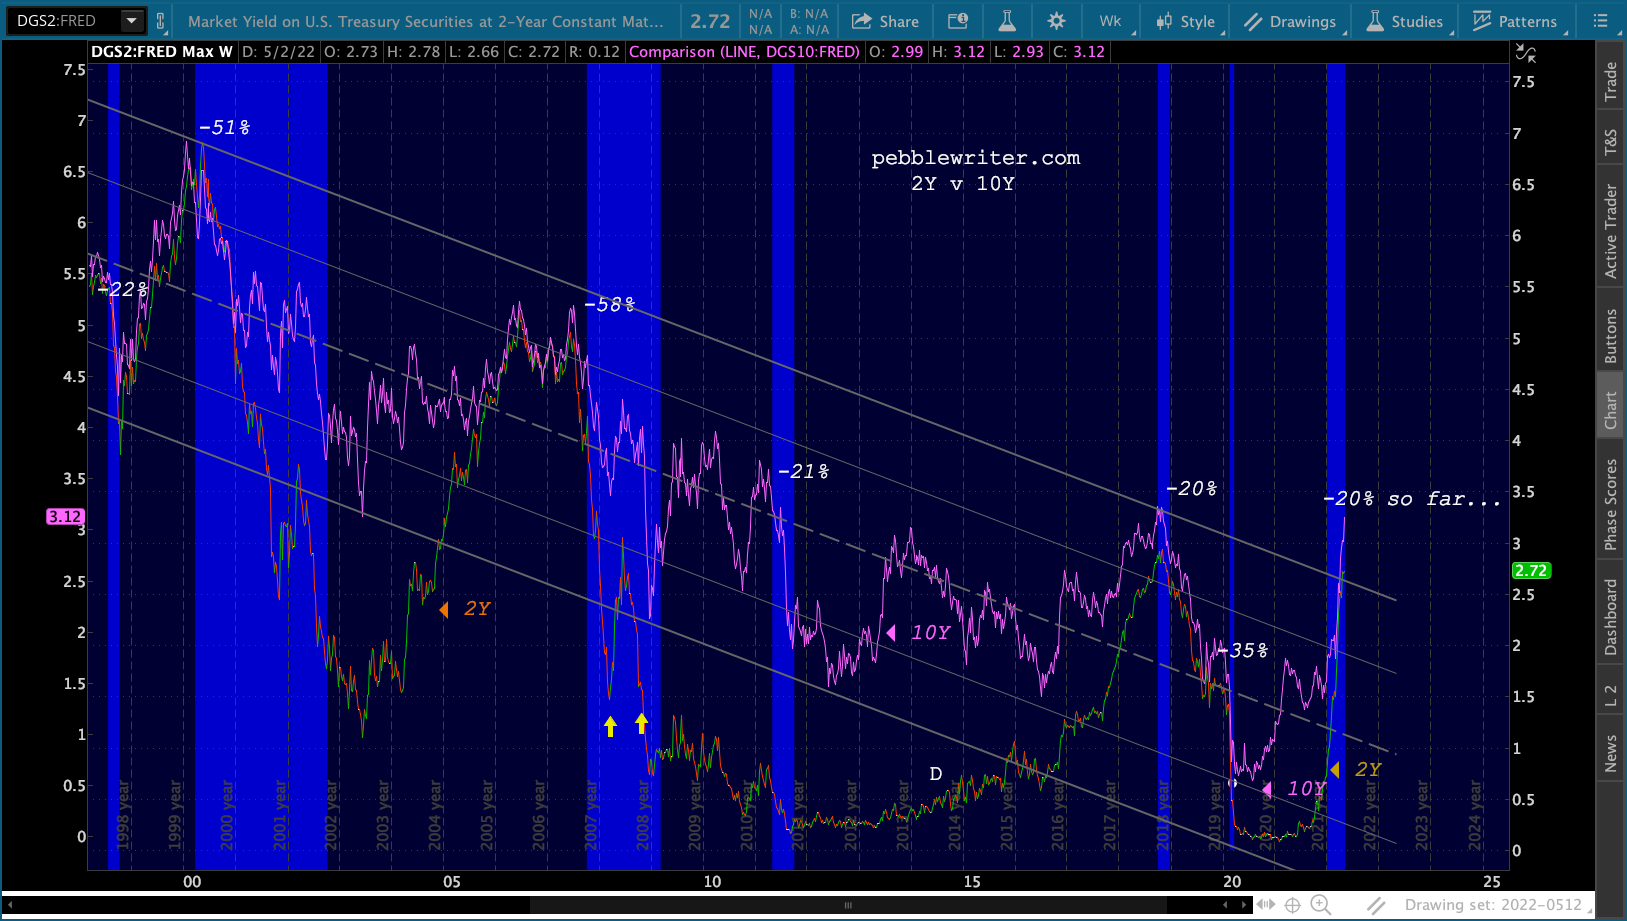 This time, they’re both heading higher. It’s just that the 10Y is outpacing the 2Y.
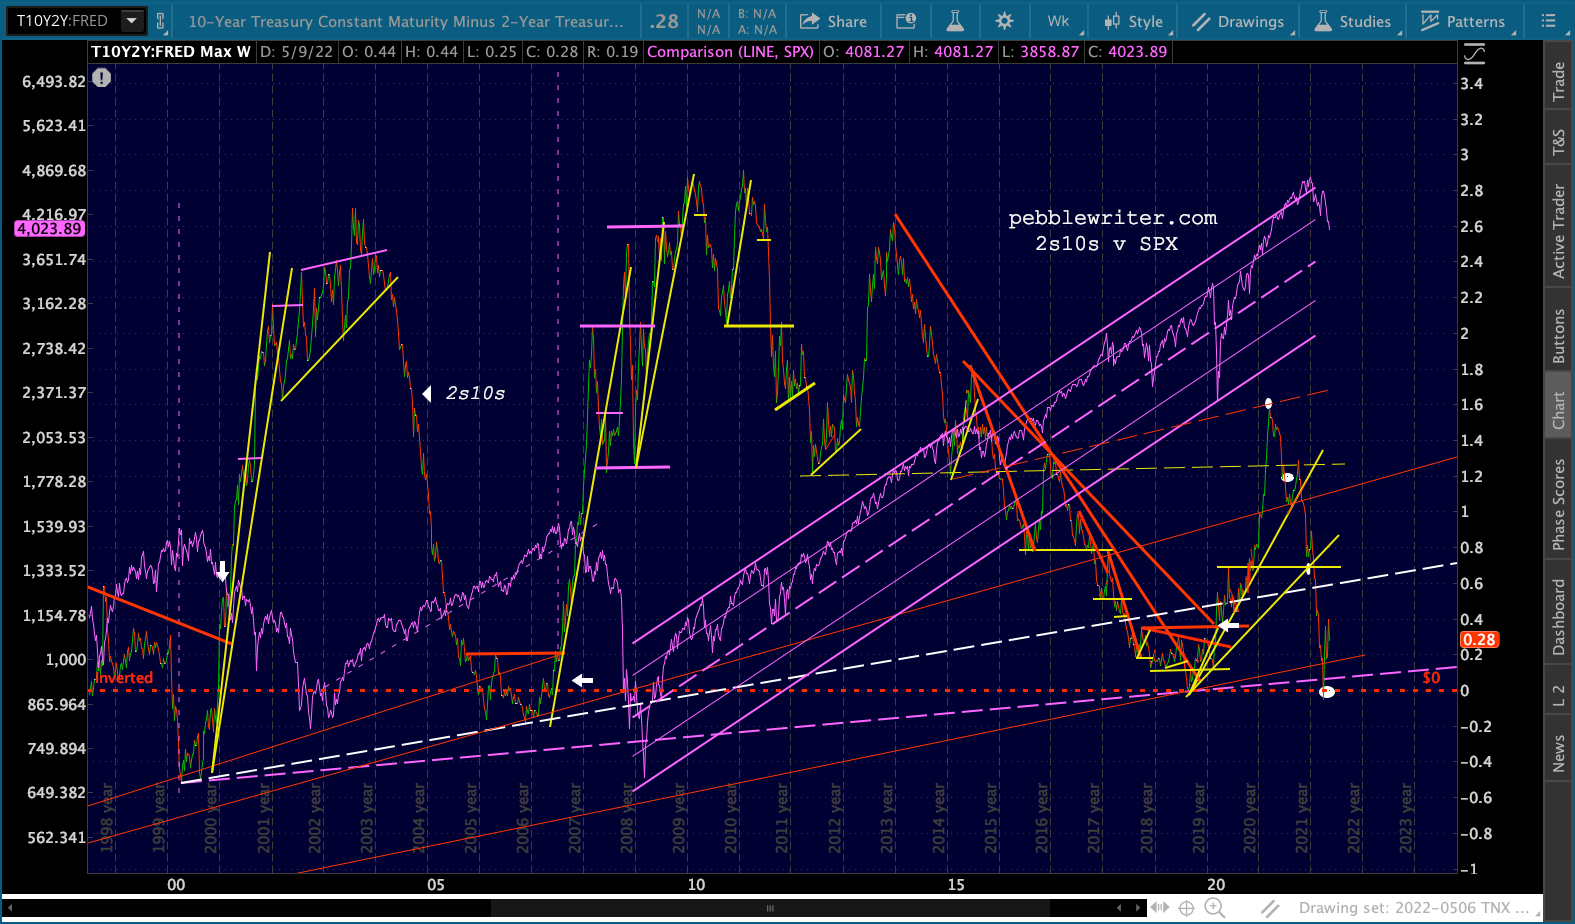 I suspect these things will sort themselves out – particularly if/when panic sets in and flows into bonds accelerate. Right now, bond prices are taking it on the chin thanks to QT and rate hikes.
Stay tuned.
continuing…
Comments
2 responses to “Analog Watch: May 13, 2022”
1962 slide is very similar to this analog too. Not quite the near term bounce, but similar downside target over next 2 months.
Thanks, Corey, I’ll take a look.