

In a bit of a delayed reaction to Treasury’s announcement of its $3 trillion borrowing needs in Q2, the 2s10s has pushed above the white TL connecting all-time lows – a clear warning, should it last, for equities.
 Meanwhile, CL backtested its Feb 2016 lows and USDJPY broke down at about the same time that ADP announced another 20 million job losses (roughly in line with Friday’s NFP.) All of this came on the back of dismal earnings from market darling Disney.
continued for members…
Remember that 26.05 was our favored upside target…
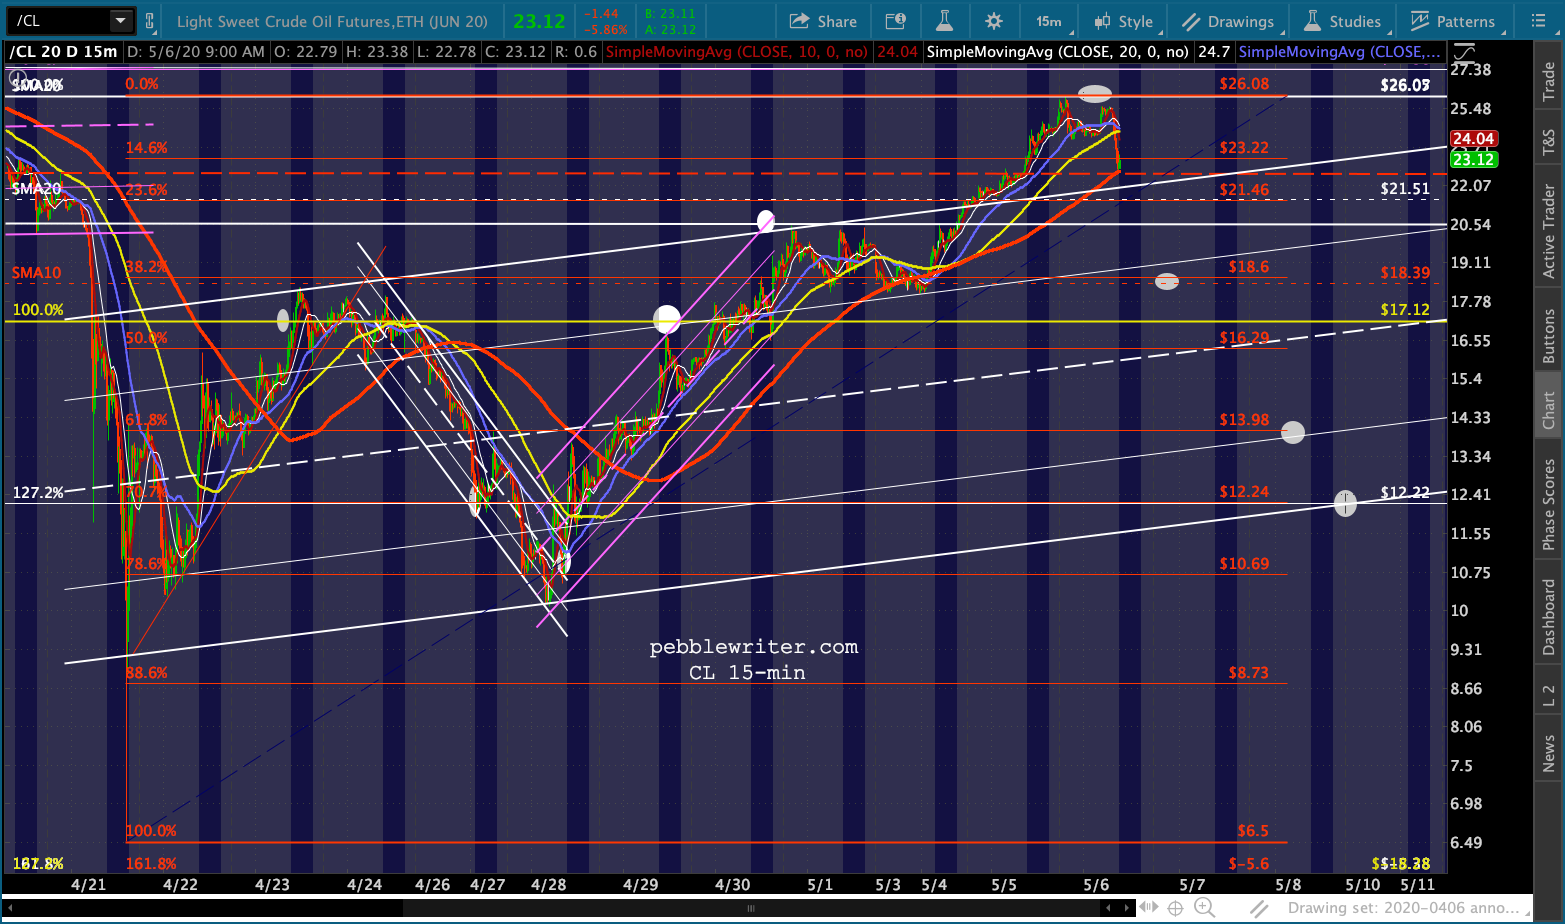 …as it’s important horizontal resistance. It should be shorted here with reasonable stops as the EIA inventory report is due out at 10:30.
 RB has also backtested its 2016 lows and should be shorted.
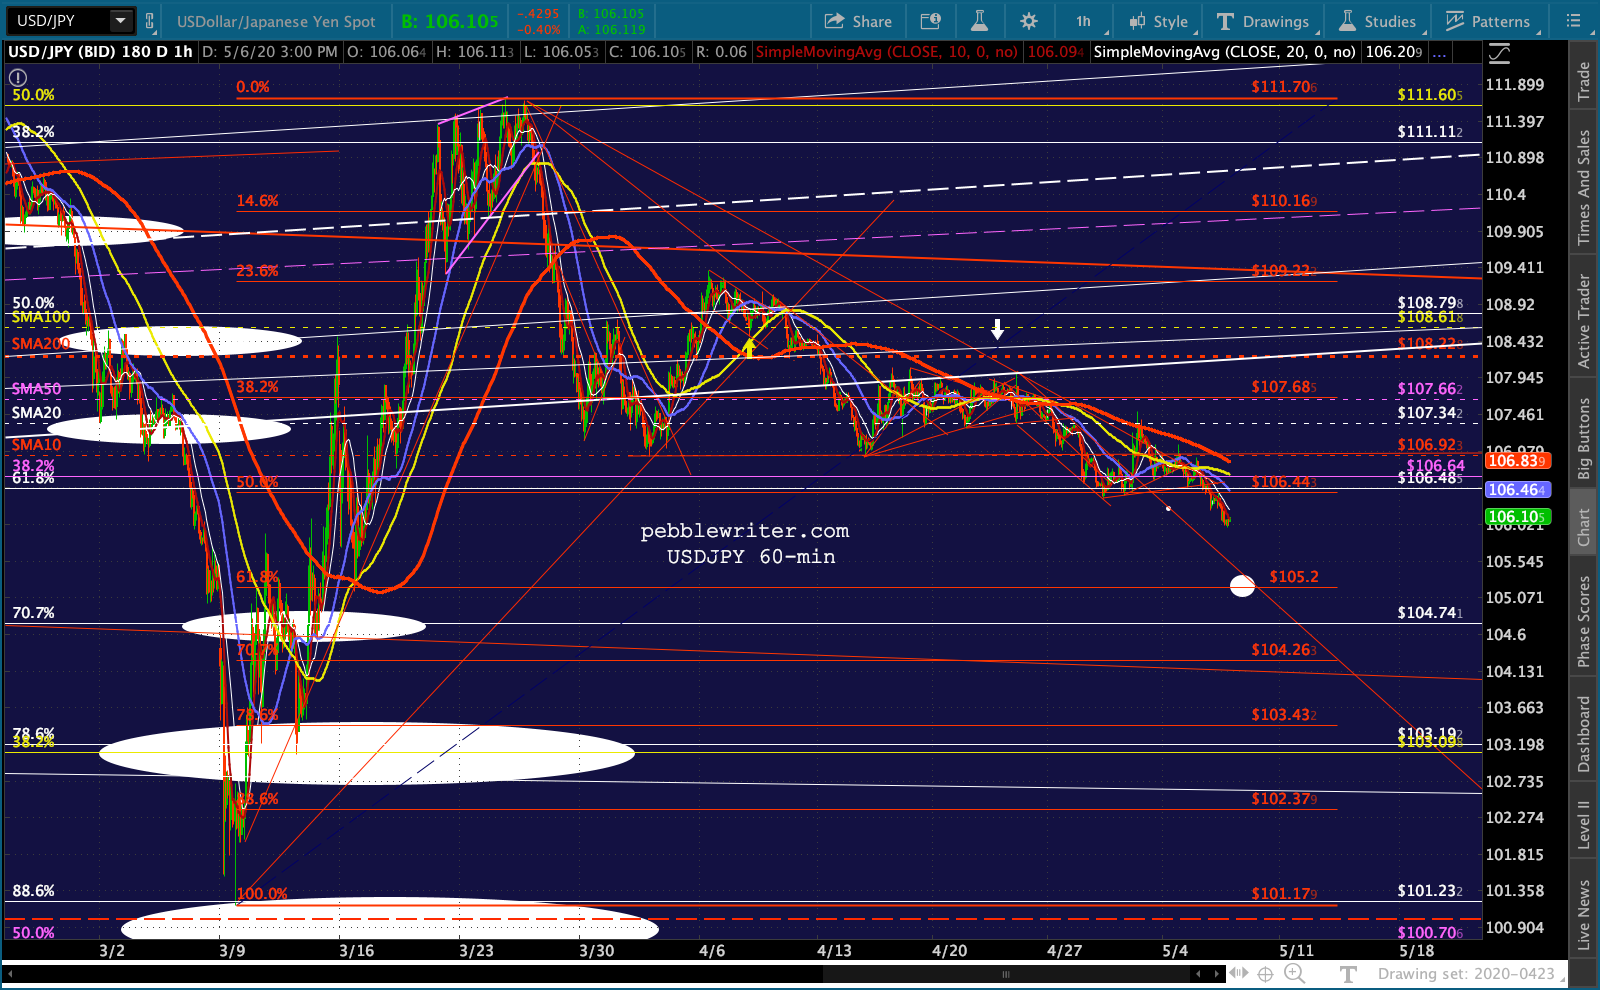
 USDJPY’s breakdown…
 …and another test for VIX…
 …leaves stocks in a precarious position after tagging the .618 retrace following a larger scale .618 retrace.
 This is as good an opportunity as SPX is likely to have to reach its 2.24 at 2703. If SPX doesn’t break down either today or tomorrow, 2703 would require the rising white channel to break down.
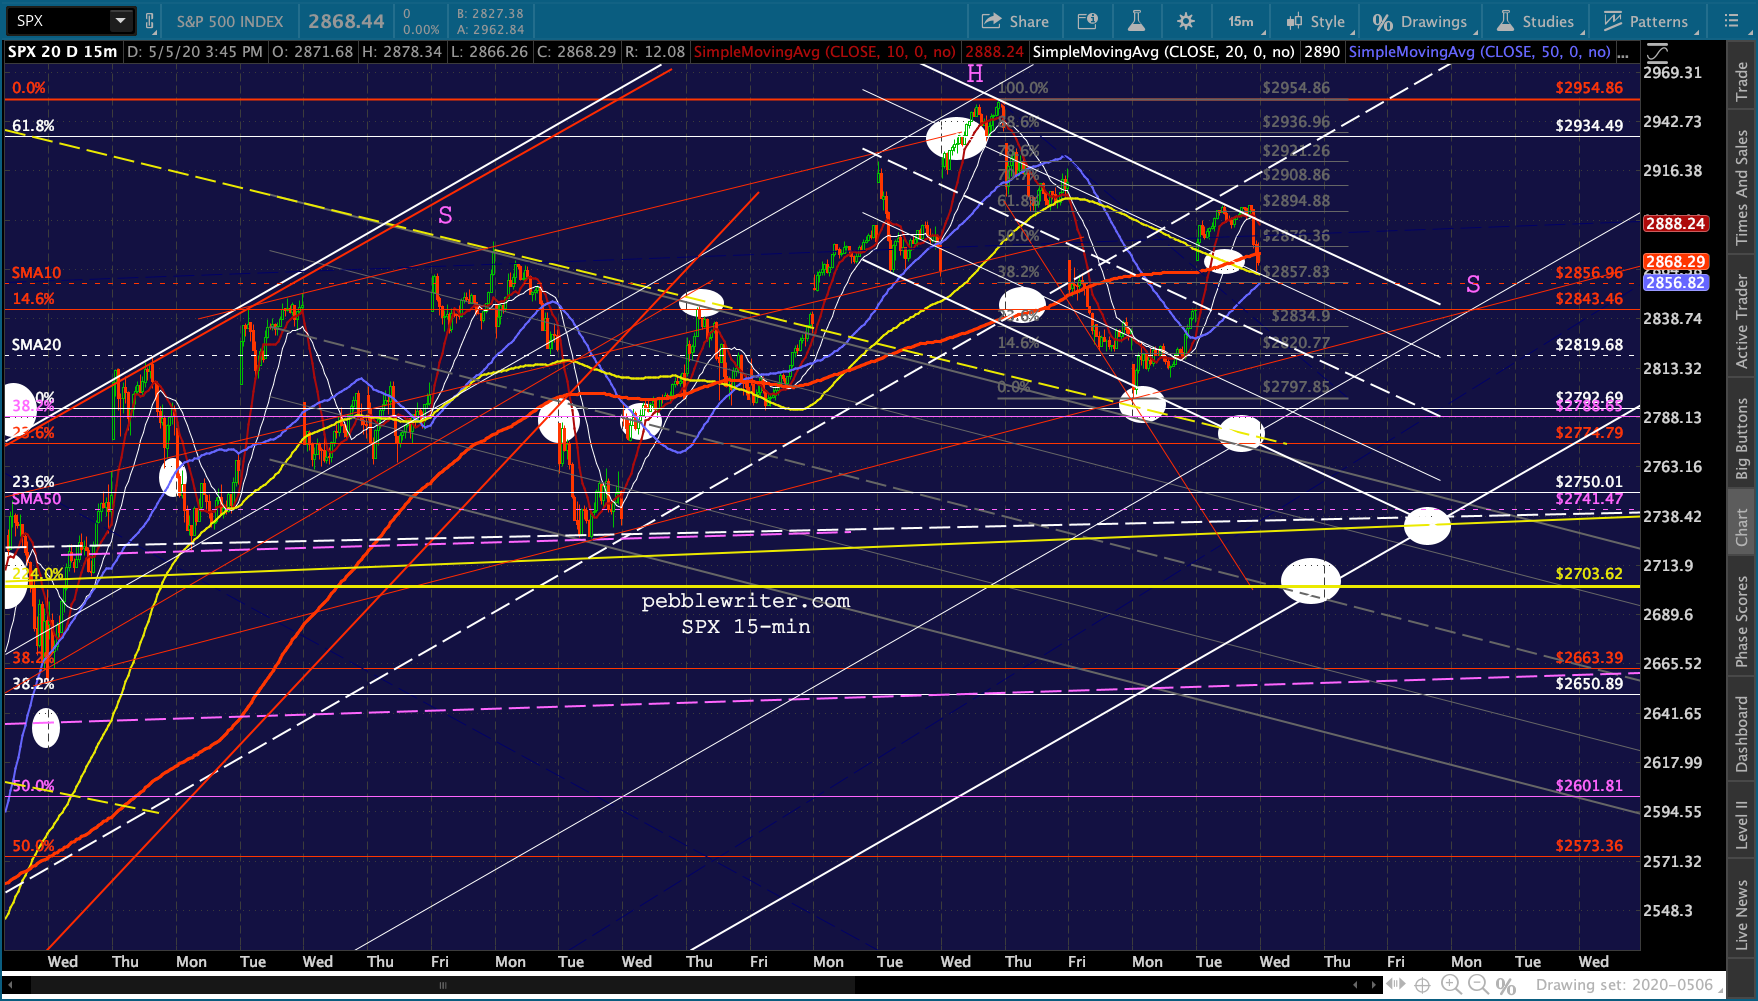
 …though VIX could spoil the bears’ party with a breakdown.
Elsewhere, the EURUSD is sliding, supporting the notion of the long-awaited 1.0592 tag and DXY’s breakout to 101.78.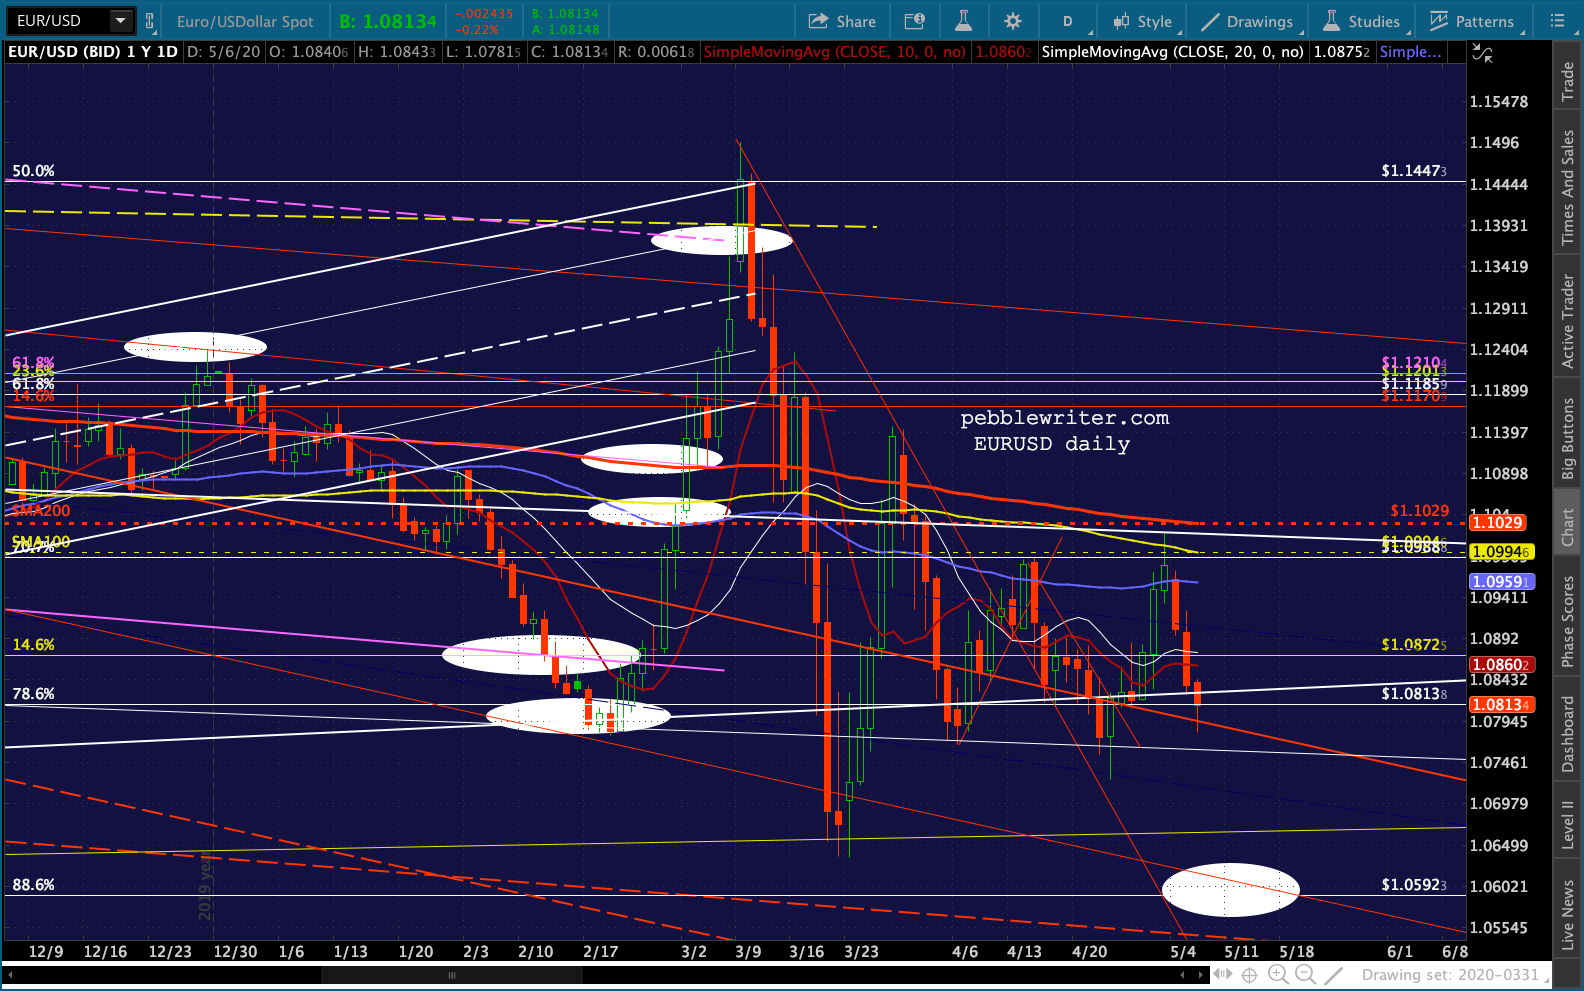
 A reminder of how the yield curve model works…
Breakdowns below horizontal or trend line support (the yellow lines below) signal equity weakness – sometimes pretty significant. Breakouts above horizontal or trend line resistance (the red lines below) signal very significant equity selloffs.
The biggest potential resistance line in the last 20 years is the white, dashed trend line connecting the 2000 and 2006 lows. 
The 2s10s, which registered .11 on Feb 21, broke above this line and reached .80 on Mar 19 March, providing a solid warning for SPX’s 35% crash. It since retreated, helping stocks recover. 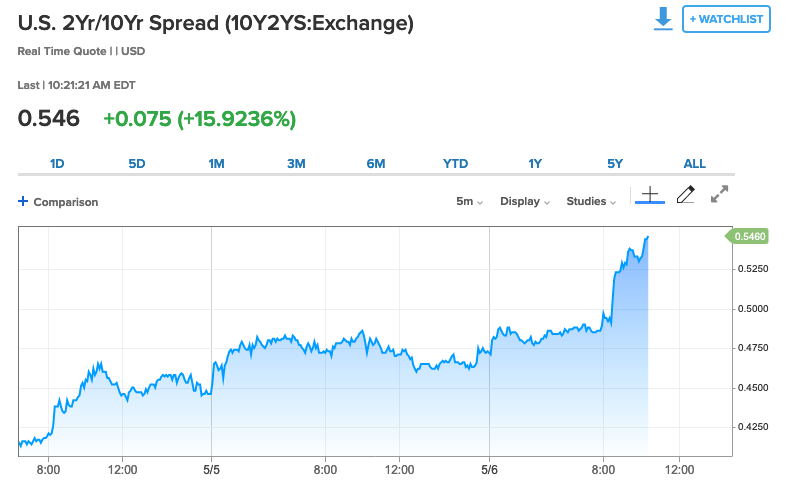
Now it’s breaking out again, topping its Apr 14 highs and reaching .555 this morning (note that the ToS charts show daily closes, so the actual highs/lows aren’t always reflected.)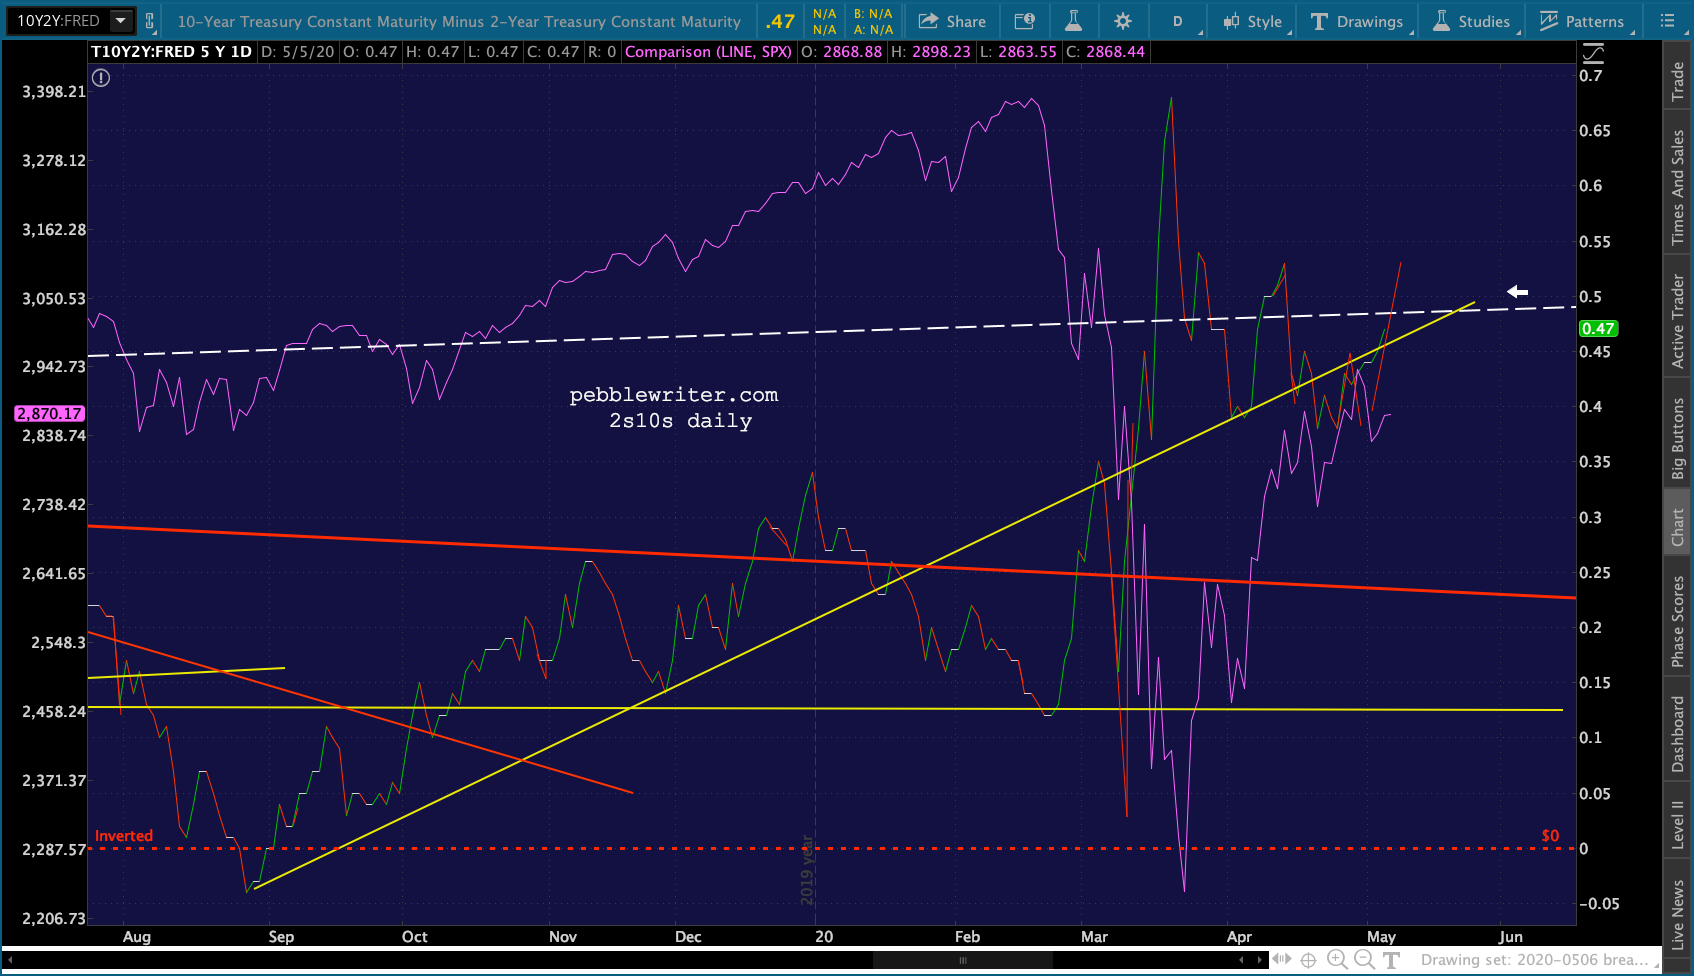 The risk of using this methodology to short equities, of course, is that the Fed takes action to suddenly collapse the spread. And, with the 10Y at 74 bps, the spread between it and the 2Y will necessarily be limited unless the 2Y goes negative – which I expect it will. So, keep a close eye on the 2Y, the 10Y and (especially) VIX.
More later.
UPDATE: 3:35 PM
It’s been a long day with nothing much happening, though this fits perfectly with the notion of a Thursday or Friday capitulation. This would be the calm before the storm. Note the H&S pattern forming on the 15-min ES chart below. It would complete around 2780 and target 2580. SPX is working on one that would target about 2500.
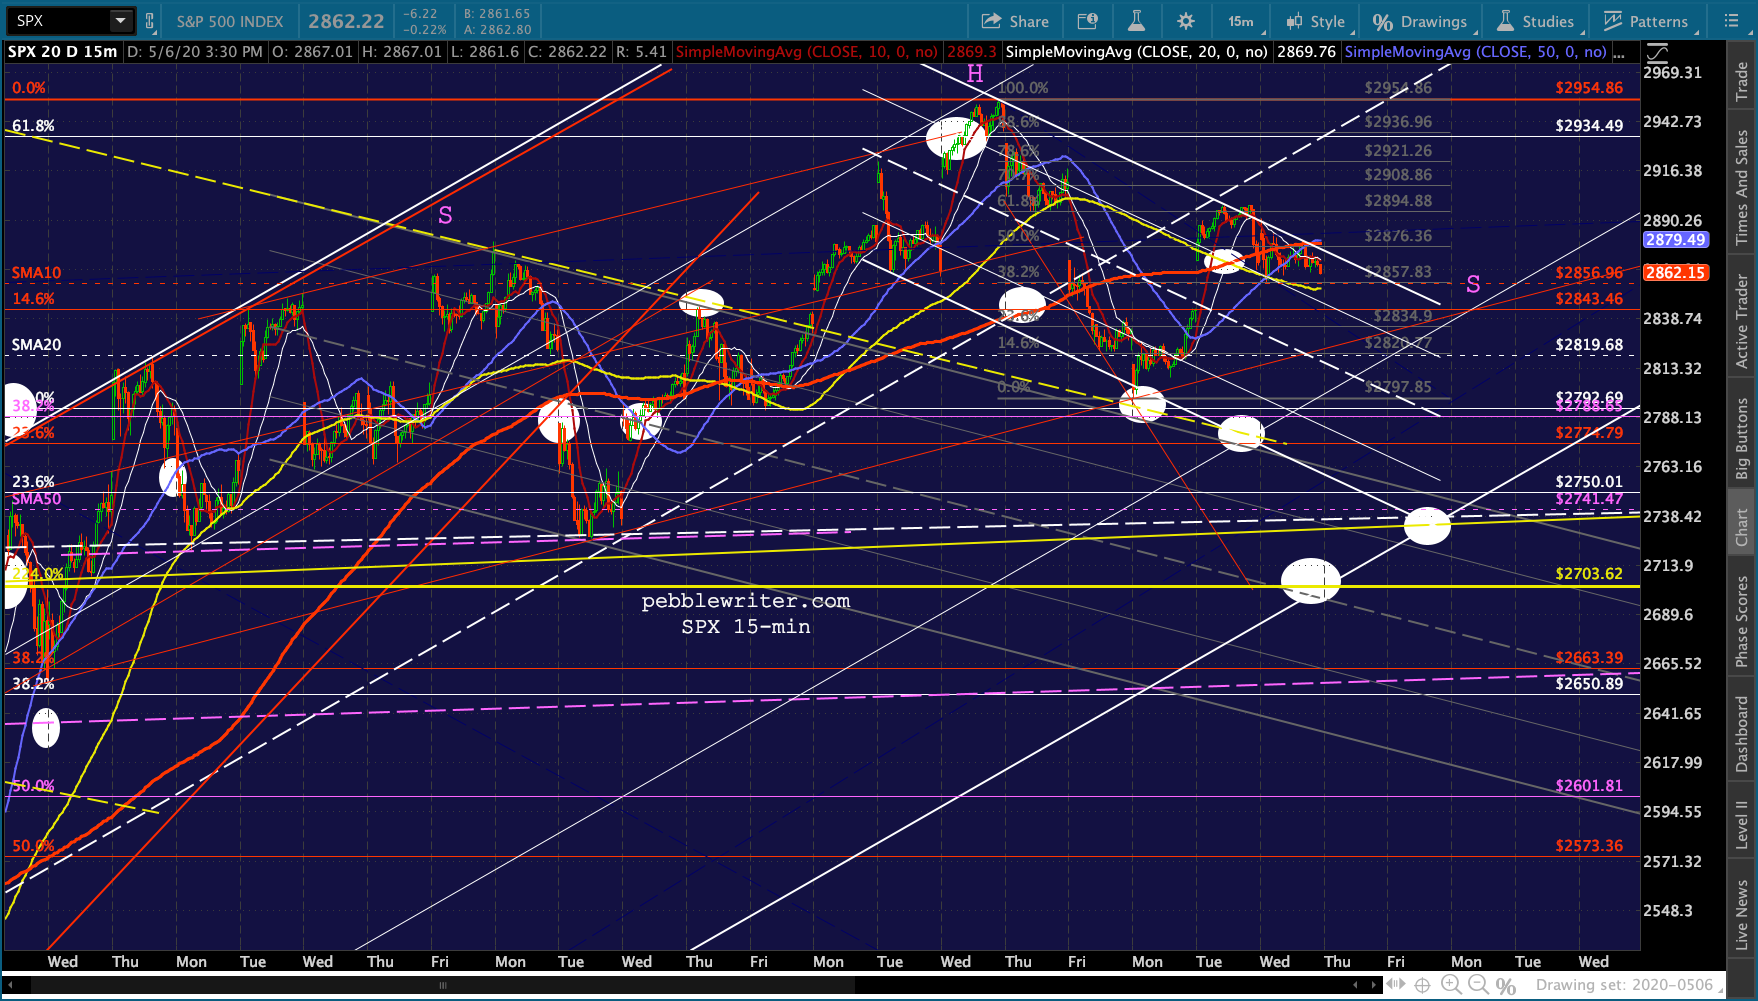


 The .618 retraces of ES and SPX would put them in the neighborhood of those H&S targets – provided the 2.24s are kind enough to get out of the way.
 Lots of important economic data is coming out over the next two days.
GLTA.