Yes, we’re getting yet another ramp job in front of the latest dismal economic news.
 Like all the others, this one was driven by another sharp drop in VIX, which finally managed to tag our 100-DMA target (but, only because the 100-DMA has been steadily rising.)
 It was also driven by a pop in oil prices, driven by Aramco’s announcement that it was raising the official selling price of Arab light crude offered to Asian customers by $1.40/barrel, to US customers by $1.50/barrel, and to Northwest European customers by $6.55/barrel.
The announcement did manage to push prices slightly above the Feb 2016 26.05 lows. But raising prices in a buyers’ market is obviously an exercise in futility. Its value is primarily in signaling algos that better times lie ahead — at least for a few hours so that any damage wrought by the unemployment data starts from a higher bar.
Speaking of unemployment, initial claims totaled 3.17 million, slightly above the 3 million consensus, and points to a total of 33.5 million for the past seven weeks for an unemployment rate of 16%. From Bloomberg:
 It remains to be seen whether reopening some states will make a material difference.
continued for members…
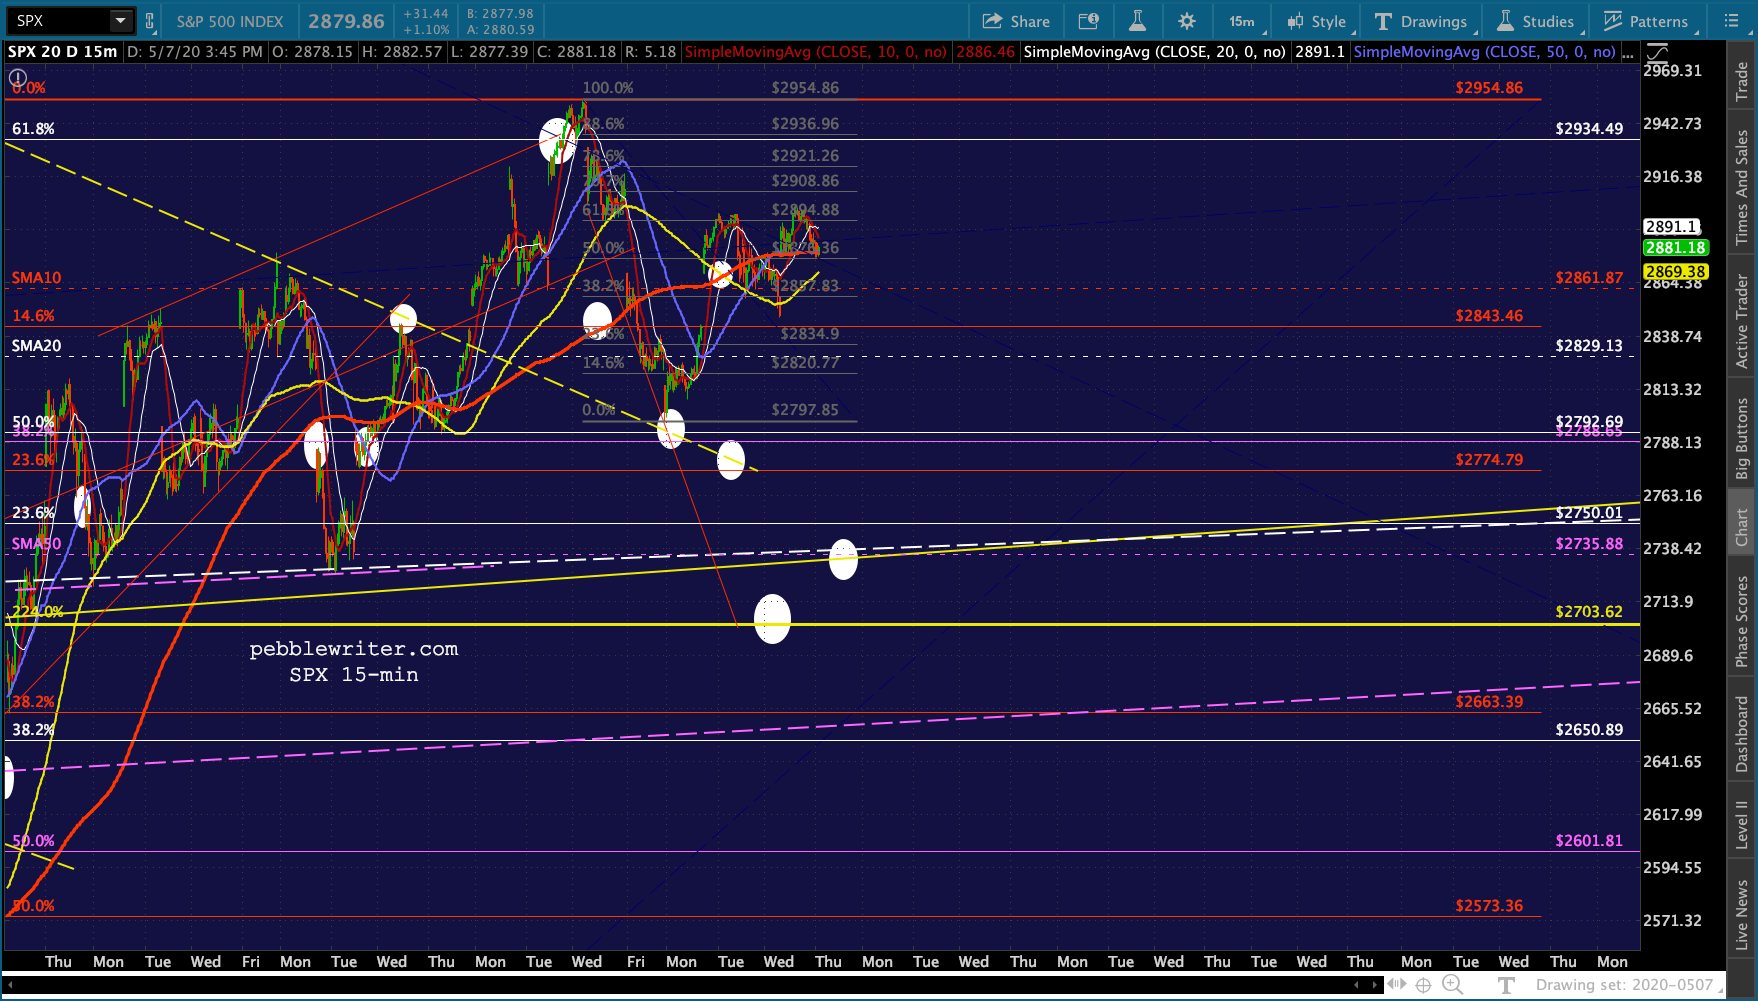
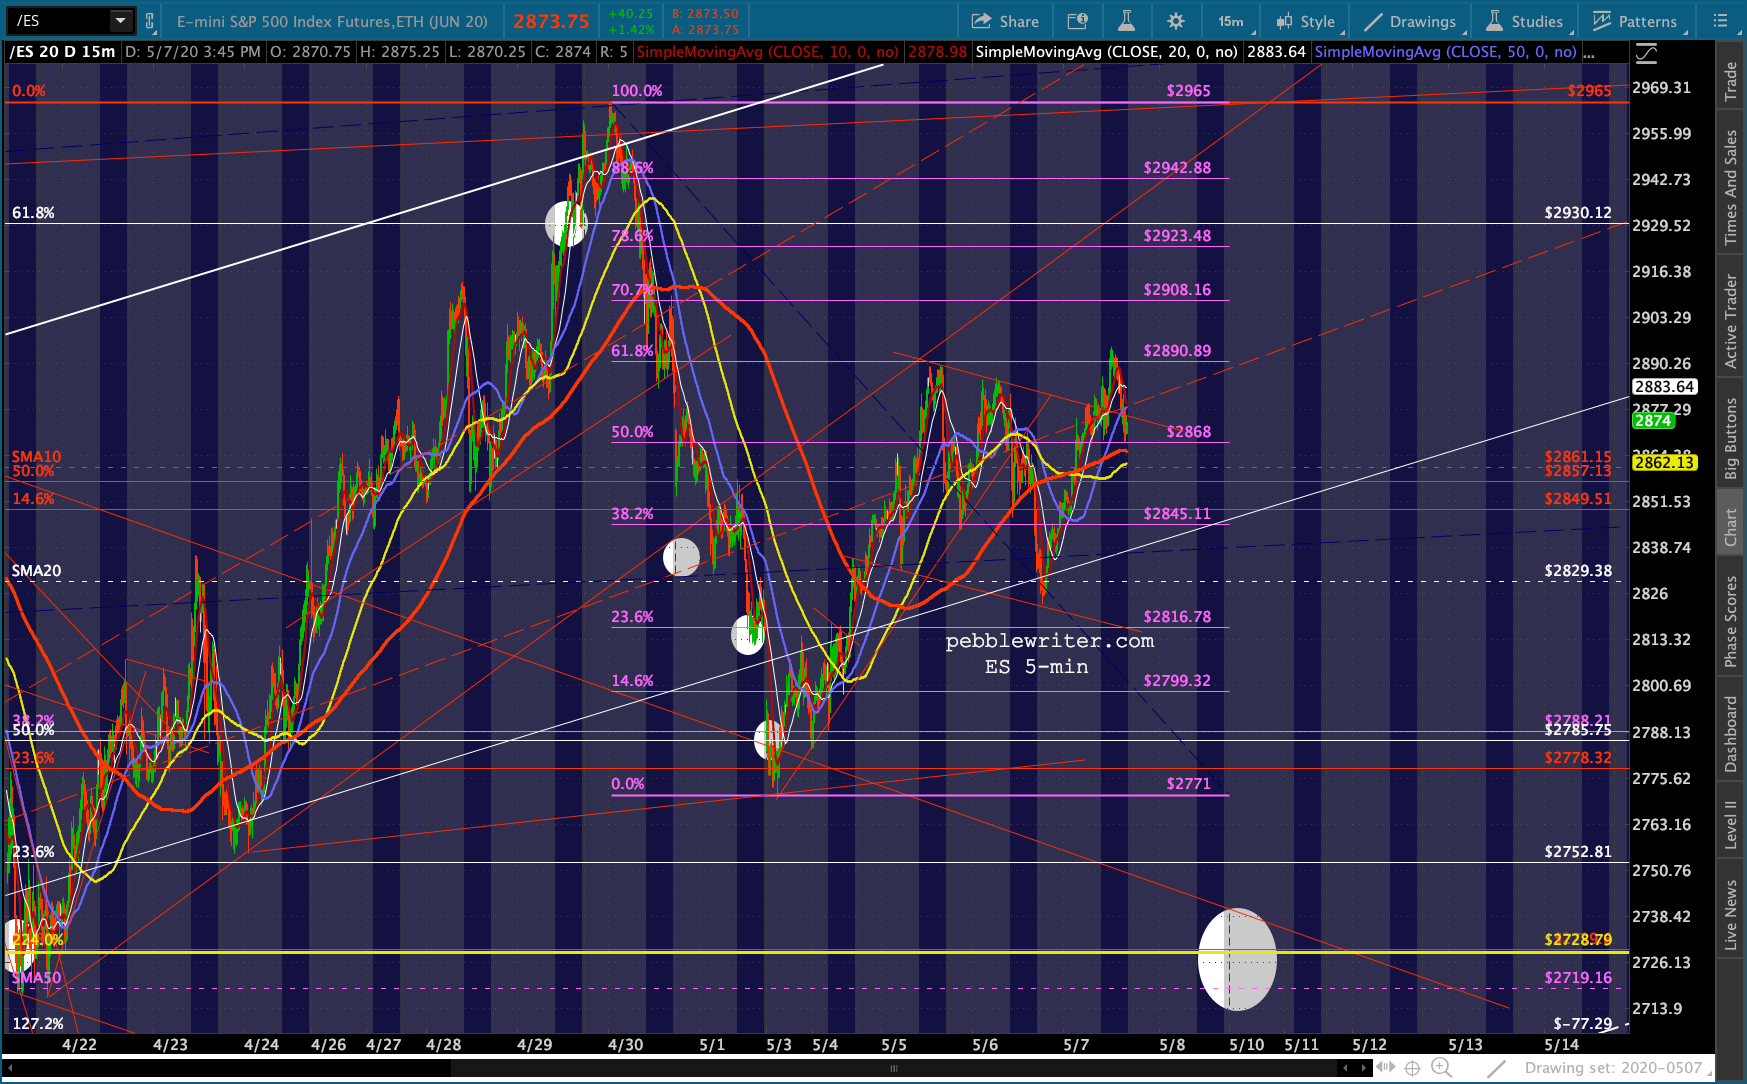
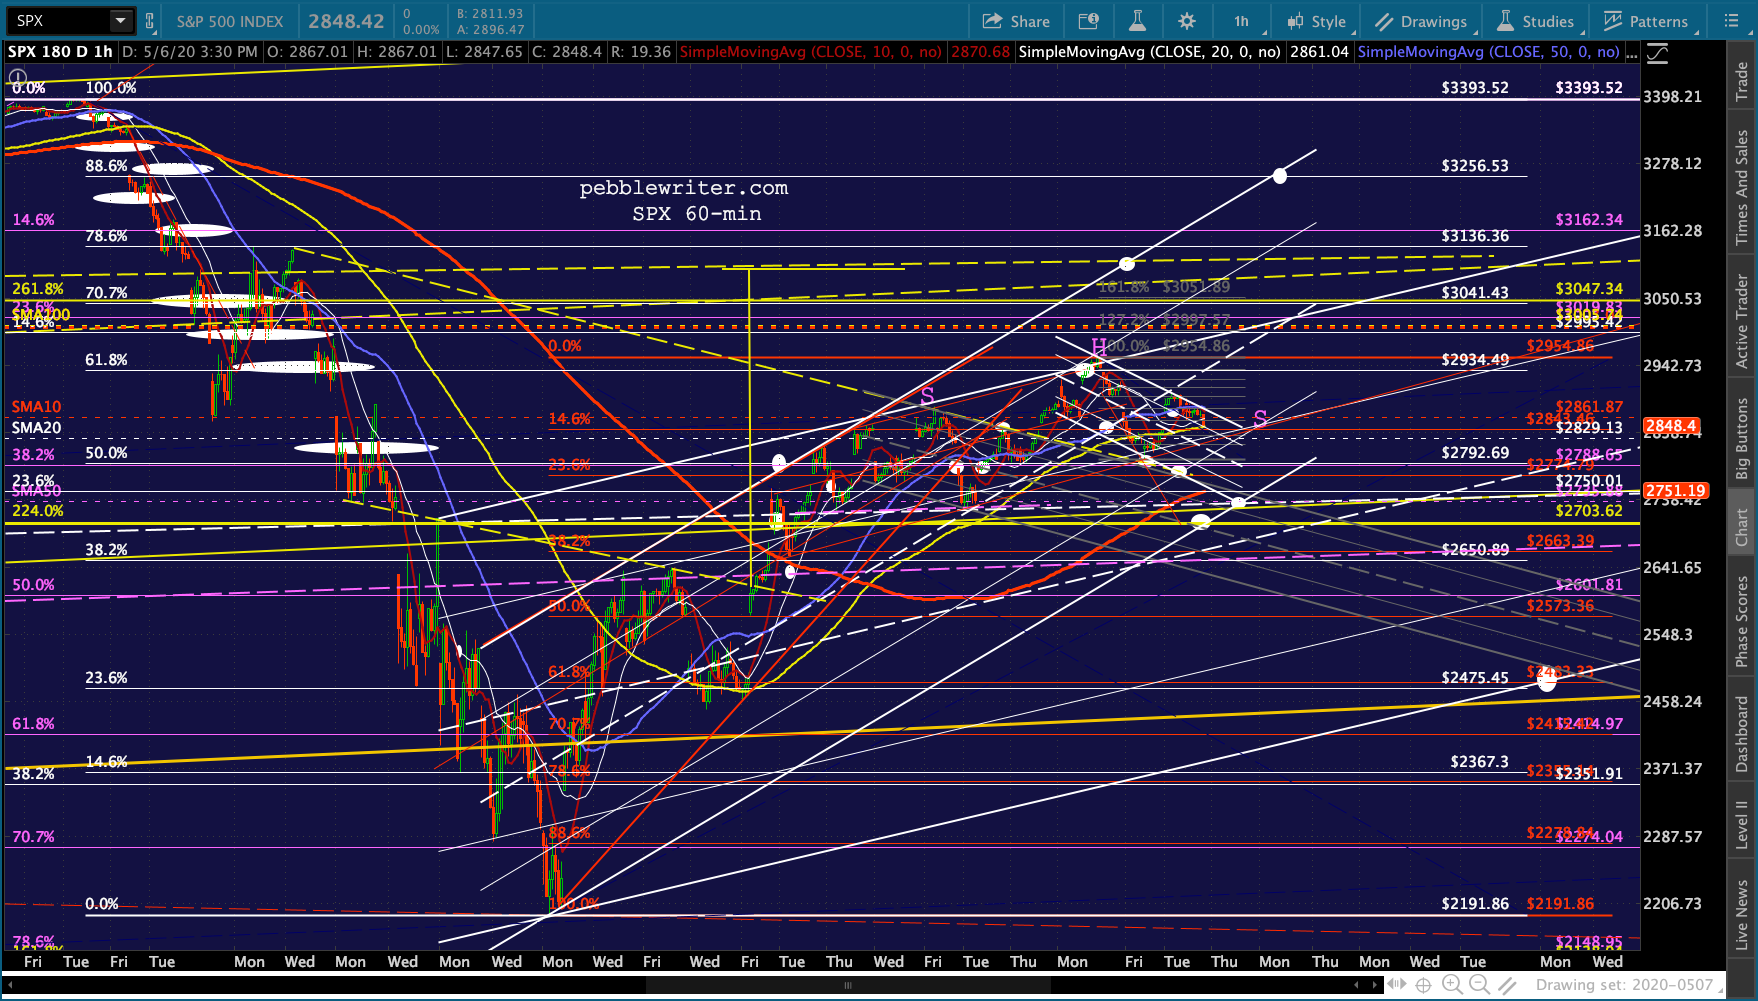
This leaves ES snuggled up against the top of a little flag pattern composed of slightly lower highs and lower lows. A flag pattern is considered a continuation pattern, with the implication that higher prices lie ahead…
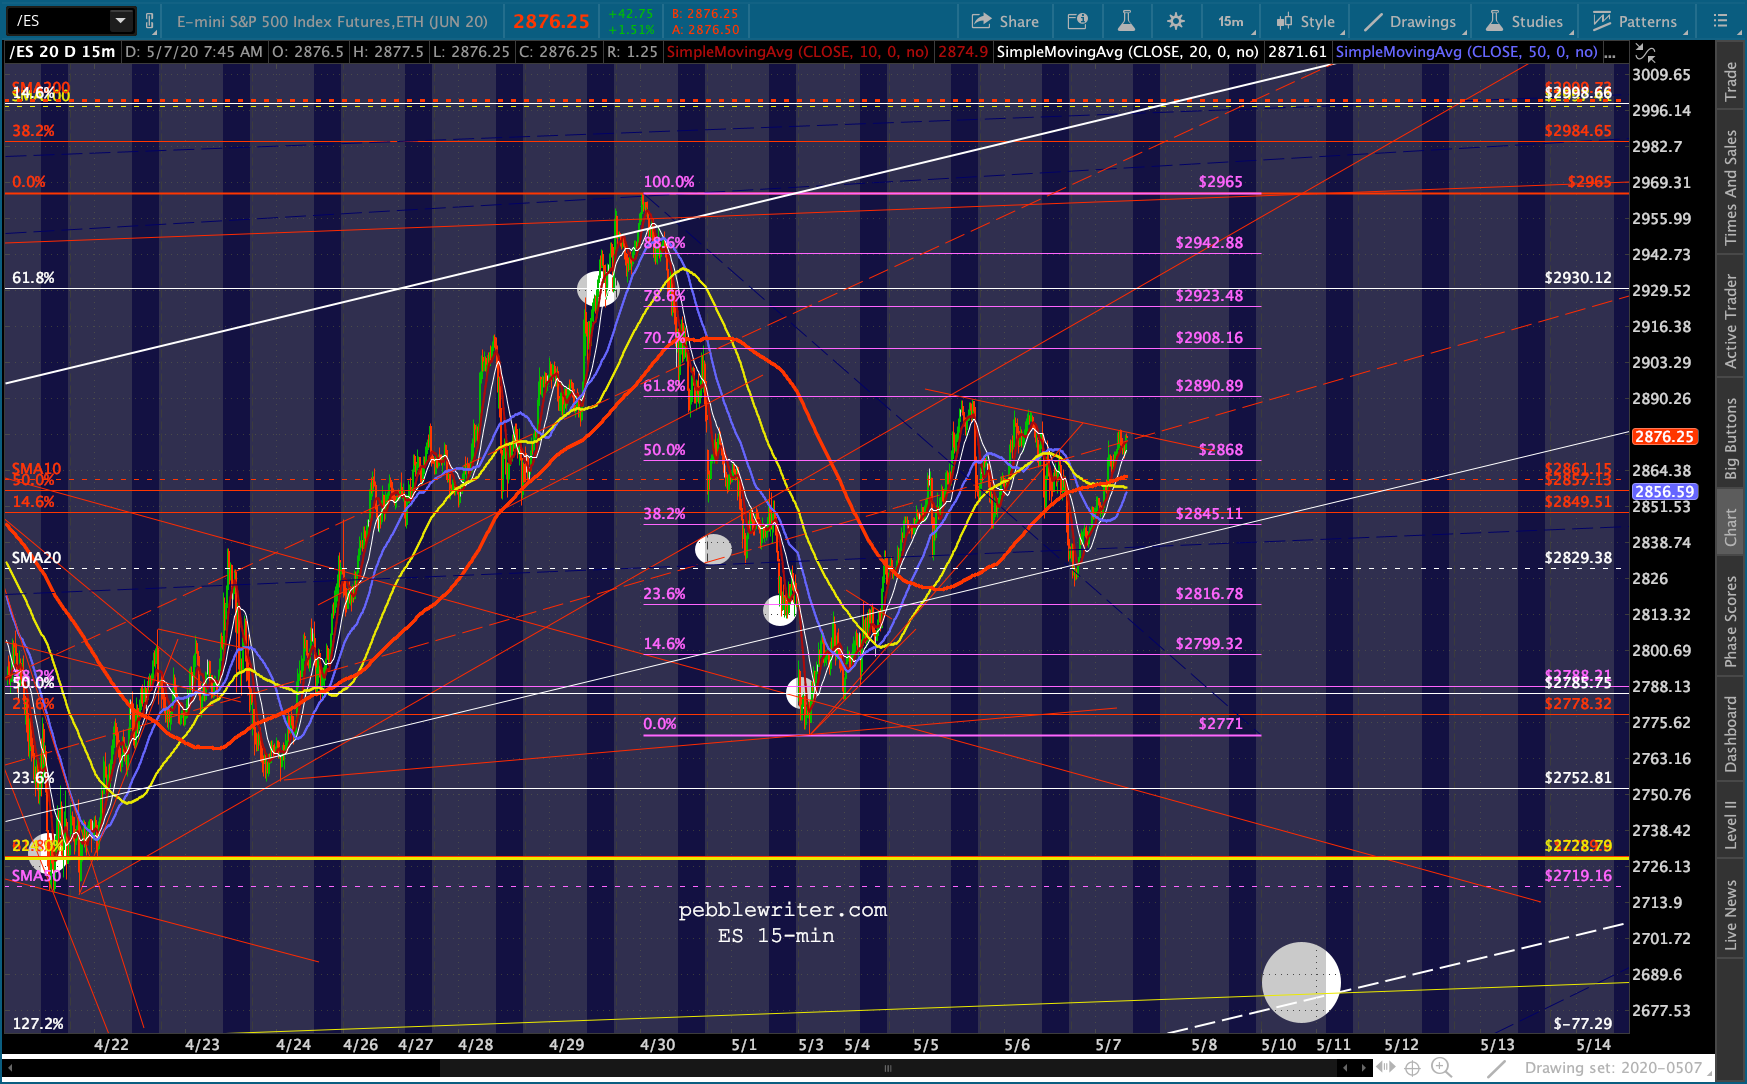 …except for the fact that the entire rally since Mar 23 is, itself, a big flag pattern (and rising wedge) that has yet to test its bottom. We called the white .618 on Apr 29 a turning point and continue to look for a test of ES 2728 and potentially SPX 2703.
 The SPX version shows that the overnight ES ramp should put SPX back at the top of the little falling white channel seen below.
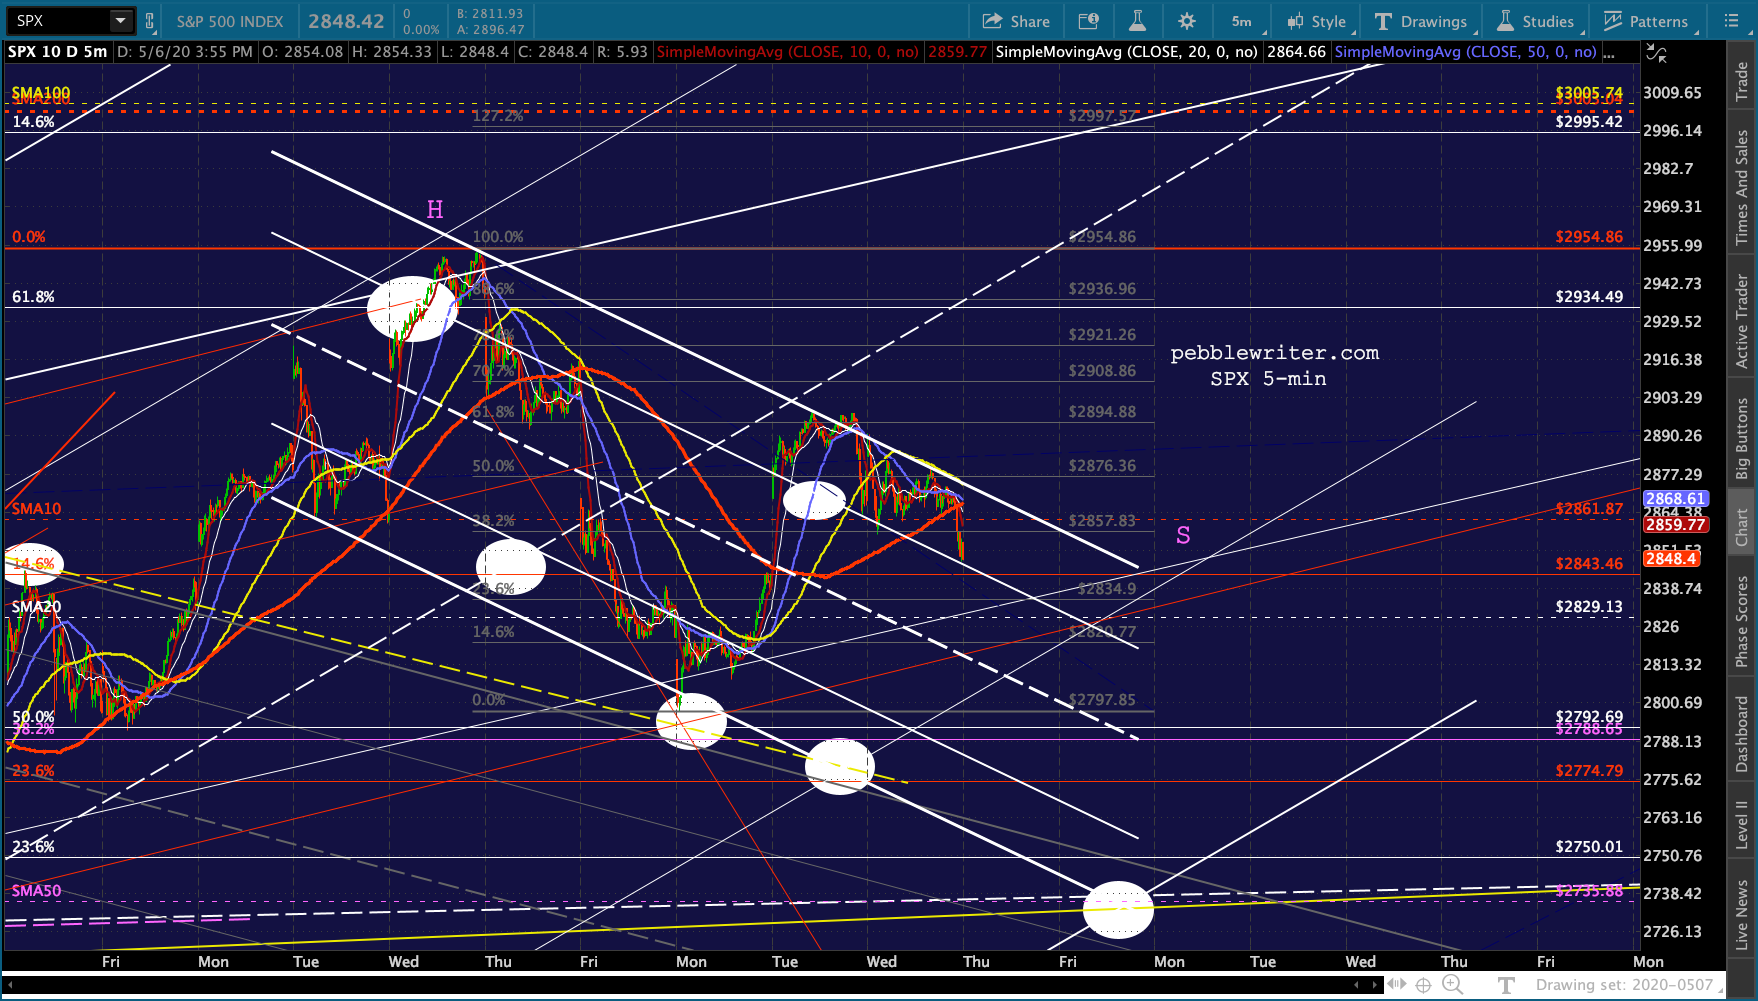 SPX has alread backtested the gray channel top/yellow TL and faces channel support around the SMA20 at 2829. Assuming the falling white channel holds, it would reach 2703 by Friday or Monday.
 VIX’s daily chart shows plenty of downside should the SMA100 give way, and plenty of upside should the rising white channel hold.
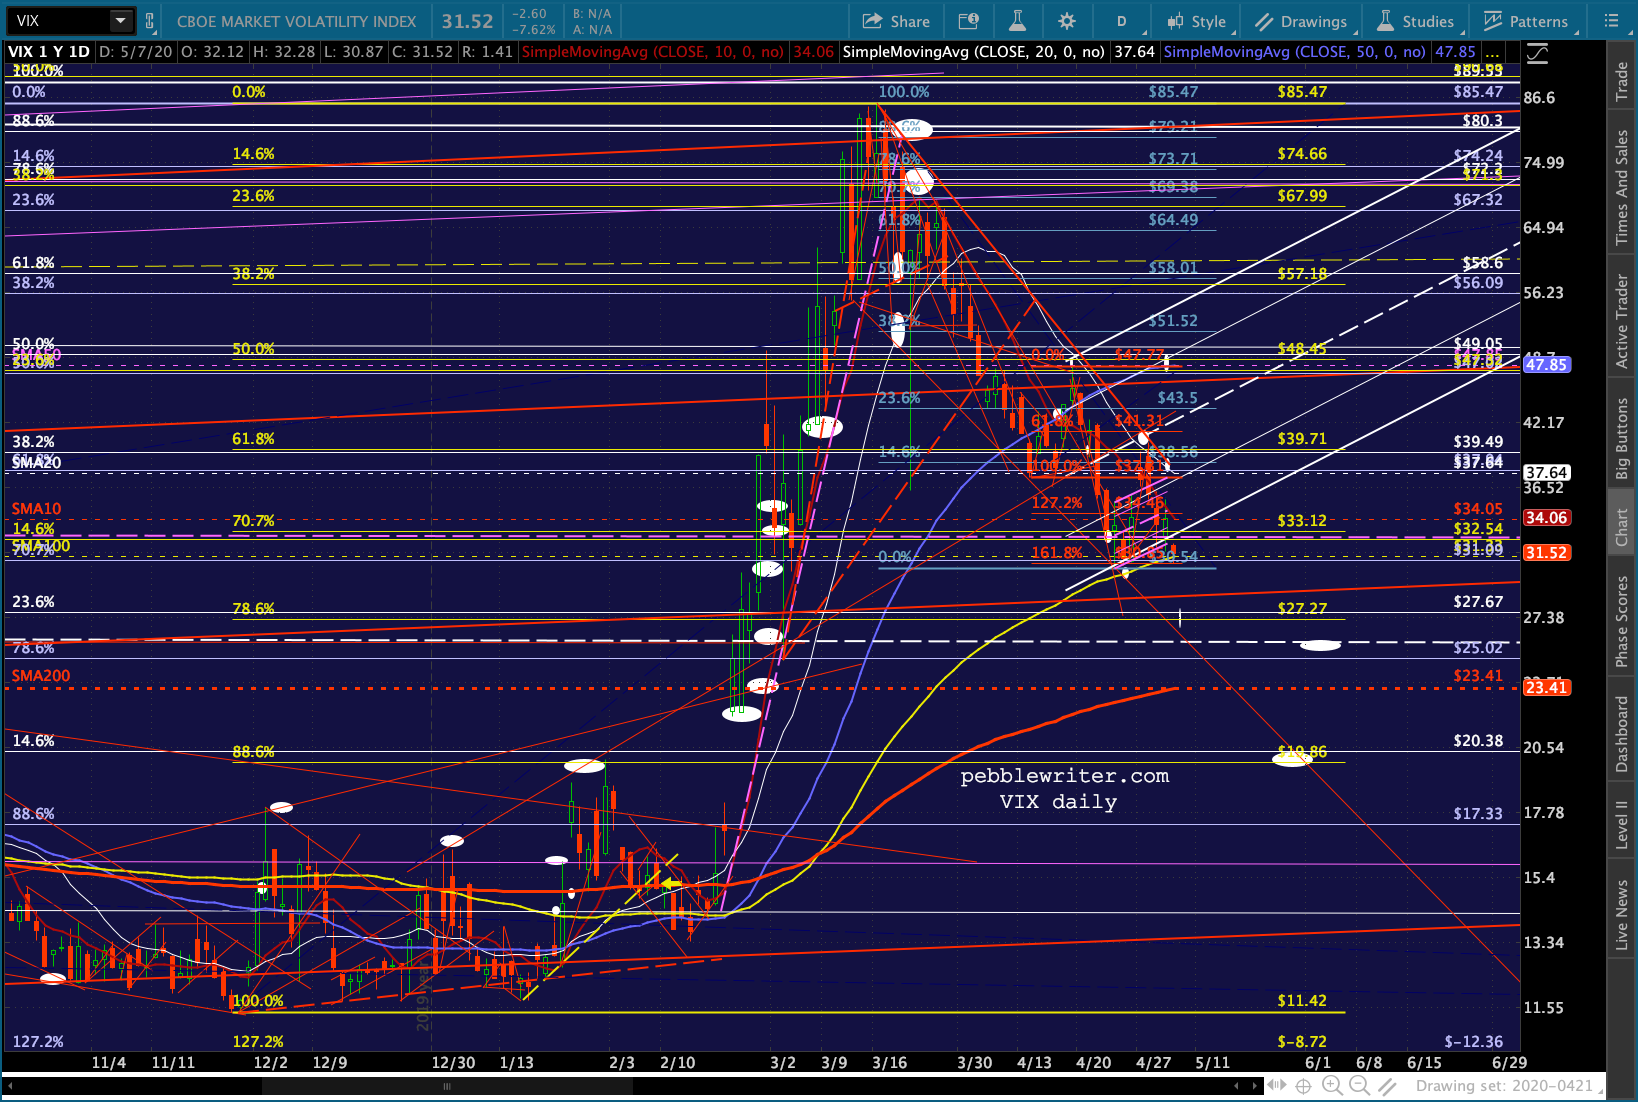 Note that DJIA is still toying around with its 2.24…
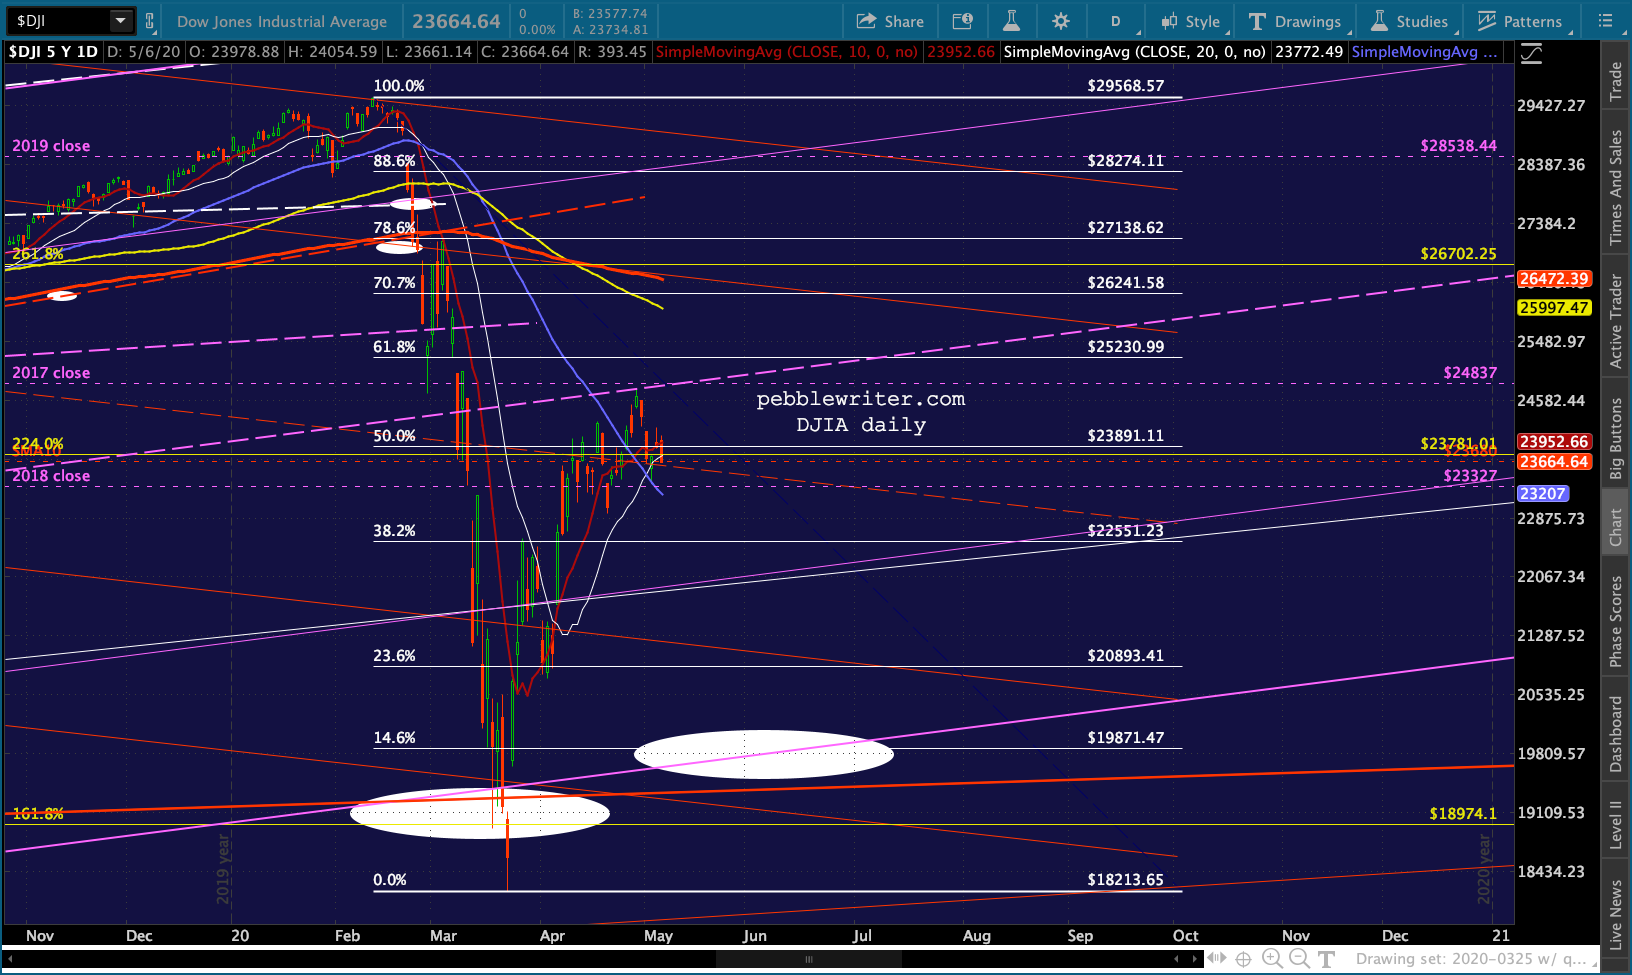 …and RUT is still below its yellow channel line.
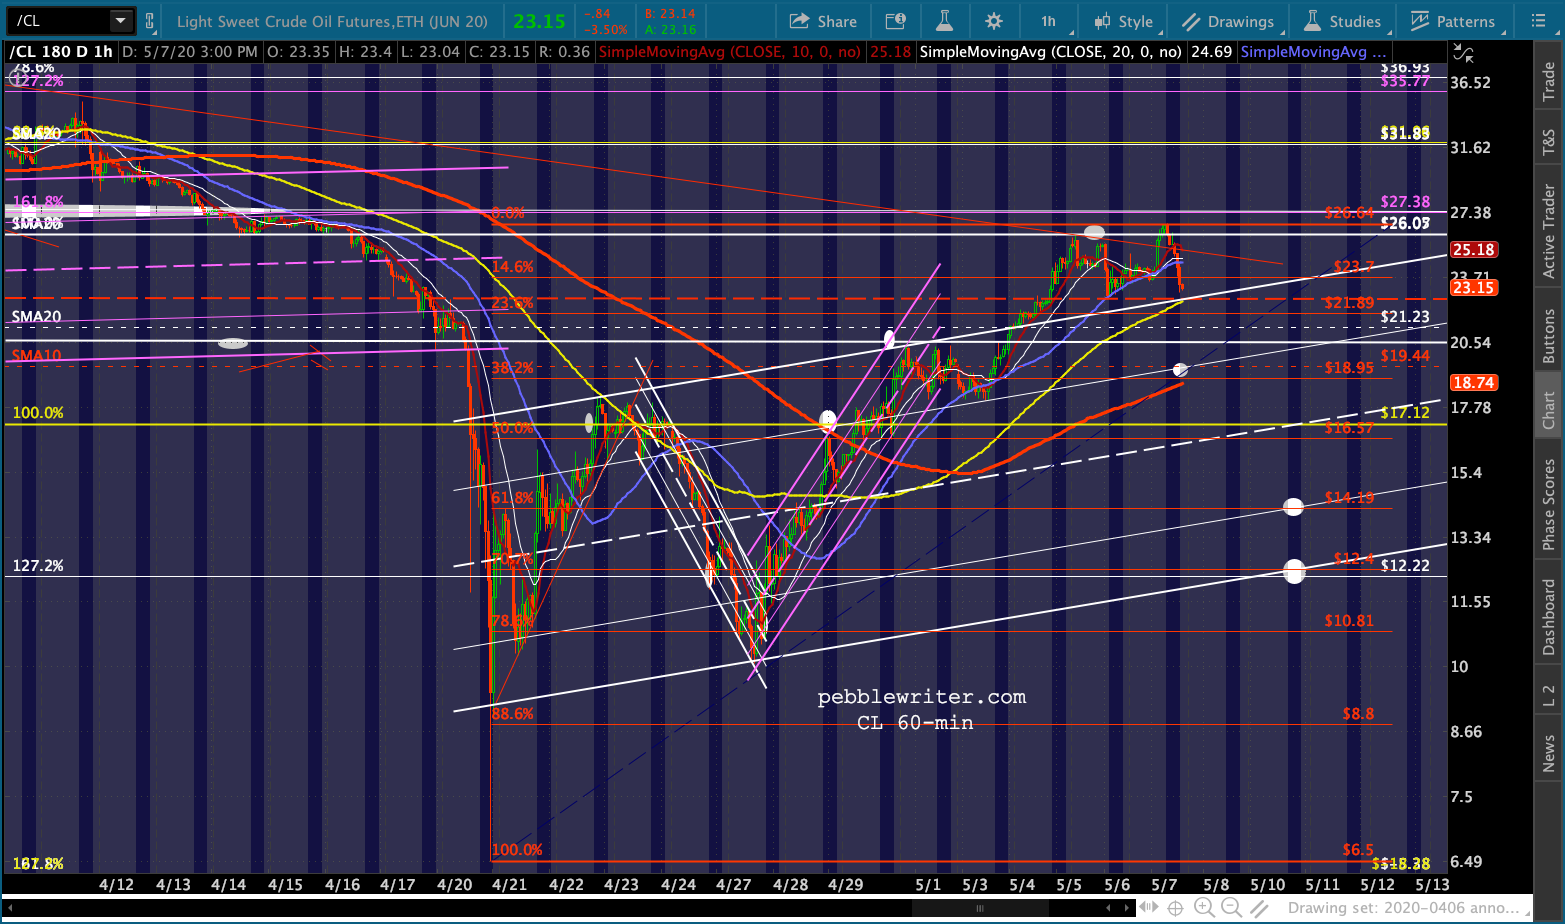
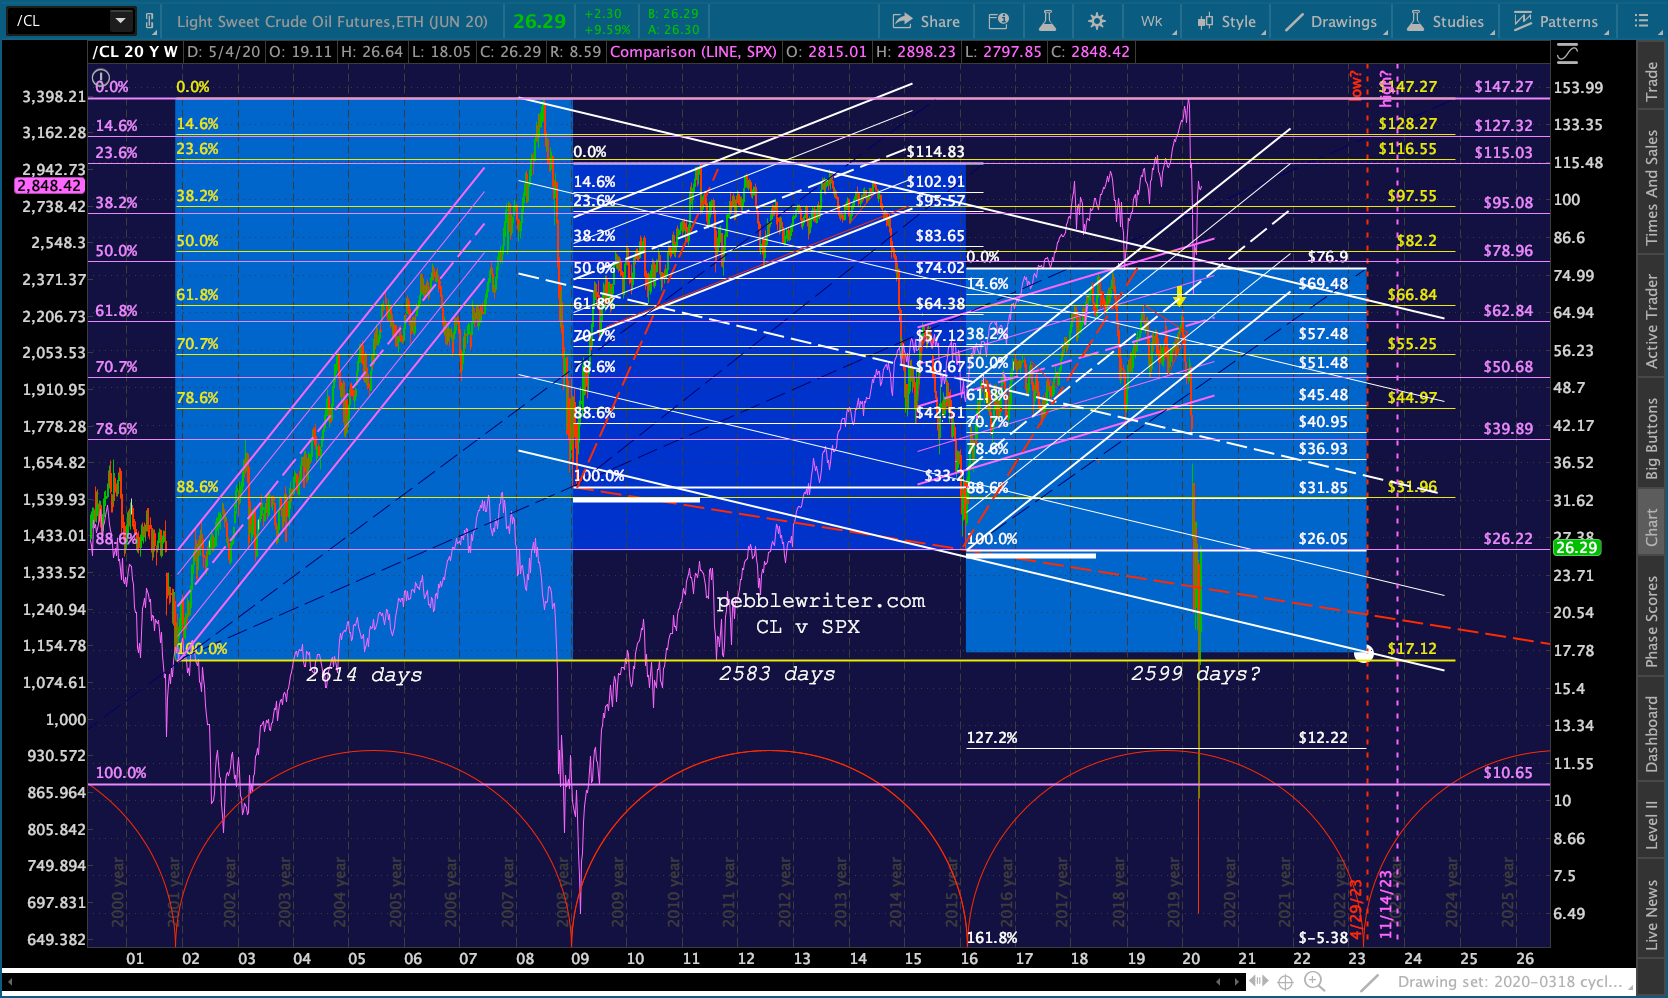
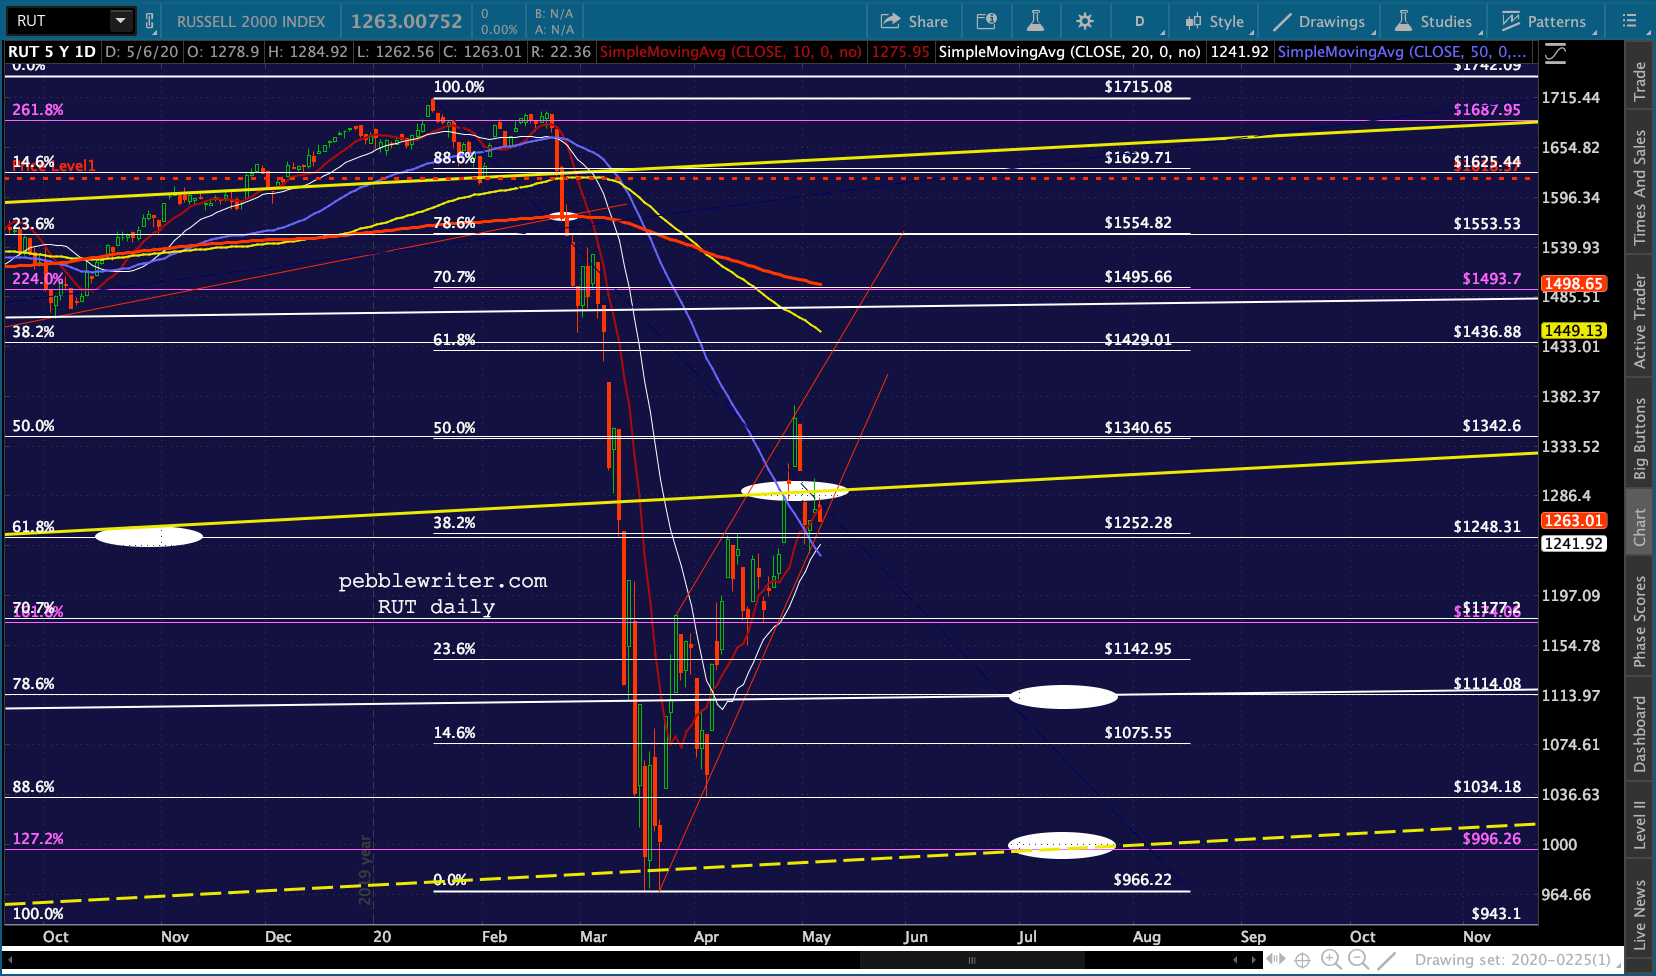 The bigger picture for oil shows that this morning’s pump is only slightly above the Feb 2016 lows.
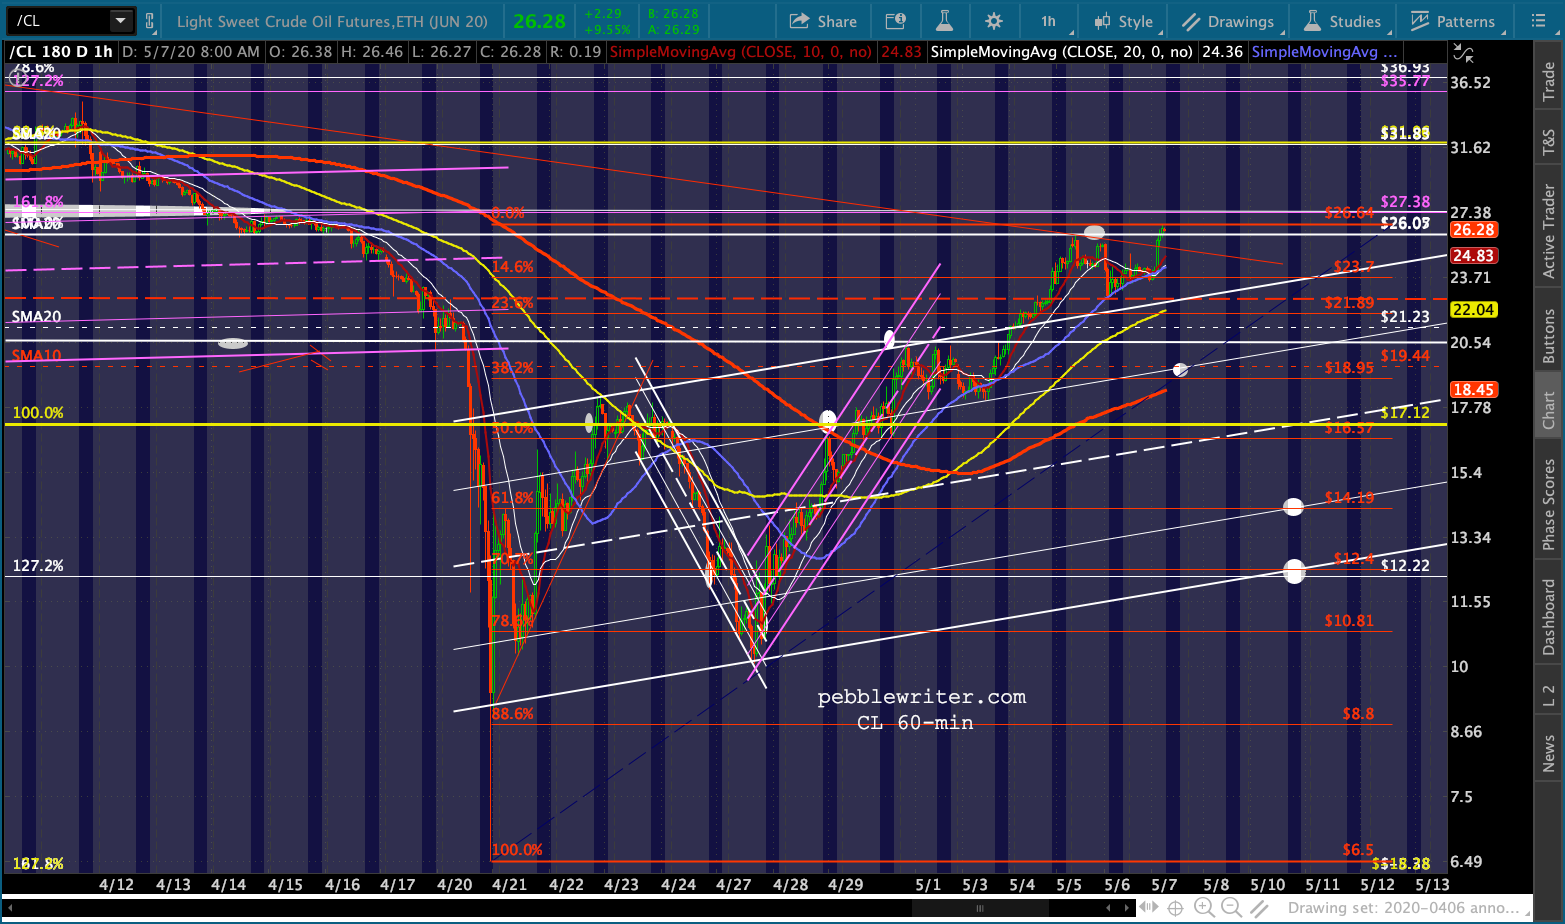
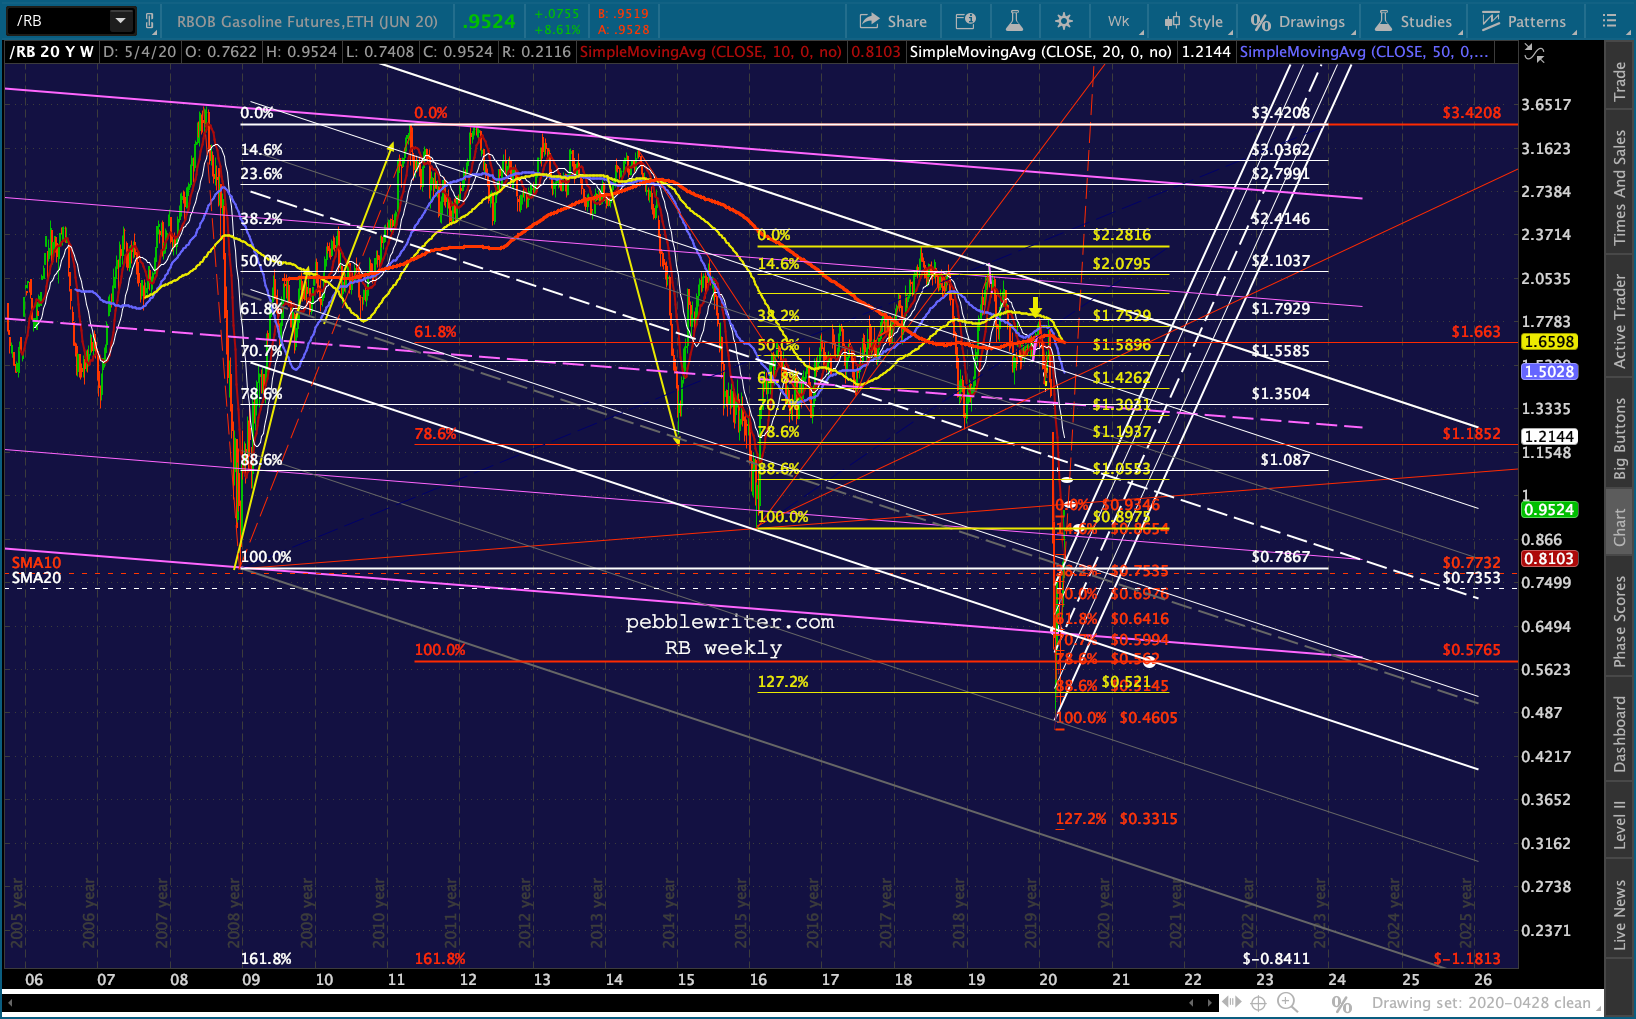
 RB is likewise pushing slightly above overhead resistance…
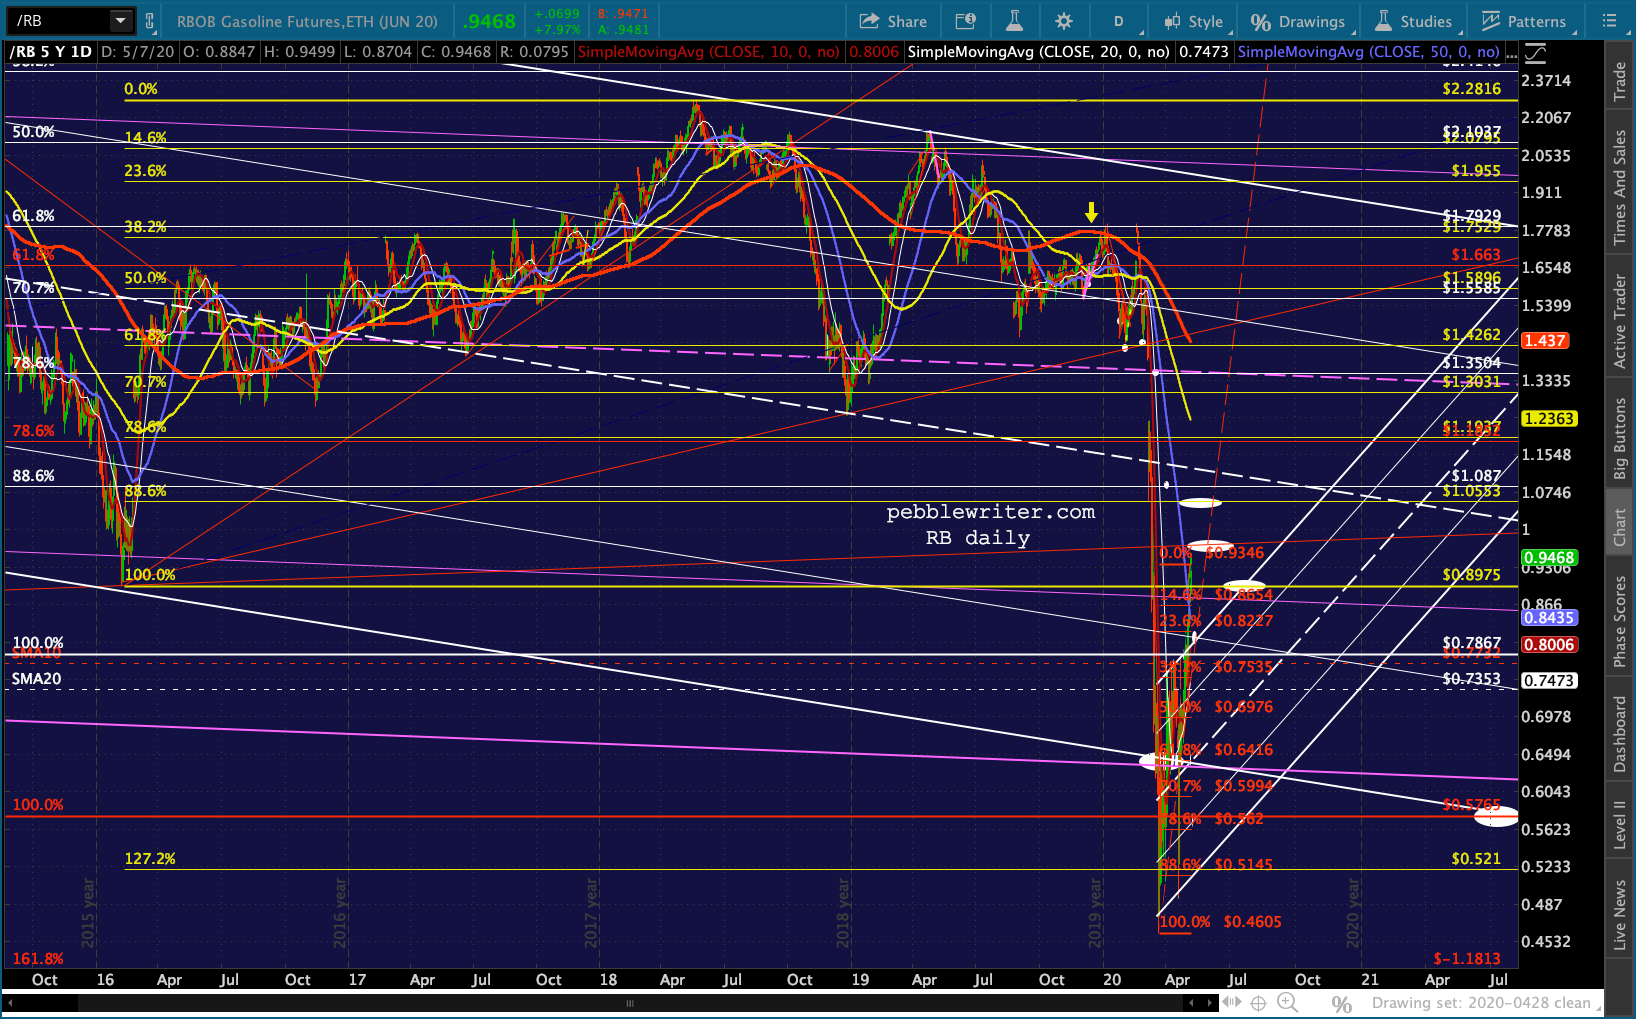 …in this case the trend line connecting the 2008 and 2016 lows.
 Currencies are mostly on the sidelines this morning, with a slight backtest by USDJPY contributing to futures’ strength and DXY’s potential breakout.
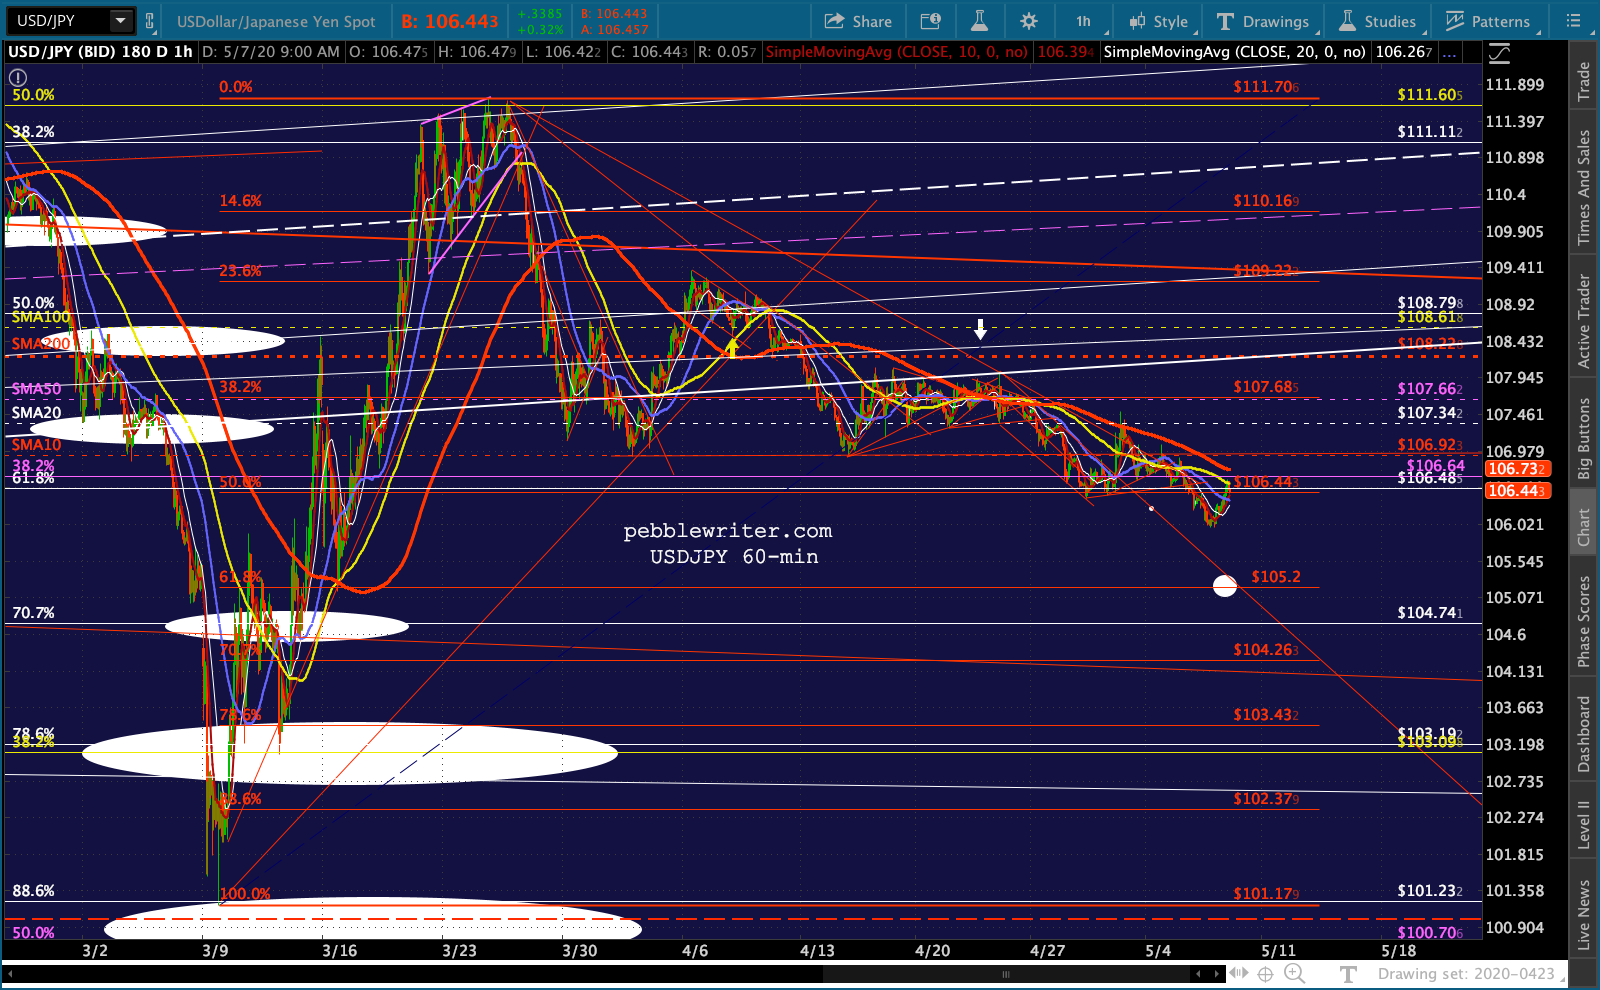

 On the bond front, the 2s10s is still broken out, but has backed off yesterday’s highs.
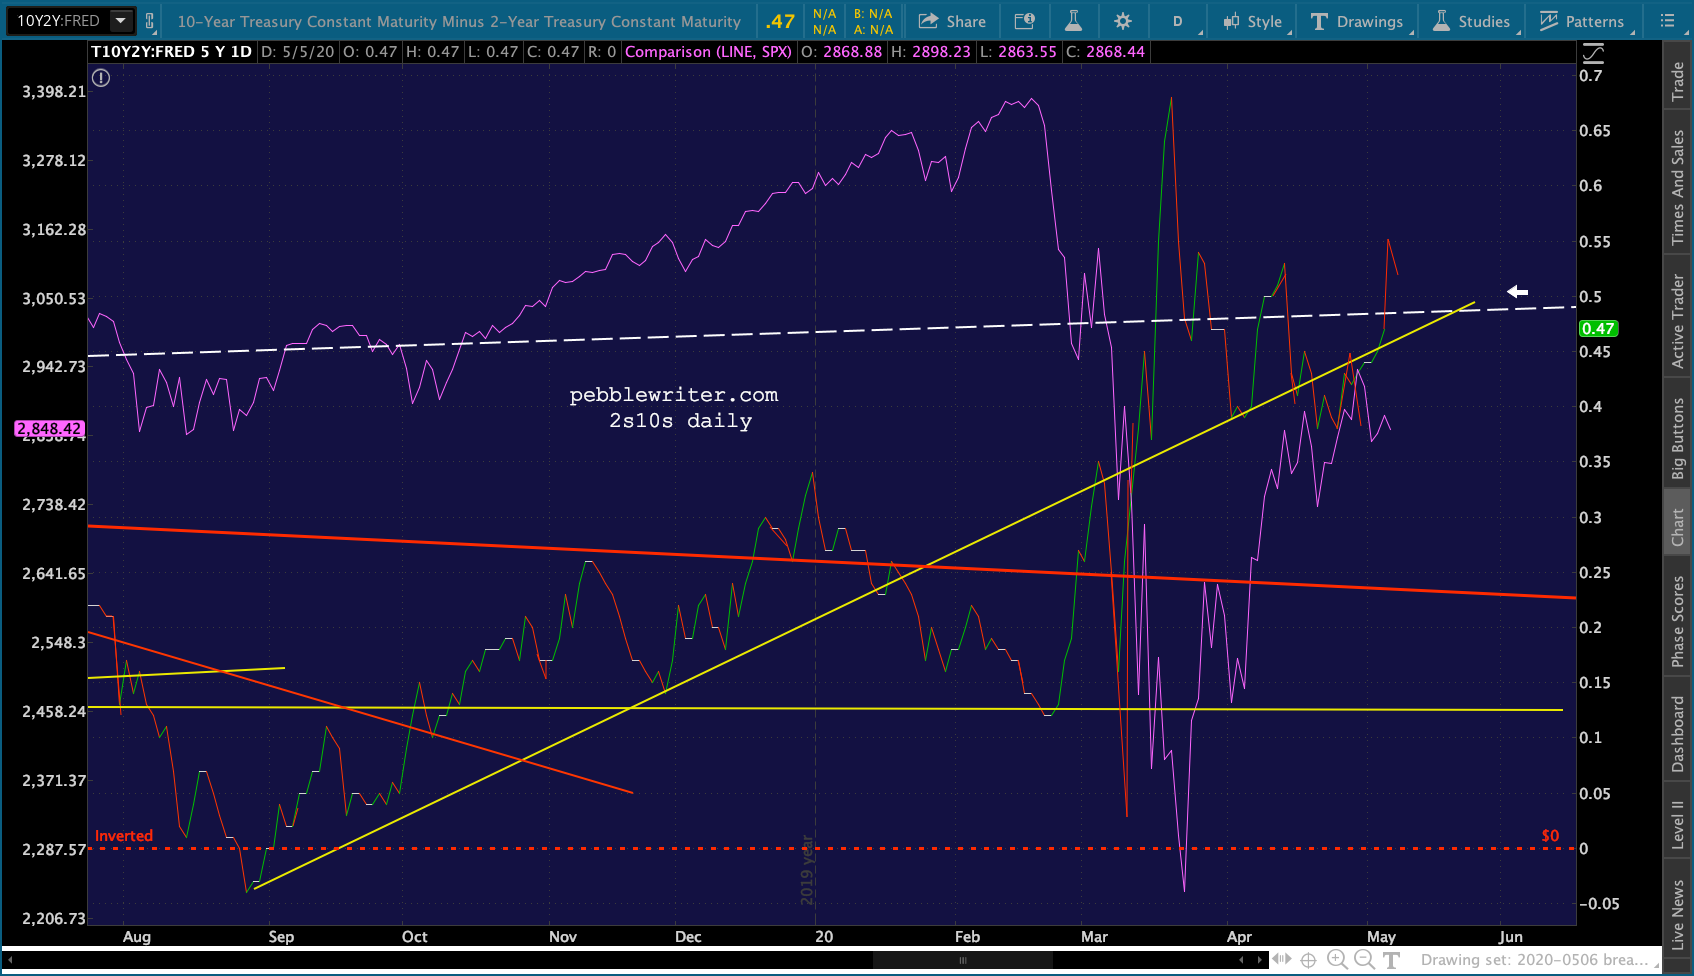
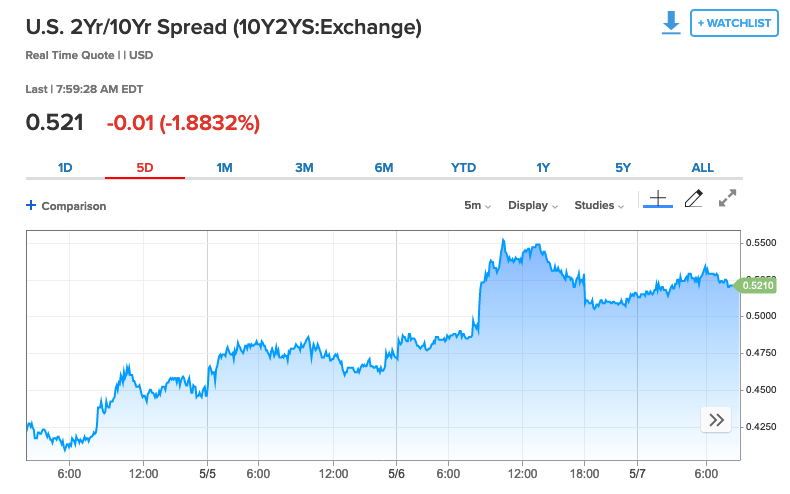 The 10Y has likewise backed off from yesterday’s highs…
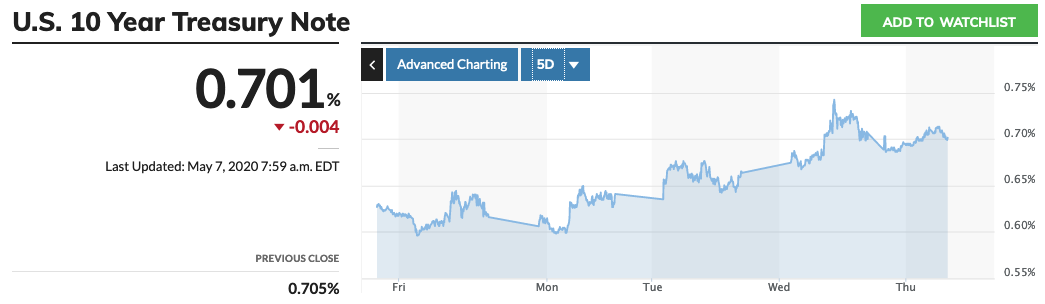 …but the 2Y remains in the same very narrow range, with < .17 representing the danger zone for stocks. With trillions now being borrowed primarily in t-bills, look for 2Y yields to be under strong pressure next week.
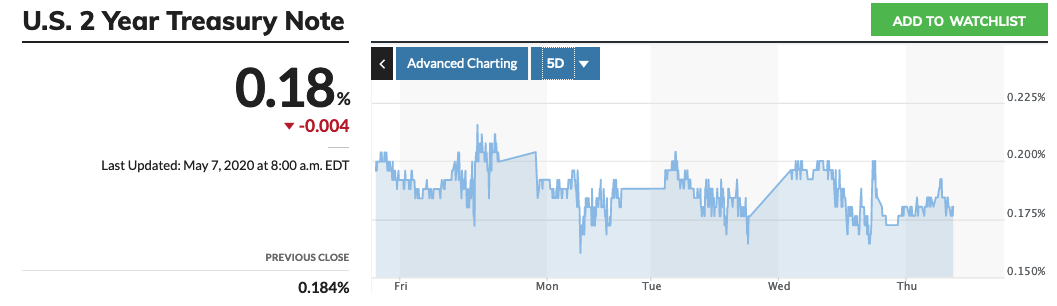 UPDATE: 3:50 PM
As we come into the close, it’s interesting that ES has given up its breakout status. It’s still up on the day, but it’s fading fast.