

EURUSD tagged our next downside target overnight: the .618 Fib at 1.1285. As we discussed in last month’s currency update [see: At The Brink] this breakdown below support has been instrumental in helping DXY achieve our long-expected breakout.
 continued for members…The currency picture for this morning… At this point, I’m looking for ES to continue building this little triangle to its 1.618. Any drop through the lower bound would probably depend on VIX not rising above its SMA10 at 16.89 – which it could do on a backtest.


 We can’t talk about currencies without discussing CL and RB. CL is backtesting its SMA50 for the first time in almost 2 months, with the roll over apparently continuing.

 We think this is likely to continue as the Fed needs inflation to subside or at least level off, and a decline in oil/gas is the fastest way to accomplish it.
Absent cooperation from OPEC+, the fastest and cheapest way to accomplish a drop in oil/gas is to boost the DXY. This could be done by allowing interest rates to increase, but TNX is already in real danger of a massive breakout. Note the huge IH&S Pattern targeting 32.
 It would represent a breakout of the channel going back to the Stone Age and would likely scare the crap out of the market.
 There’s no question that rates should be much higher. Actual inflation is much higher than 6%, and not just because of sky-high oil/gas prices. Just yesterday, food commodities (as represented by DBA) broke out of a very long-term channel and shorter term rising wedge.
 This is on top of WTI’s breakout in September.
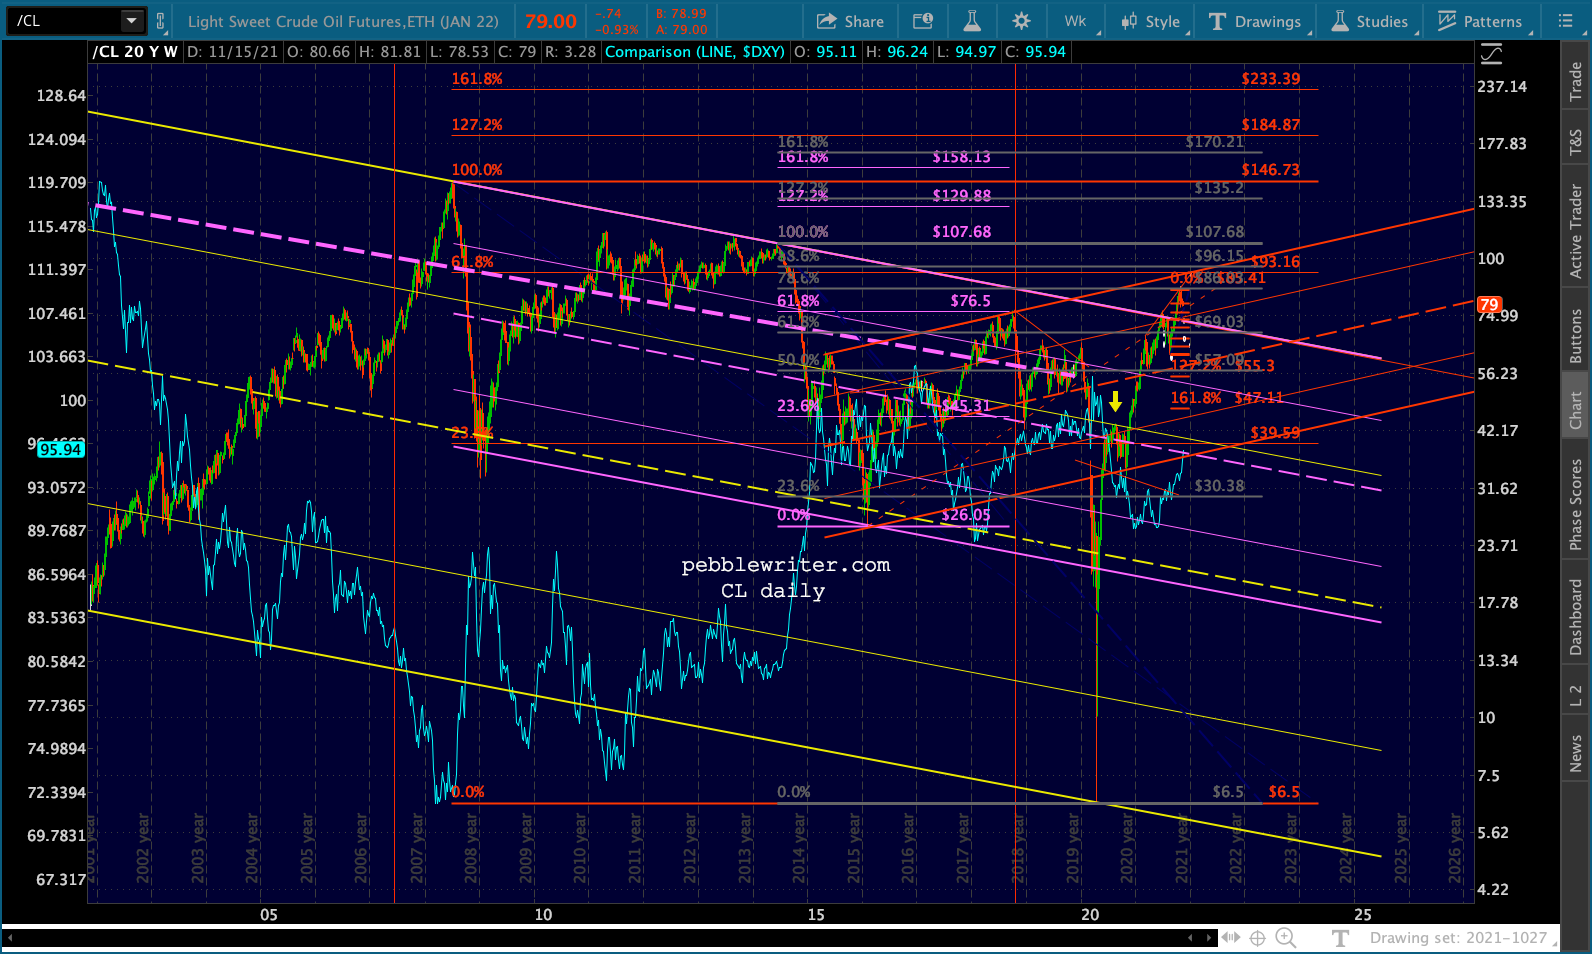 Even gold has come out of hibernation to threaten a massive IH&S Pattern which would put it back over 2000.
As we’ve discussed many times, these untransitory developments could be stuffed back in the box after November if the price of oil at least levels off and the base effect is allowed to bleed off. The question is how to survive until mid-January — when December data would ideally show a nominal decline in CPI?
 Absent a murdered journalist, a political stunt, or another COVID shutdown, the rising dollar is the most expedient way. It also lowers the price of imports other than oil – a perk when you’re a net importer with high inflation. We’ll approach the currency charts from the standpoint that central bankers (primarily the Fed) will do whatever it takes to keep inflation and interest rates from exploding higher.
EURUSD has just tagged the .618 Fib, usually an interim step on the way to a .786 or .886 retracement.
 This was a retracement that was very long in coming and represents a significant move within other, larger patterns that were sometimes a little sloppy. The falling purple channel from early 2018, for instance, broke down in March 2020 when stocks were plunging.
 It had already become commonplace for stocks to plunge following each major breakdown and backtest by EURUSD.
I’ve marked some key breakdowns and backtests in EURUSD below… …with corresponding key reversals in ES.
 In general, a EURUSD channel breakdown was a warning of a big decline ahead and the EURUSD channel backtest was the start of the decline.
Note that the very extended rise to point 3 on EURUSD – a backtest of the rising purple channel – corresponded with the push by ES above its significant 2.24 Fib at 2728. This “breakout” subsequently collapsed when – one which subsequently collapsed after EURUSD’s reversal from point 3.
But, it was the more significant breakdown at point 4 and backtest at point 5 that touched off the 21% decline in Sep-Dec 2018 (along, not so coincidentally, with a collapse in oil prices.) Points 4 and 5 were also involved in completing a large H&S Pattern (marked by the dashed yellow neckline) which ultimately paid off 17 months later.
The decline following the H&S completion was mild and carefully controlled, with occasional backtests of the SMA200 along the way. ES’ push above its 2.618 Fib at 3076 was ultimately facilitated by EURUSD’s rising white channel from Oct 2019-Jan 2020. When that channel broke down, however, it started something much bigger.
This time, EURUSD’s backtest was enormous – pushing back up into the broken channel until it backtested the yellow neckline and purple channel midline on Mar 9 (the yellow arrow)…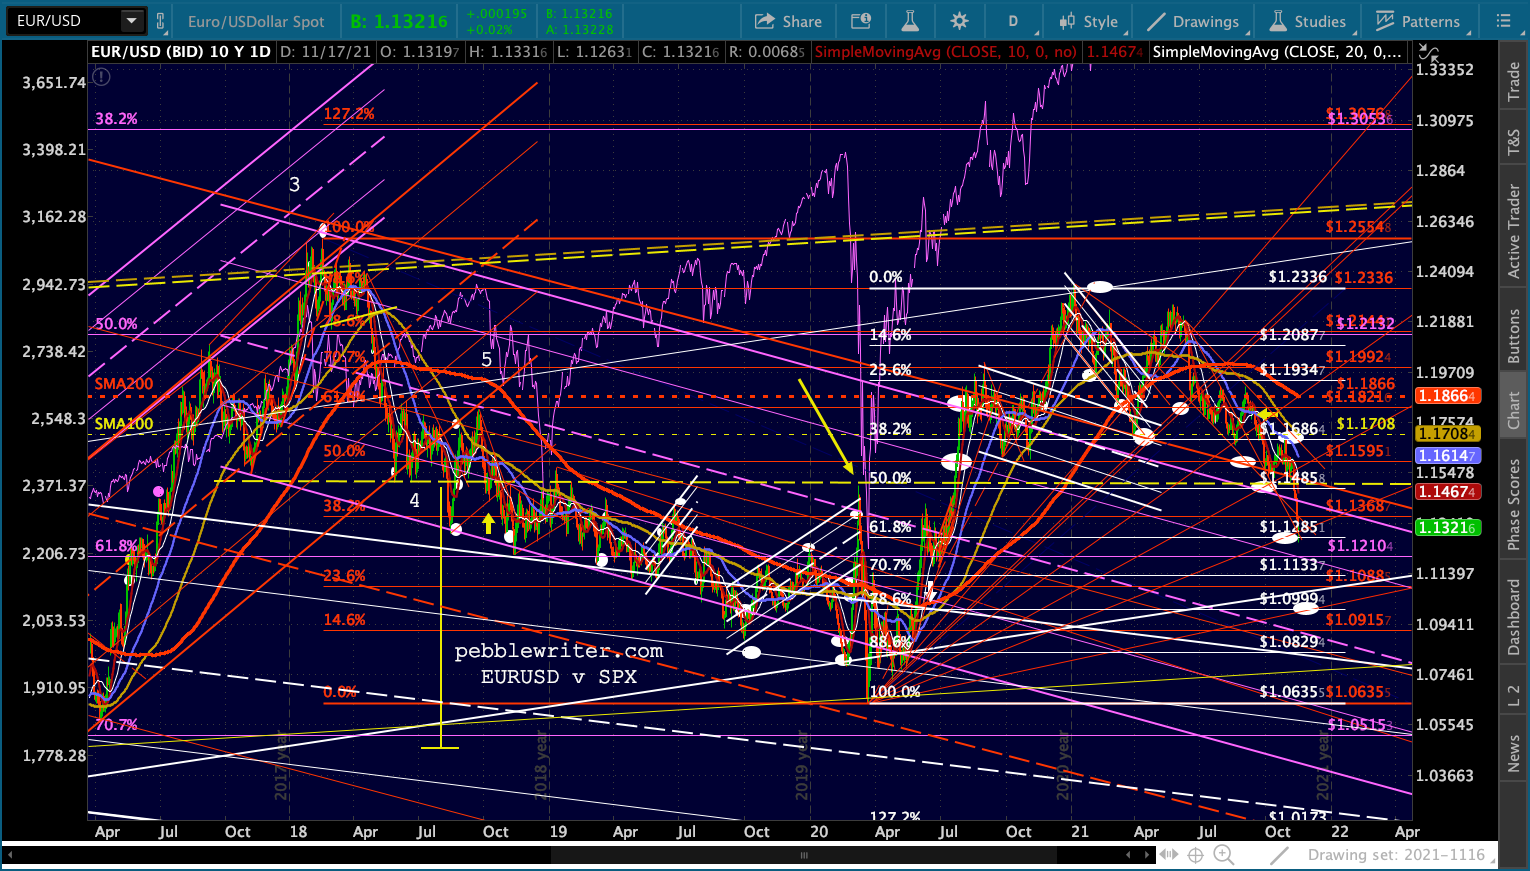 …after which ES’ 12% decline turned into a 35% crash.
 That’s probably enough history. If extended rises in EURUSD (declines in the dollar) do a good job of extending stocks’ rallies and breakdowns/backtests are treacherous, where are we now?
Let’s start with channels. The euro only came into being on Jan 1, 1999, so the portion of the chart before the vertical red line is a bit of a fabrication. Nevertheless, we can see that at least the bottom of the huge rising white channel has provided great support over the years. The rest of it has been less reliable, but I’m comfortable with its placement because of the nice midline tags and the June 2008 tag on its top. Starting in July 2008, the falling red channel spooled up, providing excellent turning points on multiple occasions until Apr 2015. EURUSD bounced there, then made a lower low which didn’t quite reach its bottom (but did reach the rising white channel bottom) but subsequently reach the red channel top in Feb 2018.
The cheat was in Aug 2020, when EURUSD broke out of the falling red channel in the process of retracing 88% of the 2018-2020 decline. Since then, it’s played cat and mouse with a slew of backtests, ultimately breaking down when its last backtest a few days ago failed.
Note that the falling purple channel is essentially a subset of the falling red channel, parallel to it but with a lower top and higher bottom. The portion of the chart where EURUSD lingers below 1.08ish in Mar-May 2020 was basically a breakdown of pretty much everything.
 Breaking back into the falling red and purple channels after breaking out of them is a very bearish development. Although a bounce at this key Fib is likely, it is also likely to yield a lower low at the .786 (1.0999) in the near future. This would correspond with the white channel bottom as well as the red .886 fan line and would come in the very near future.
If that were to fail, then we’re looking at the white. .886 at 1.0829, potentially right away or in January 2022. This would technically be another breakdown of the huge rising white channel bottom, so it could portend a very messy equity market.
If the lows were taken out, then the white channel is kaput anyway and the rising yellow channel is in charge, suggesting a downside target in the .91-.96 range.
There is an even worse case scenario: the huge yellow H&S Pattern between 2003-2015 targeting .86. This pattern has already completed and already backtested its neckline (Feb 2018), so it’s perfectly legit. Could equities hold up in the face of such a huge (24%) decline? Doubtful – which is why I’m skeptical of such a breakdown. I write about USDJPY so much that much of this will be duplicative. Bottom line, it is at the service of the equity caretakers both in Japan and in the States. It recently broke out of a falling purple channel, broke through a TL of overhead resistance, made slight new highs, and targets 117.50 around the end of the year.
 In the process, it will reach the midline of a rising white channel and the top of a falling white channel shown below.
 At that point, it will have completed a triangle pattern – typically a consolidation pattern with upside potential. A breakout of the falling white channel…
 …would open up the rising white channel and higher retracements on the yellow Fib pattern such as the .618 at 120.11, the .786 at 132.22 and the .886 at 139.43. The rising purple channel would easily accommodate each of these.
 If we zoom out, we can see that the falling white channel isn’t much of a channel since the 2nd low – which should have occurred around 2011 but was cut short by the need to fix markets following the Fukushima disaster.
 The falling red TL, however, is perfectly legit. Remember, USDJPY just broke through it. I would allow a little wiggle room for placement as it’s been in the works for such a long time. But, this breakout is potentially highly consequential.
If it doesn’t keep going and break out of the falling white channel, then USDJPY is long overdue for a SMA200 backtest. The closest, most likely mark at this time is at 113.82 in early January.
DXY has had a nice move so far, either completing or about 3/4 of the way to completing the red flag pattern after breaking down from the rising purple channel in Jul 2020.
 If we zoom out a little, it’s easier to see the logic behind the backtest.The rising purple channel broke down, leaving the rising white channel in charge. DXY tested its midline twice and is presumably bouncing up to the purple channel bottom at the white .618 (97.727) and red .382 (97.362) or the rising white channel .786 line which aligns with the white .786 (100.042) or red .236 (99.514.) I favor the 97.362-97.727 target range.
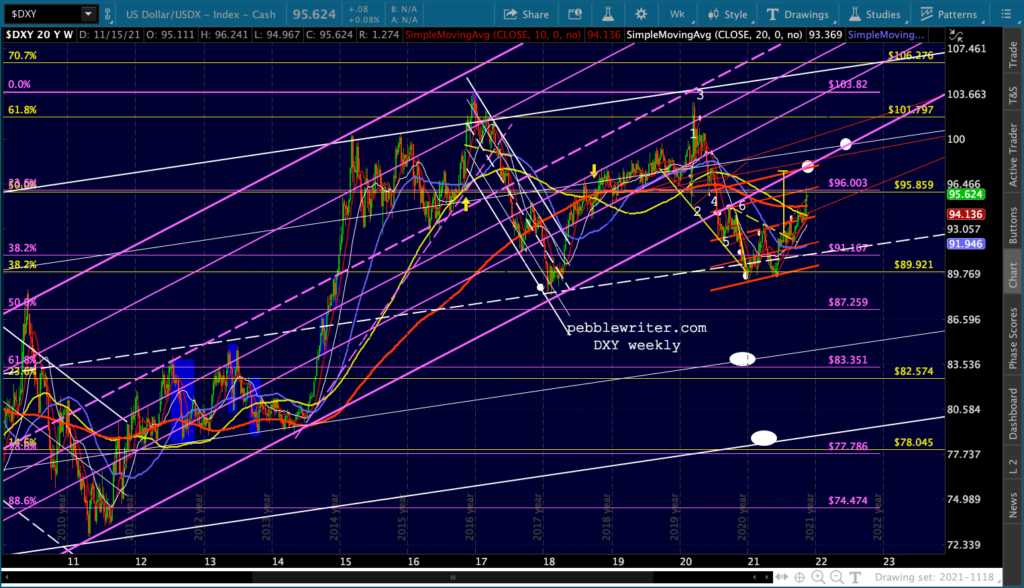 Assuming we get one or the other backtest, the next leg should be lower to test either the white channel bottom or .236 line. But, let’s cross that bridge after we deal with the backtest.
 A further DXY rally would obviously depend on additional declines in EURUSD or rallies in USDJPY – both of which make sense if the Fed really is going to (or at least people expect them to) raise interest rates.
GLTA.