

I didn’t set out to be an FX analyst. About the only time I ever focused on currencies was when planning a trip abroad, which seemed to always line up with USD lows. Eight dollars for a croissant? Really?
Ten years ago, however, I began to notice how closely aligned equity performance was with moves in the USDJPY and EURUSD. That curiosity blossomed into a robust appreciation of the fact that many currency moves have become tools for central bankers to support equity markets.
On April 23 [see: A New Catalyst] despite the fact that USDJPY had been locked in a falling channel since November 2016 and was seemingly breaking down, I added the breakout target shown below due to what I reasoned was stocks’ vulnerability at the time.
 This morning, USDJPY reached that very target for precisely that same reason.
 Likewise, EURUSD was seemingly breaking out of a downtrend. I expected the breakout to ultimately fail and for EURUSD to very gradually backtest the channel from which it had broken out. This would be the least disruptive outcome for stocks.
 A few days ago, EURUSD completed that backtest – after several more headfakes along the way of course.
 My point isn’t that I’m any smarter than other FX analysts. It’s simply that we can usually count on central bankers to manipulate whatever is handy (interest rates, currency exchange rates, vol, etc.) to prop up stocks.
This morning’s move was fairly predictable only because it was apparent that the BoJ (the reigning world’s best market manipulators) wouldn’t be satisfied with NKD’s backtest and reversal at its 200-day moving average. Thanks to USDJPY’s strong overnight move, the Nikkei had no trouble spiking through that particular overhead “resistance.”
 At no time does the manipulation get more frenzied than around options expiration day. Today is one of those days and, as usual, stocks have gone hog wild in an effort to cause as many of the puts purchased over the past month as possible to expire worthless.
The falling channel which has faithfully guided stocks lower since our correction call in early September has seemingly been busted.  Of course, that was also the case on September 16 after ES had popped through the yellow trend line and was apparently breaking out of the falling white channel going into the close.
 The ruse continued into options expiration on Sep 17, at which point the bottom fell out and stocks suffered their worst two day plunge in months.
 Why does it matter, you ask? Because we’re in a very similar situation all over again. Based on the market action yesterday and today, you’d be crazy to short stocks. Which is exactly what the market makers want you to think.
continued for members…
I’ve experimented with a variety of Fib extensions over the past few days. But, the one from 4549.50 on Sep 3 to the 4260 lows on Sep 30 extends to 4172.25 (C=A) which is about where ES’ SMA200 will be on Monday.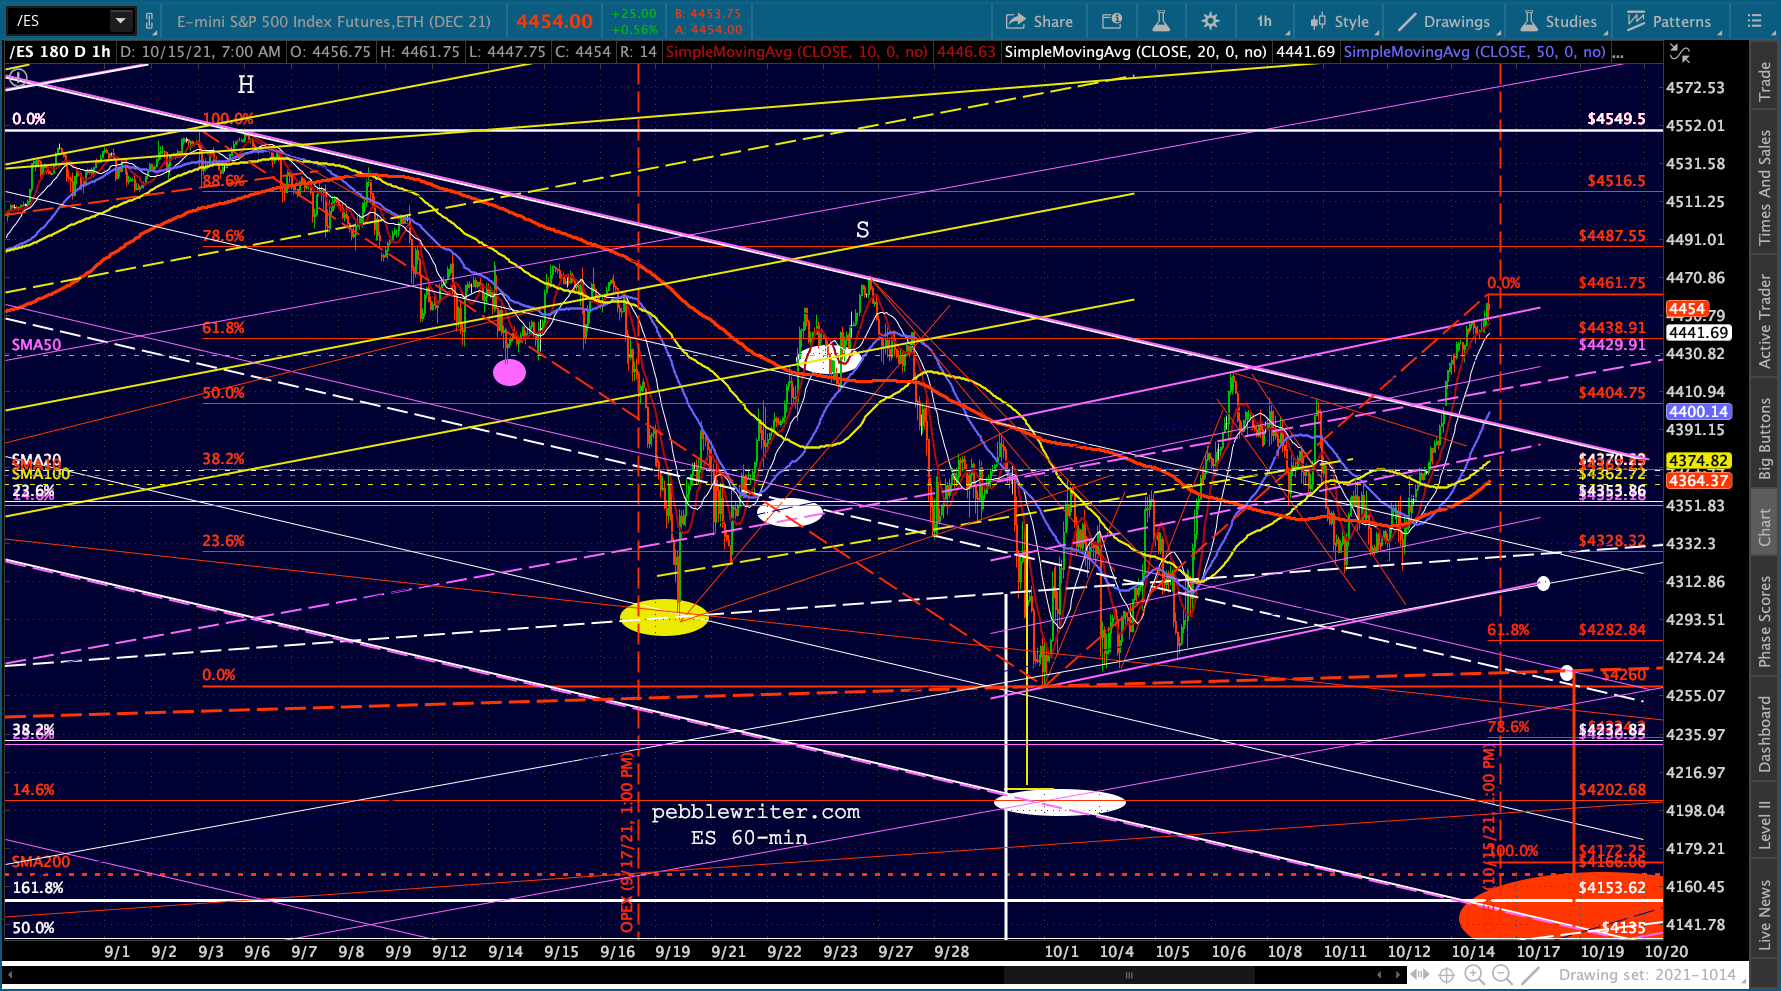 The model doesn’t work quite as well with SPX as its C=A extension would be around 4203, 29 points above its current SMA200.
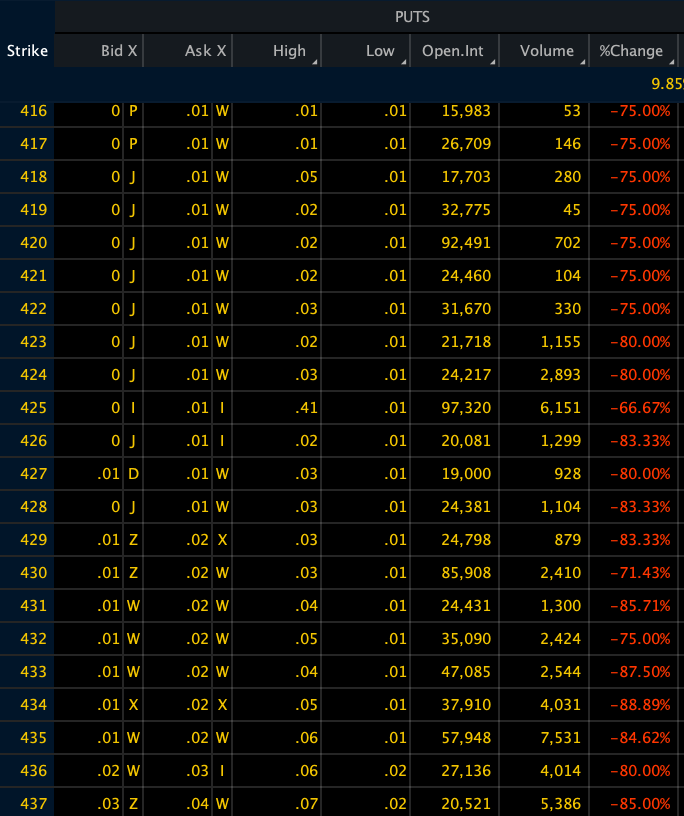
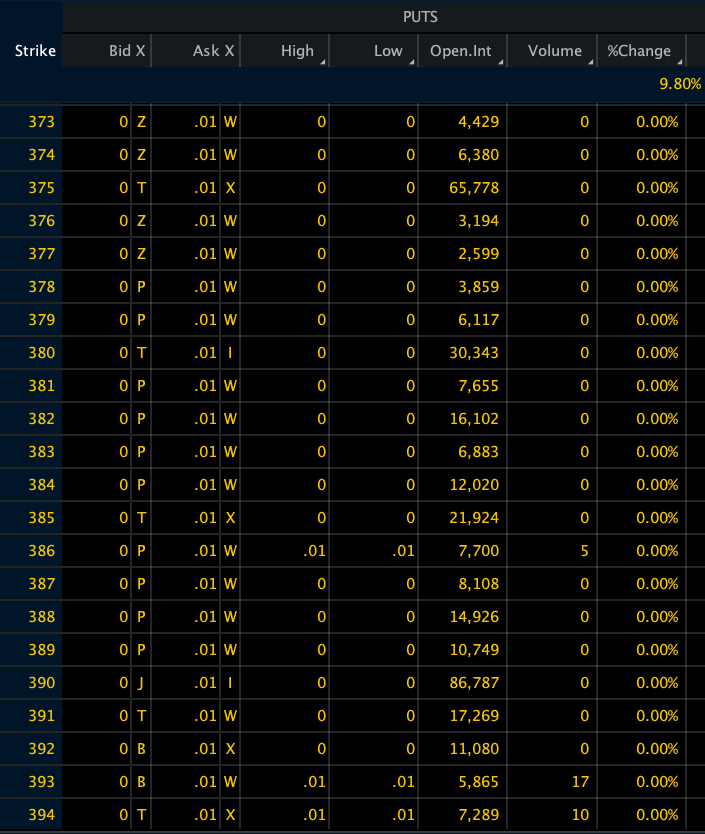
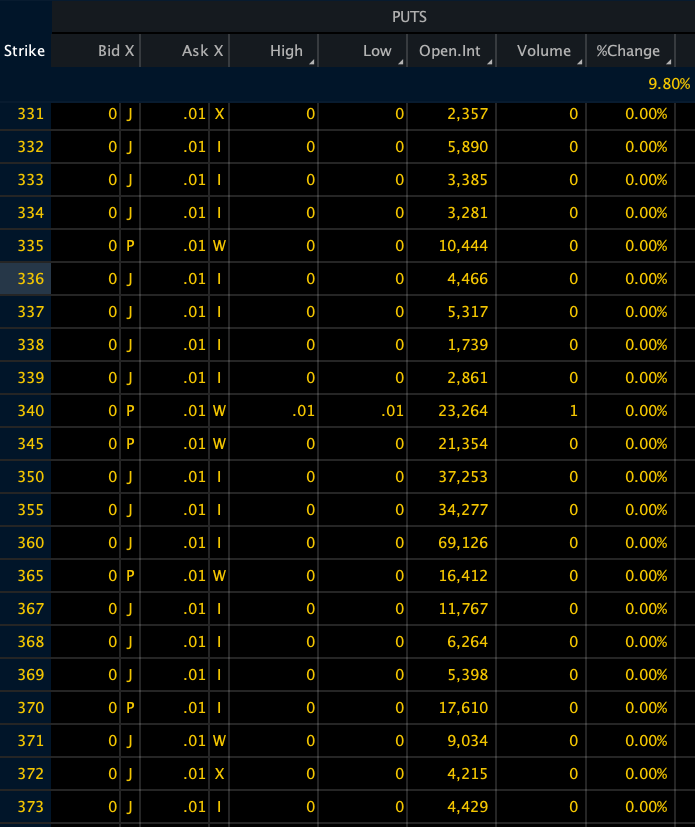
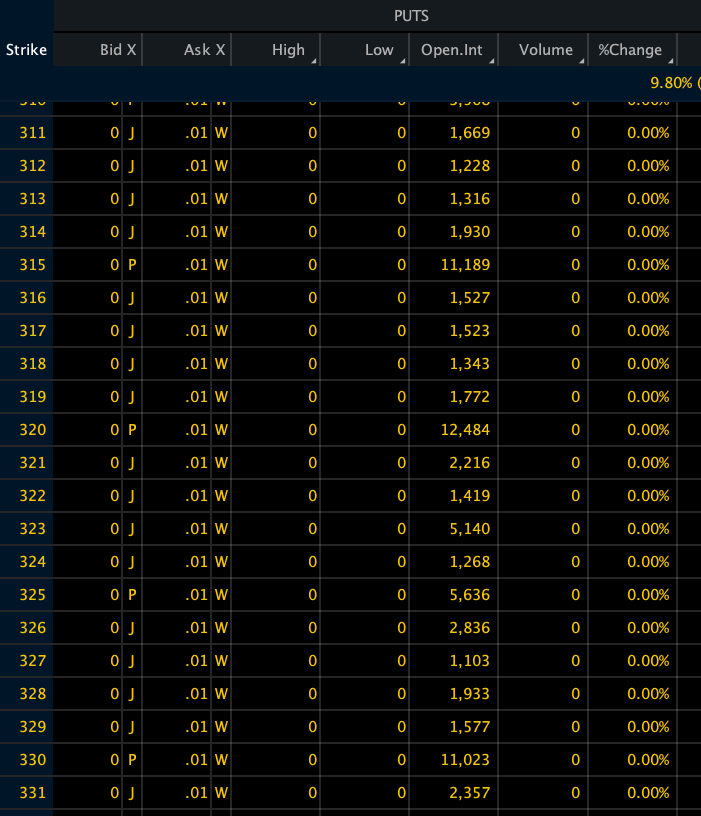
 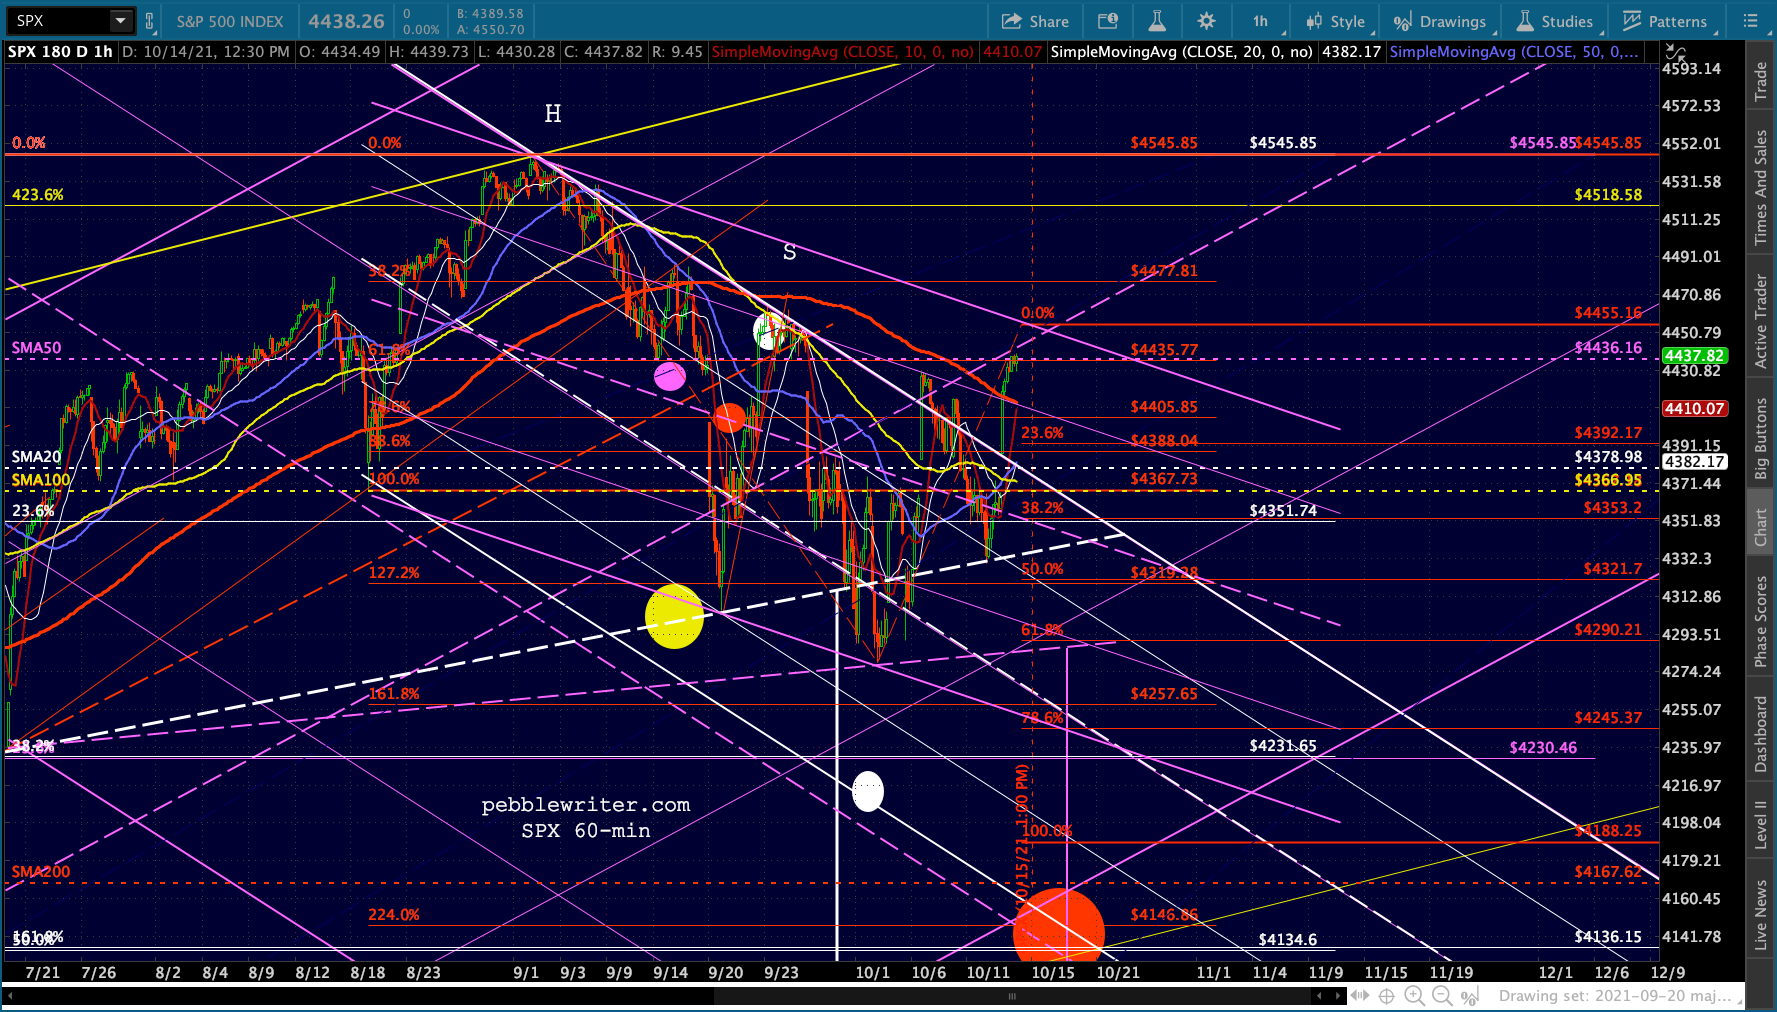 Consider how many put buyers have been wiped out just today. Check the “open interest” column in the SPY puts expiring today — all now well out of the money and essentially worthless. The first group alone, with strike prices between the top of ES’ falling white channel and its SMA200 – traders who were justifiably bearish after ES plunged below its SMA50 for the first time in months – amounts to nearly 1mm contracts.

 Those same newly minted bears would be equally justified in giving up hope for a downside move now that ES/SPX are back above their SMA50s.
What would it take for ES/SPX to give up so much ground so quickly?
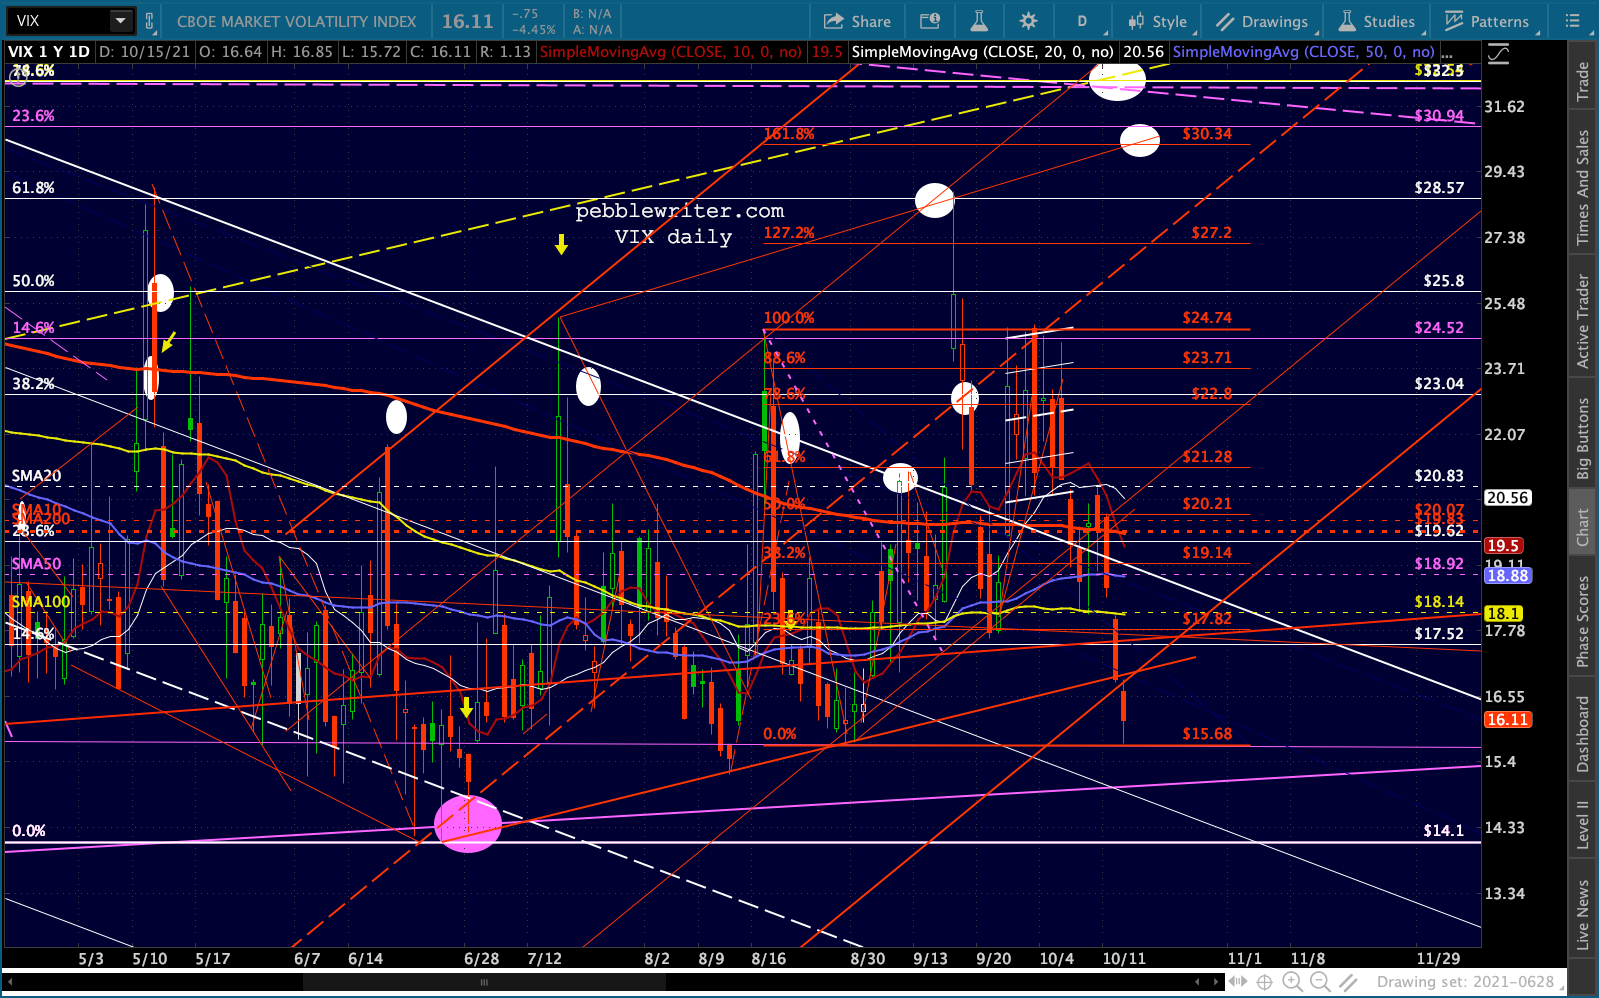
First, VIX would have to reverse a pretty convincing breakdown of the TL from Jun 29.
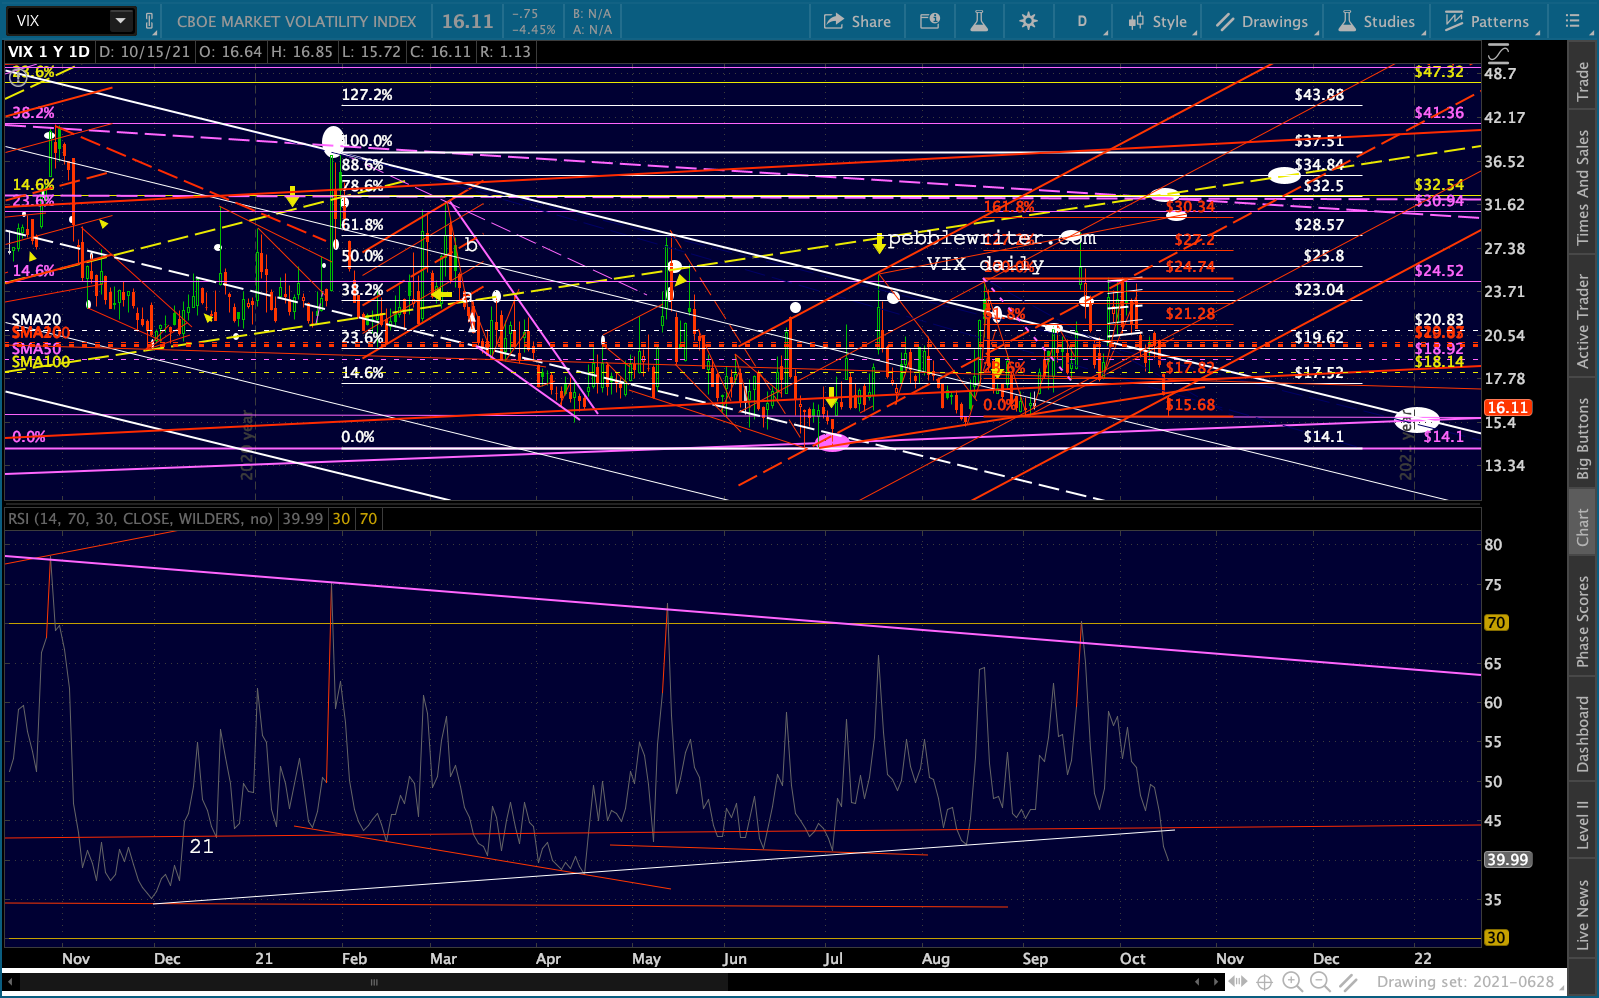
 Even the RSI supports the idea of VIX continuing lower.
 Next, USDJPY would have to bust through today’s high and run up to the falling white channel top at 117.50ish.
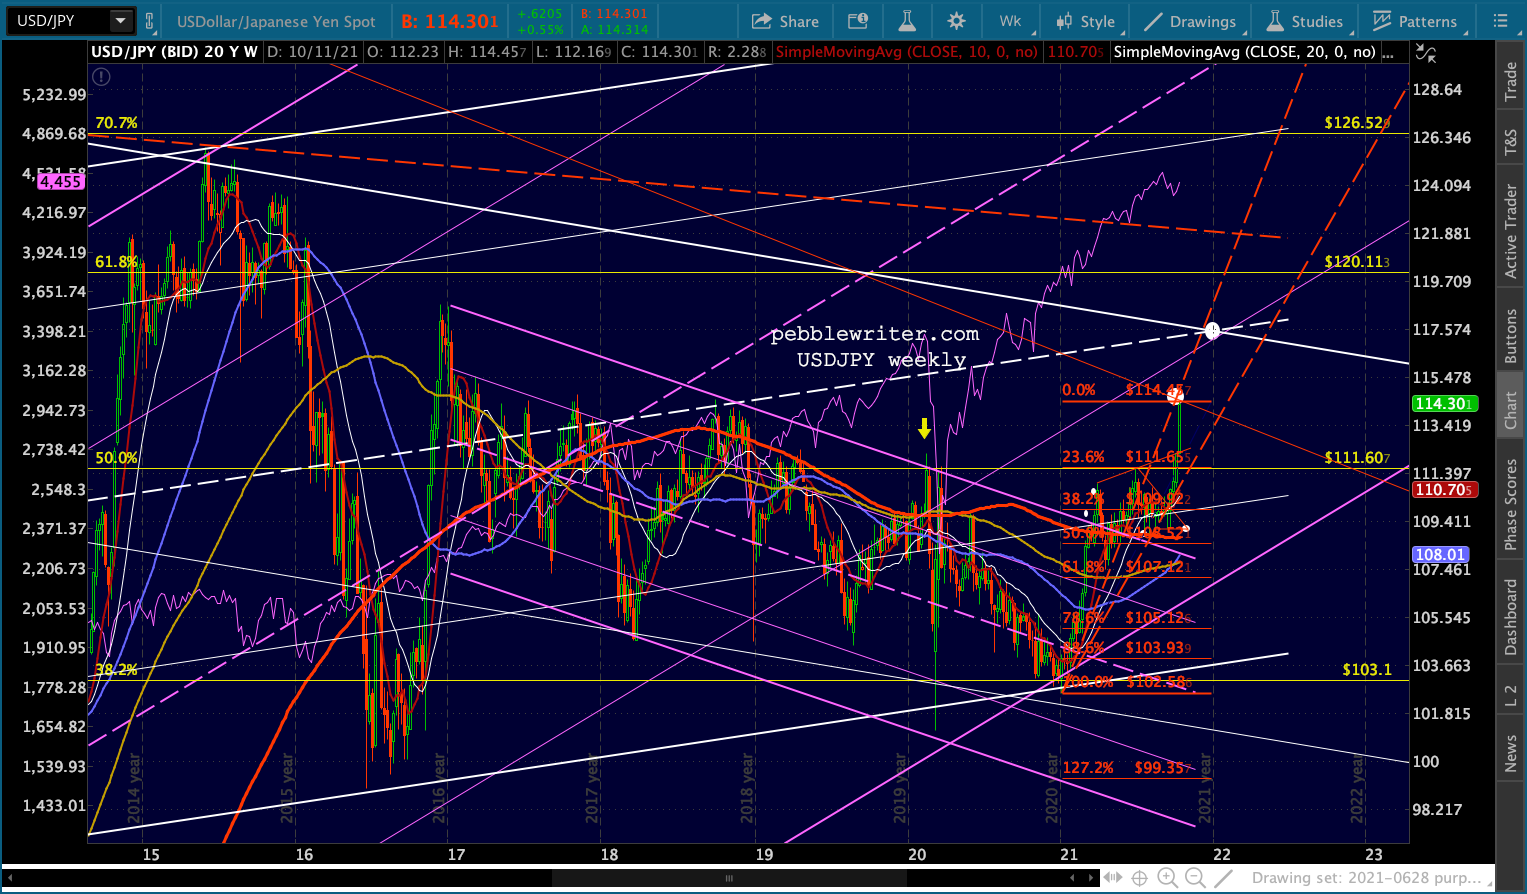 It would help enormously if EURUSD was to break down below the channel backtest, tagging the .618 at 1.1285. This would certainly fit nicely with the DXY breakout that’s been on our radar for the past year or so.
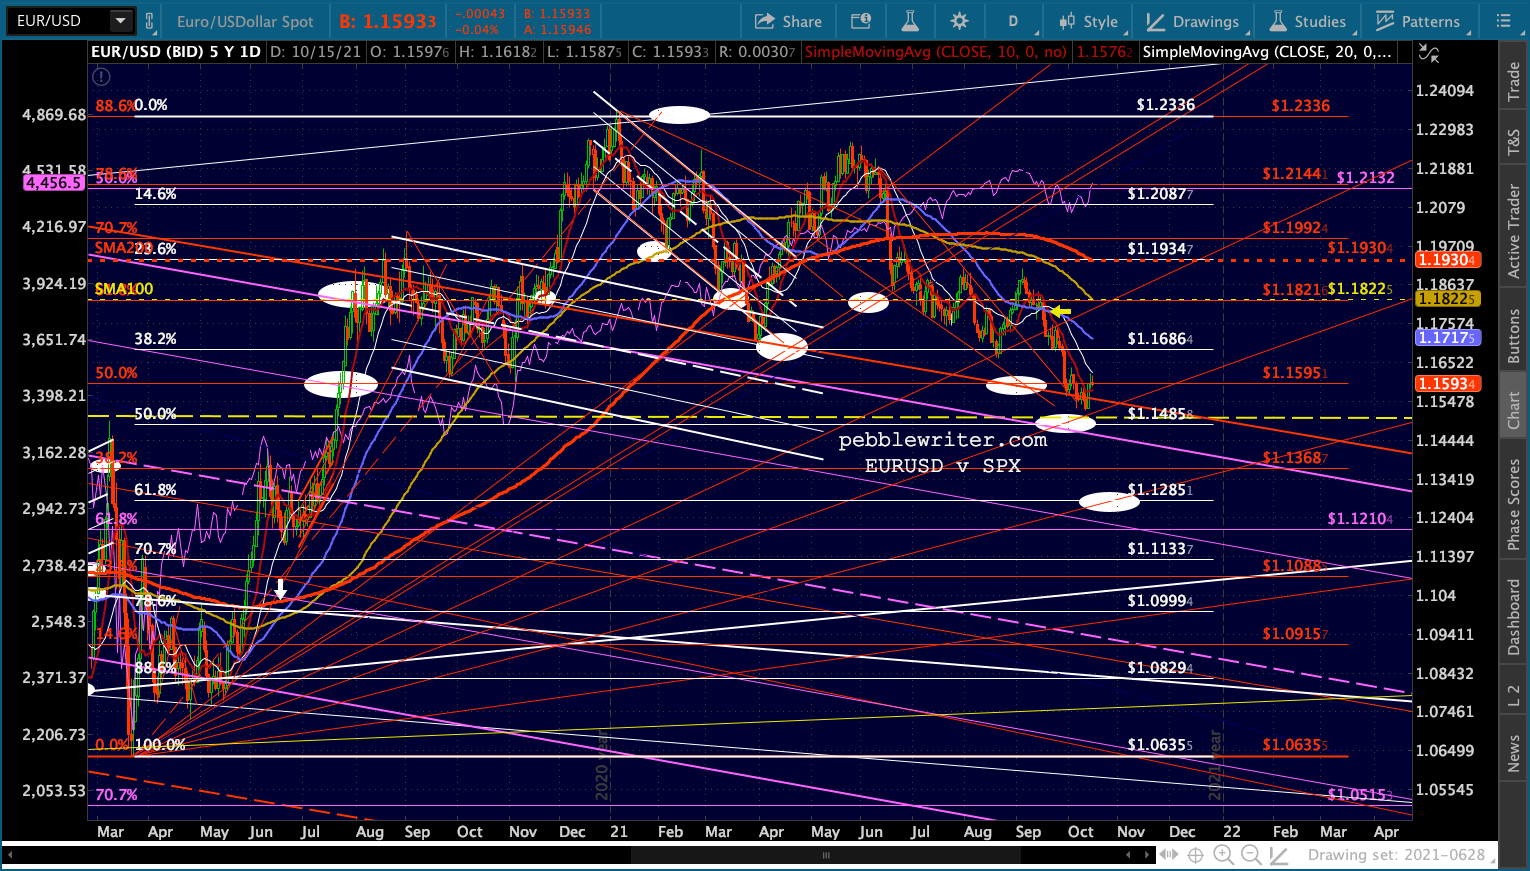 This would allow DXY to finally break out of the flag pattern, almost always bearish for stocks.
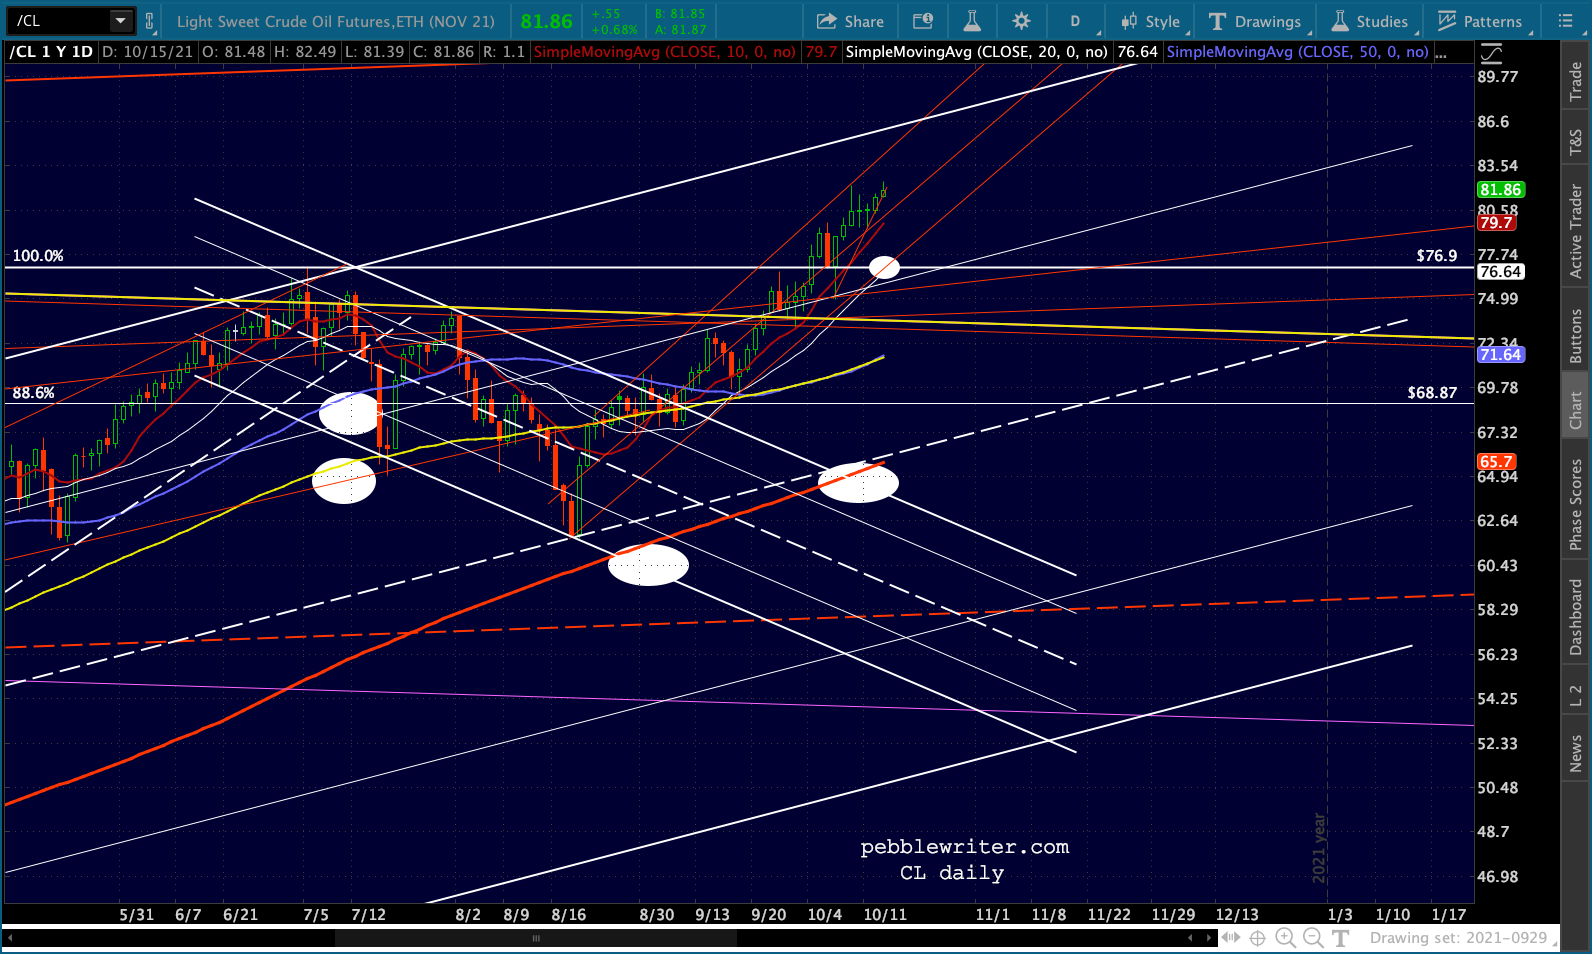
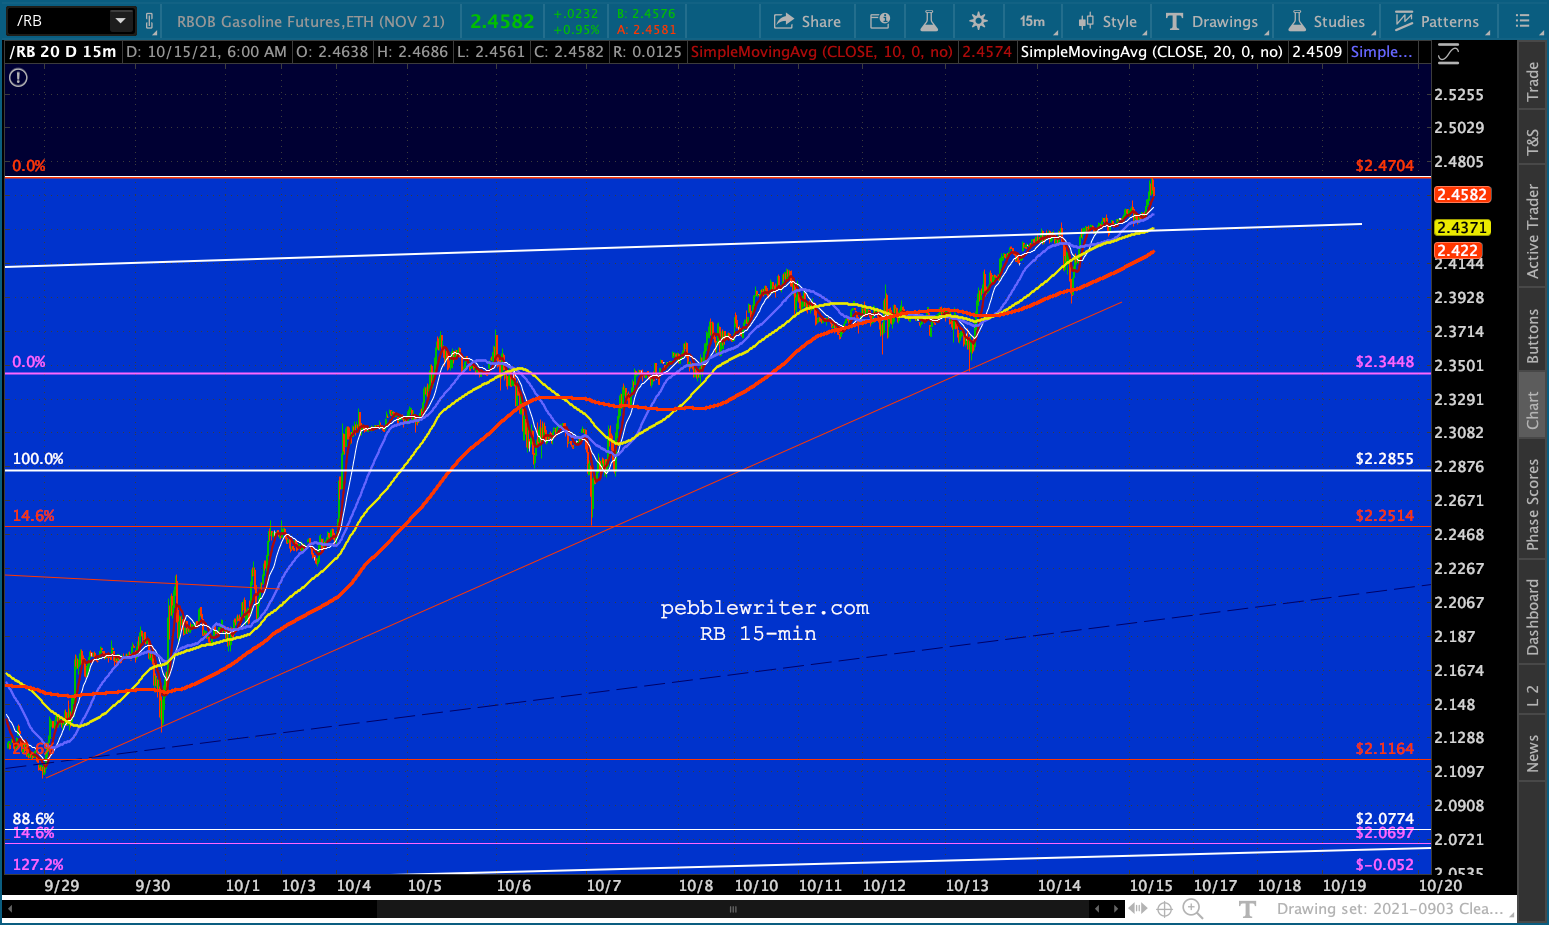
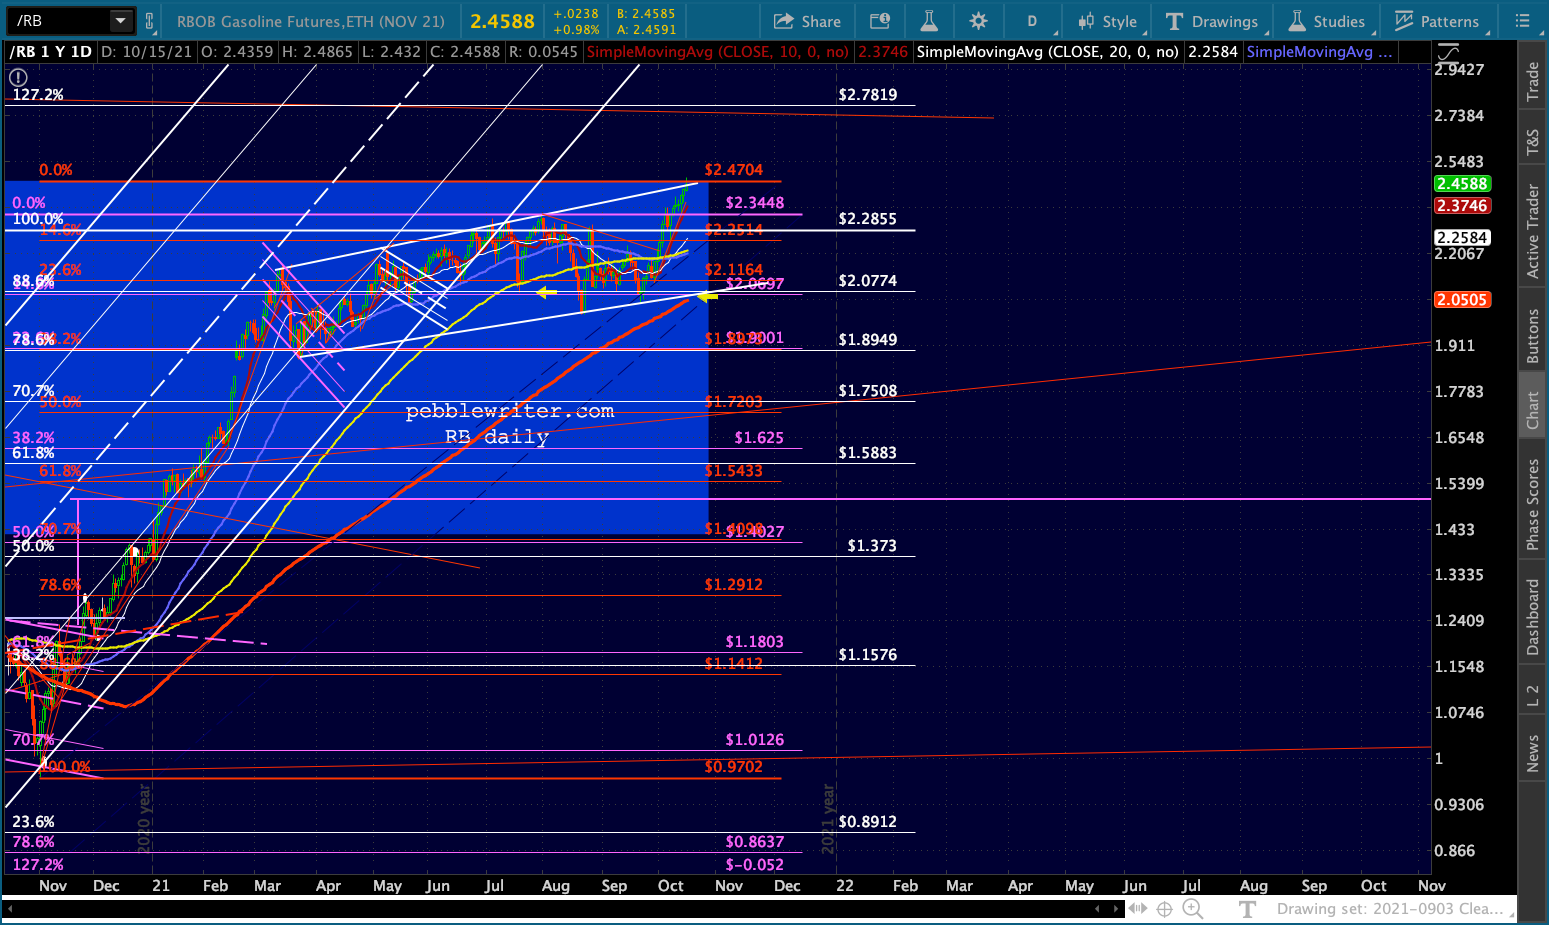
 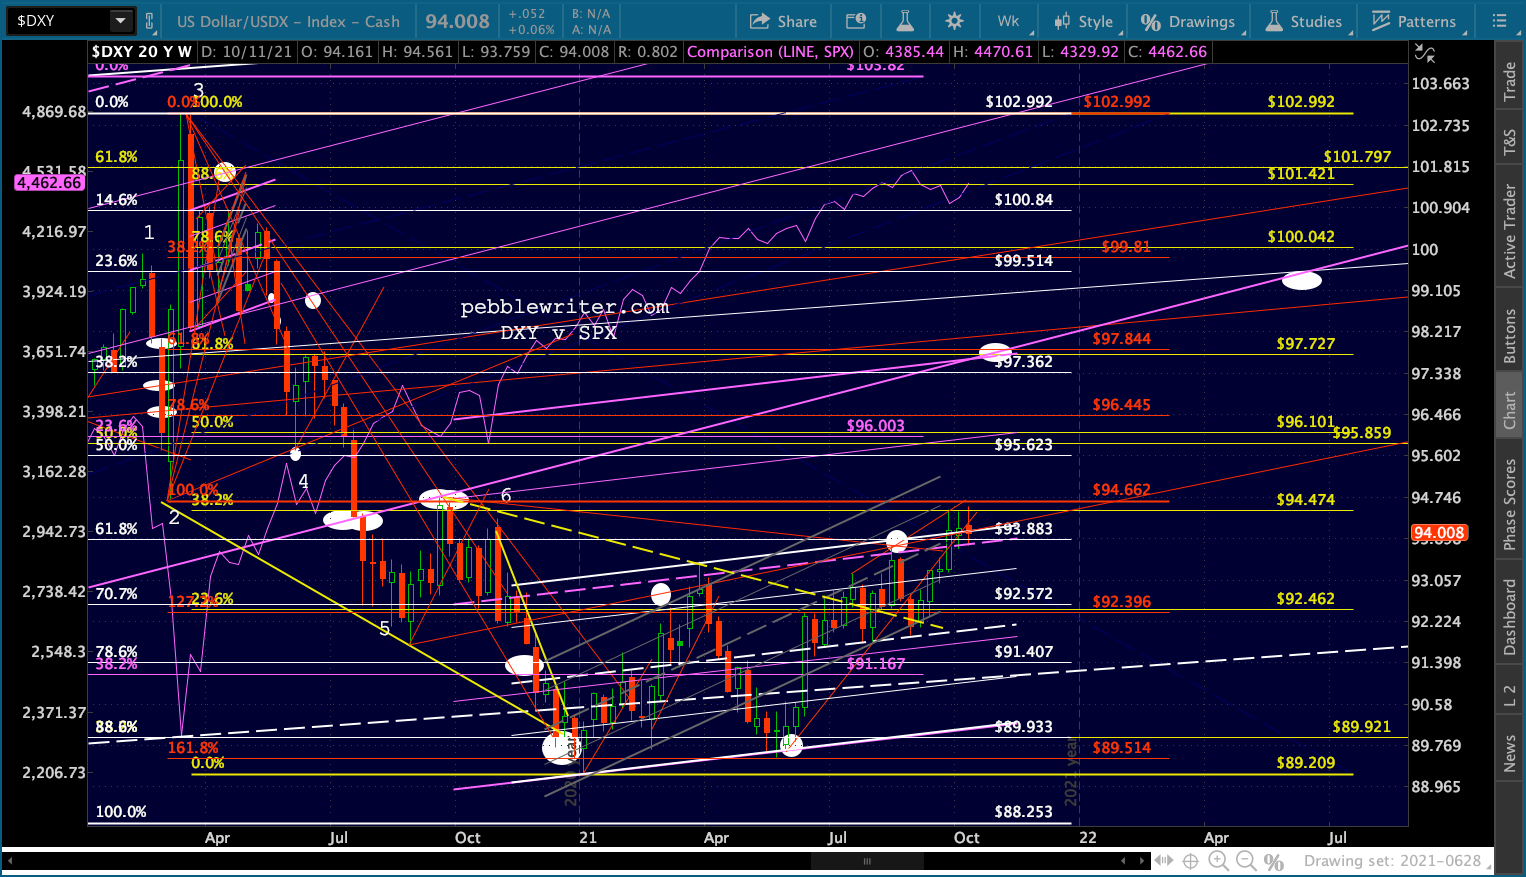 Last, but certainly not least, we’d want to see CL and RB finally break down – even a little. At this point, either can register a SMA200 without making a lower low.
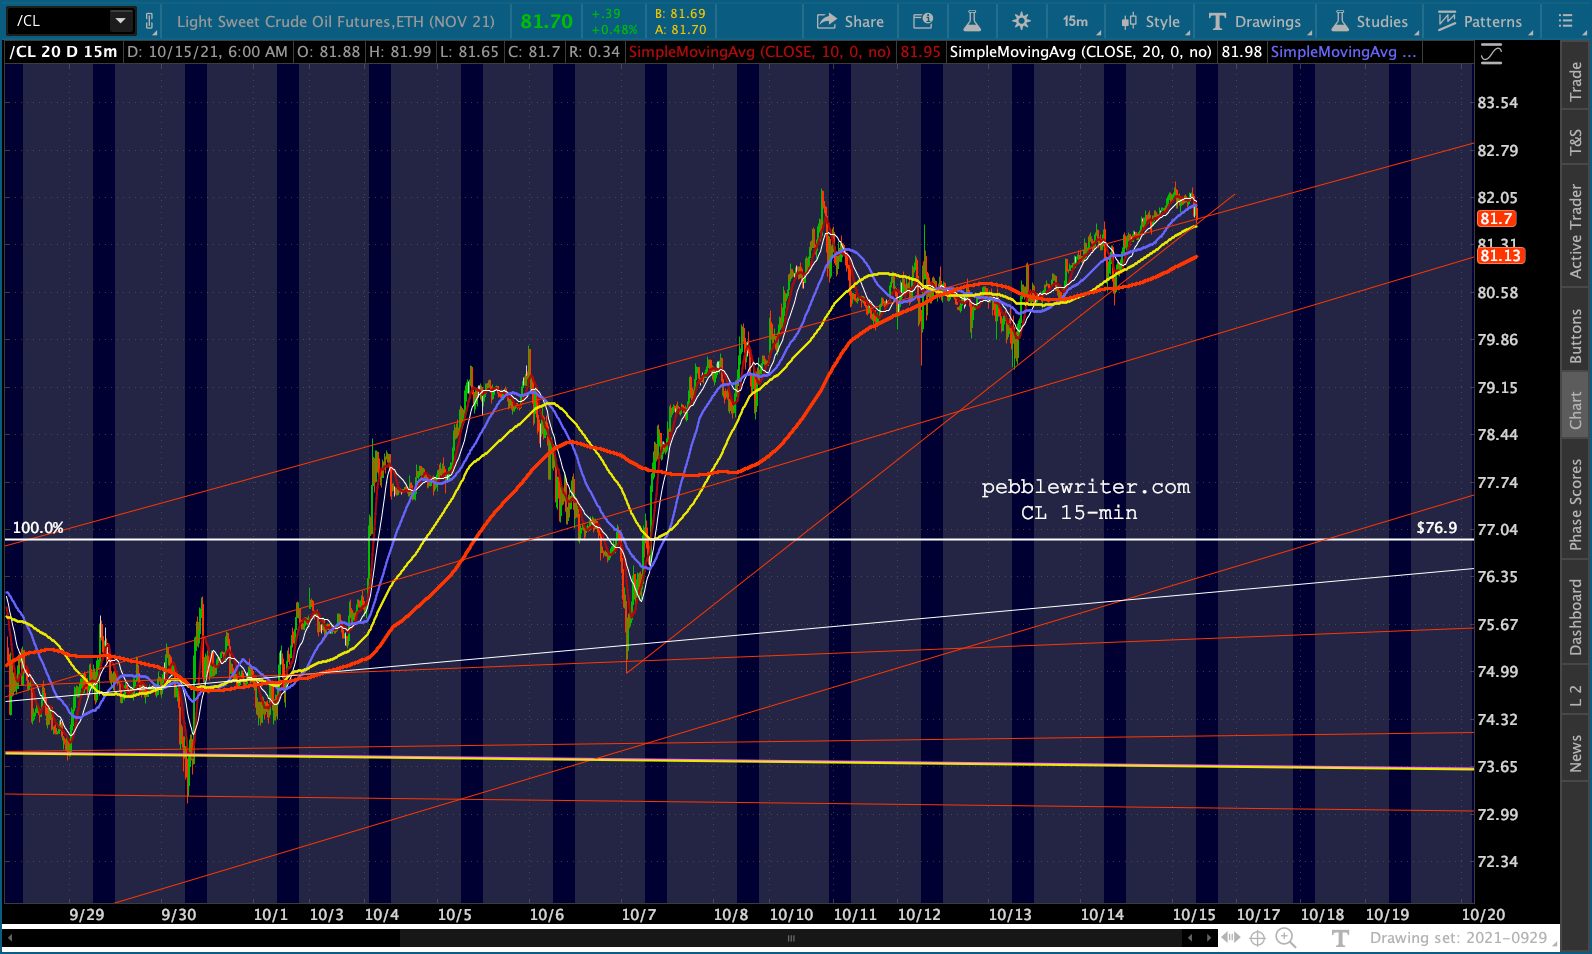
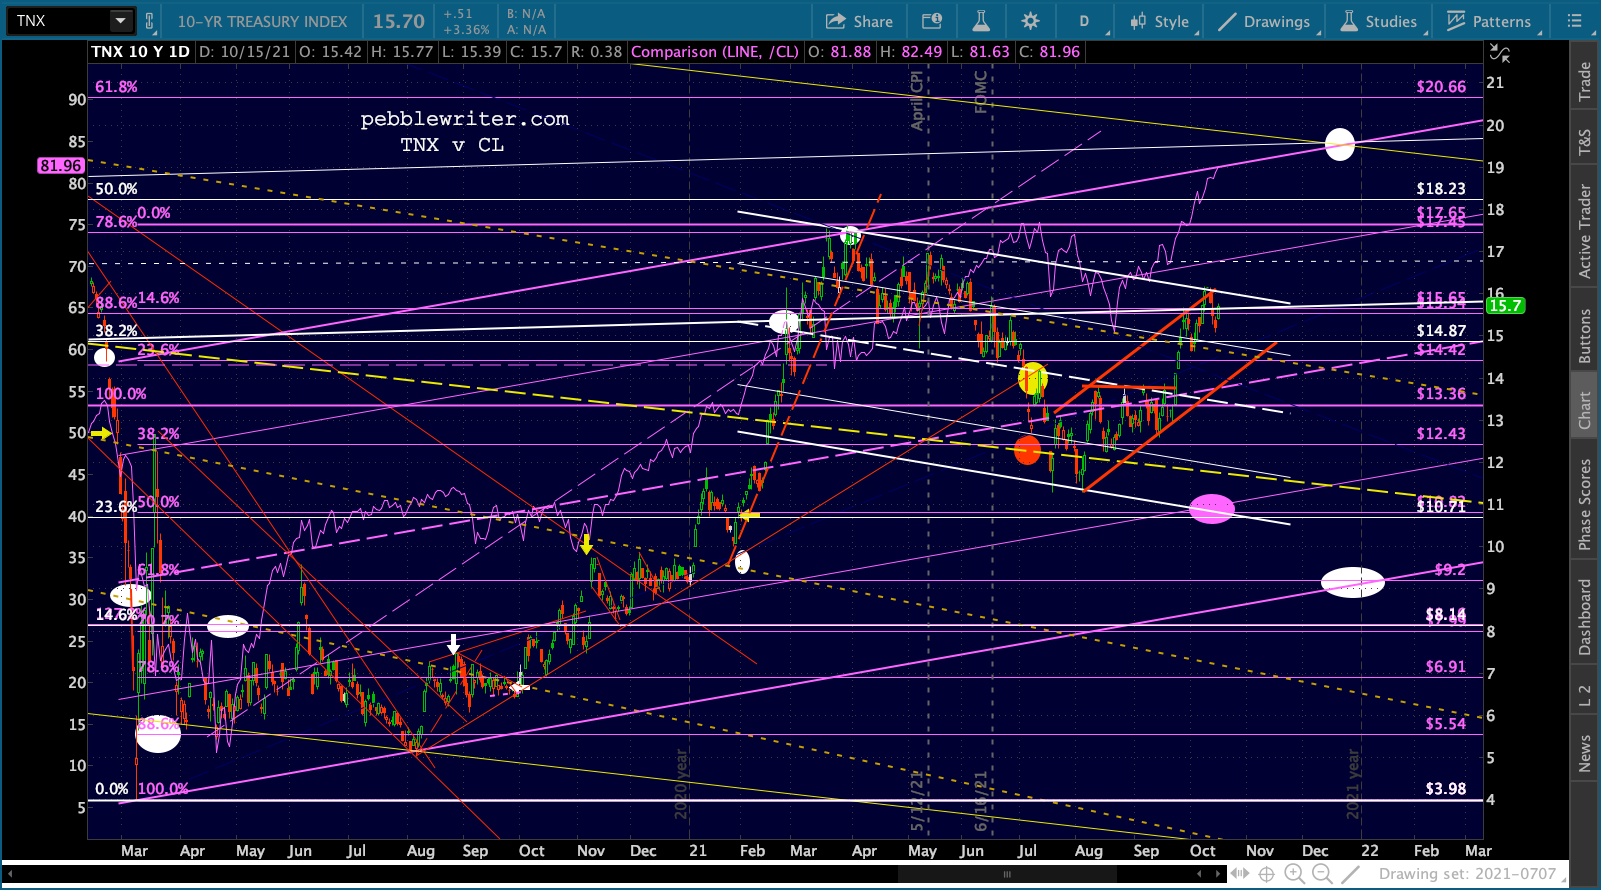
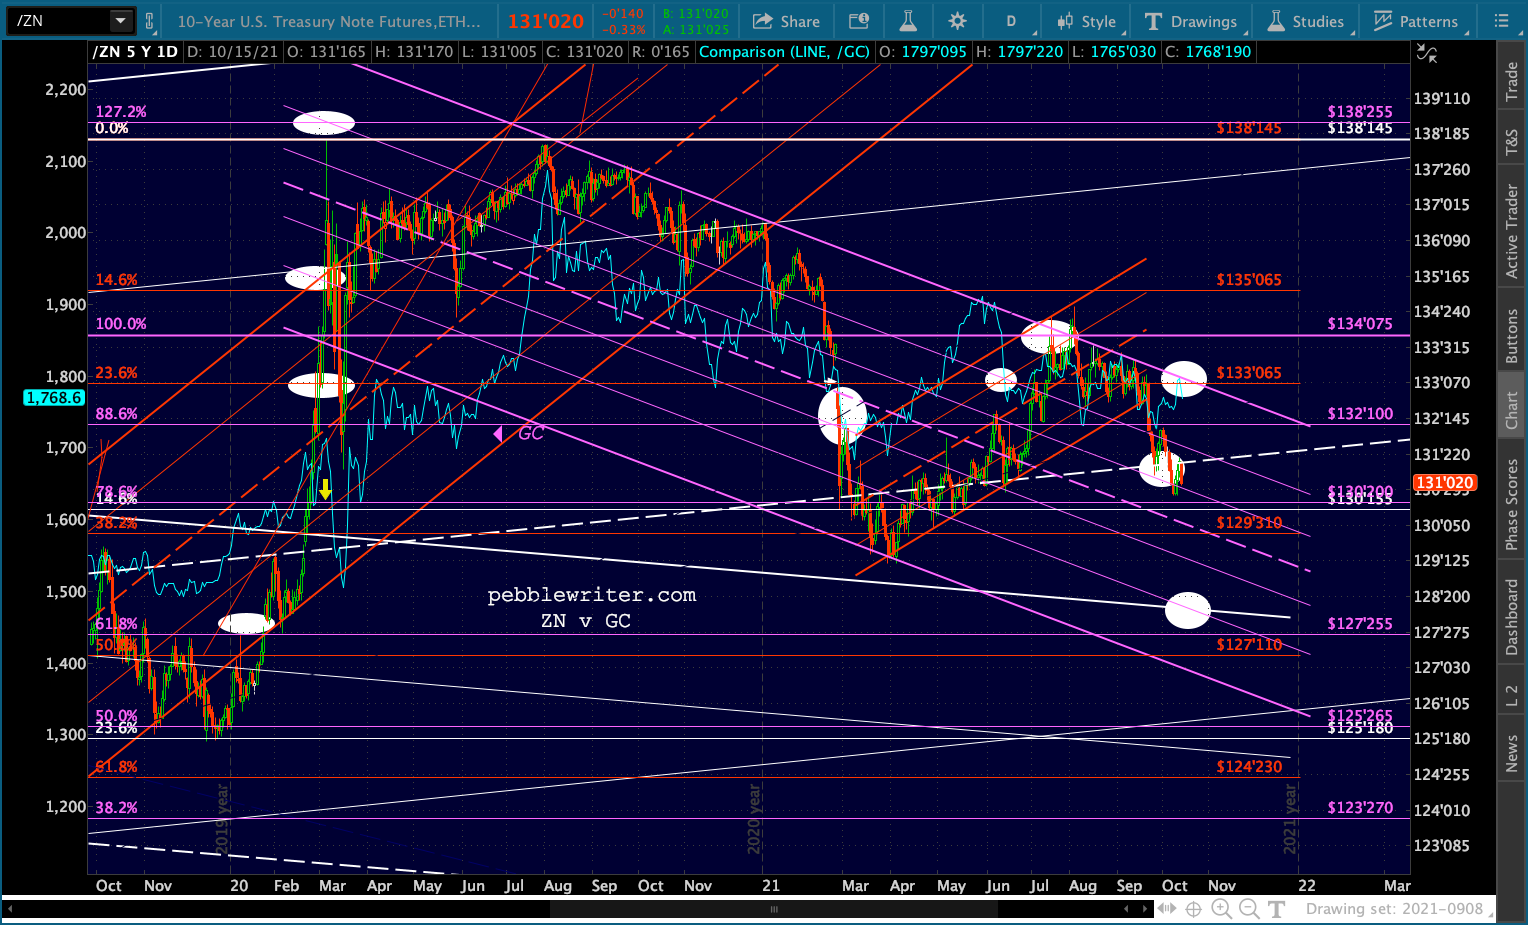
 Less important factors include the 10Y, which we’d want to see slump back toward the bottom of the rising red channel…
 …and DJIA, whose price has broken out but still shows a chance of reversal per its RSI.
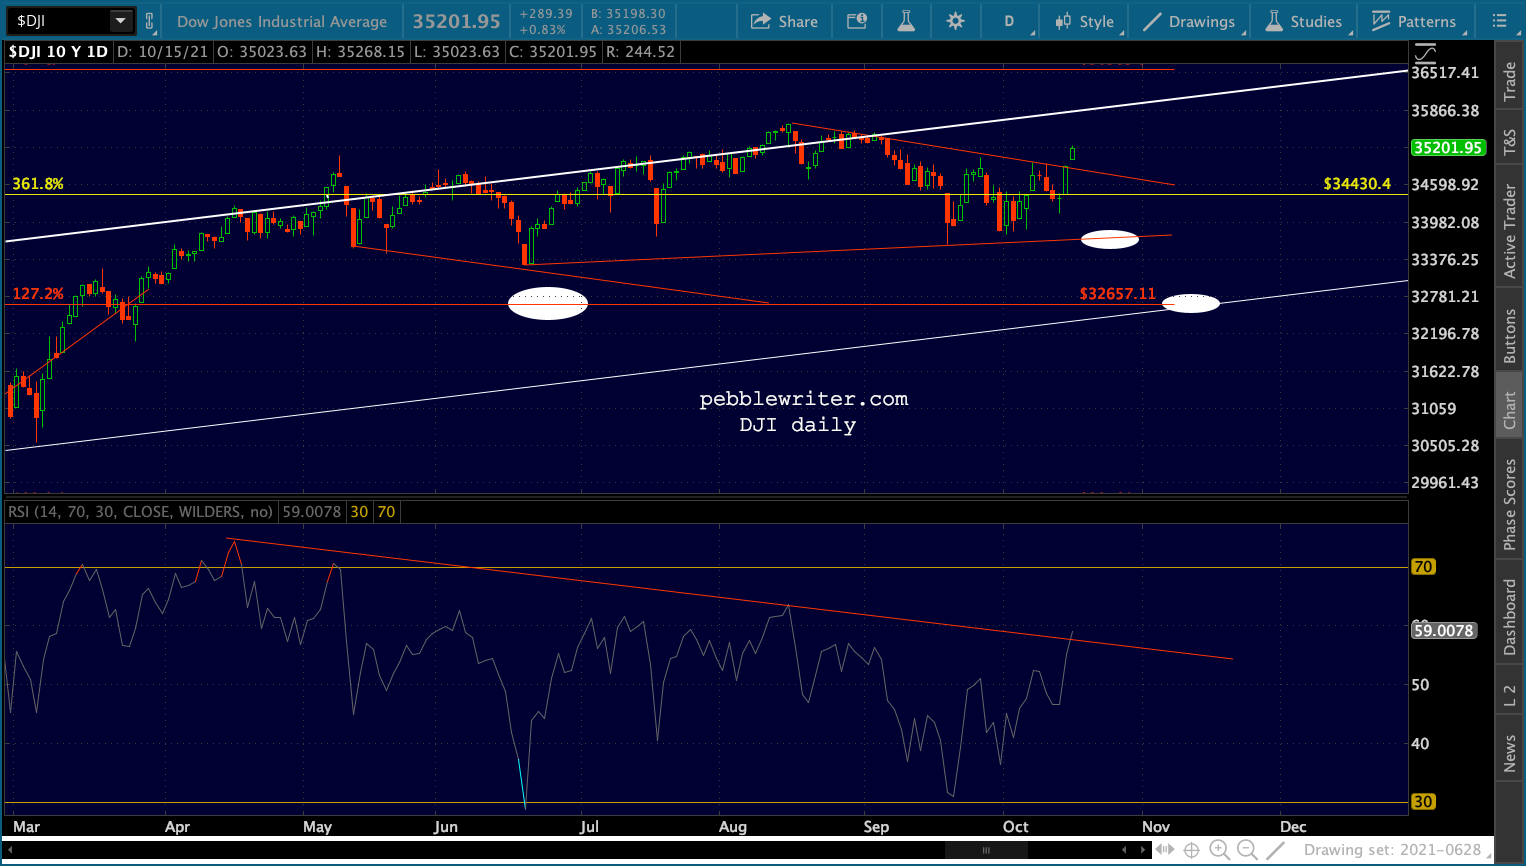 BTW, we noted on Oct 6 that BTC had broken out. As we discussed at the time:
If it can break through 55,500, it has upside potential to 57,127 and then 60,757 and ultimately 66,500. If it stalls here, however, it has downside potential to as low as 24,000. Either direction should play out very quickly from here – which suggests a collapse more so than a sharp spike higher…
It has obviously moved up through the .786 and is now leaking past the .886 at 60,757.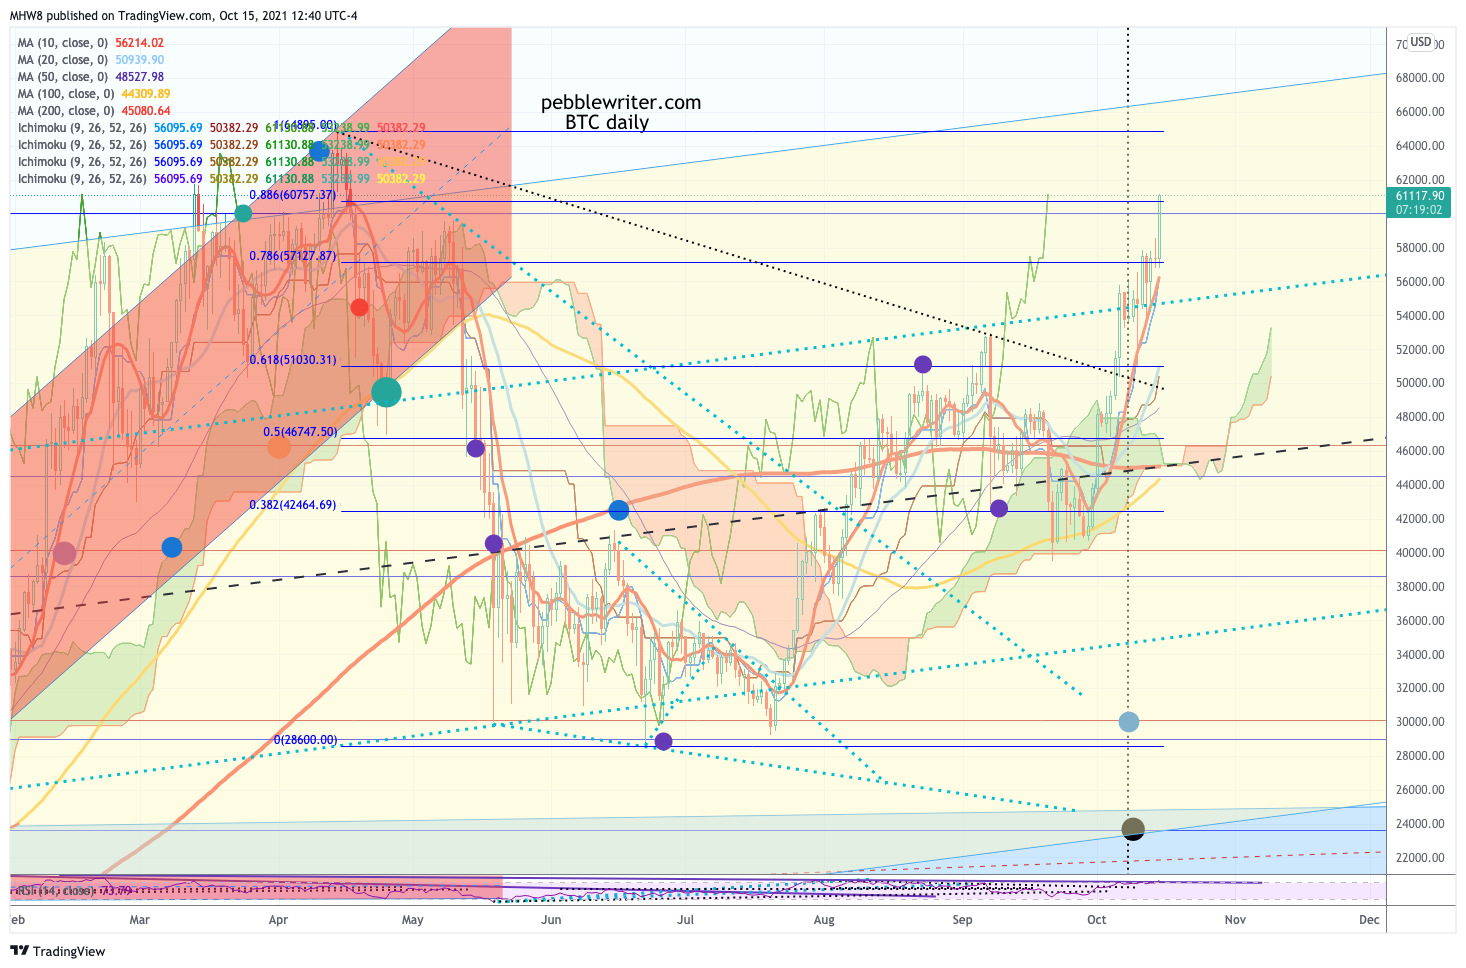 A failure of its RSI to reverse by the end of the day would make a good argument for the channel top at 66,500.
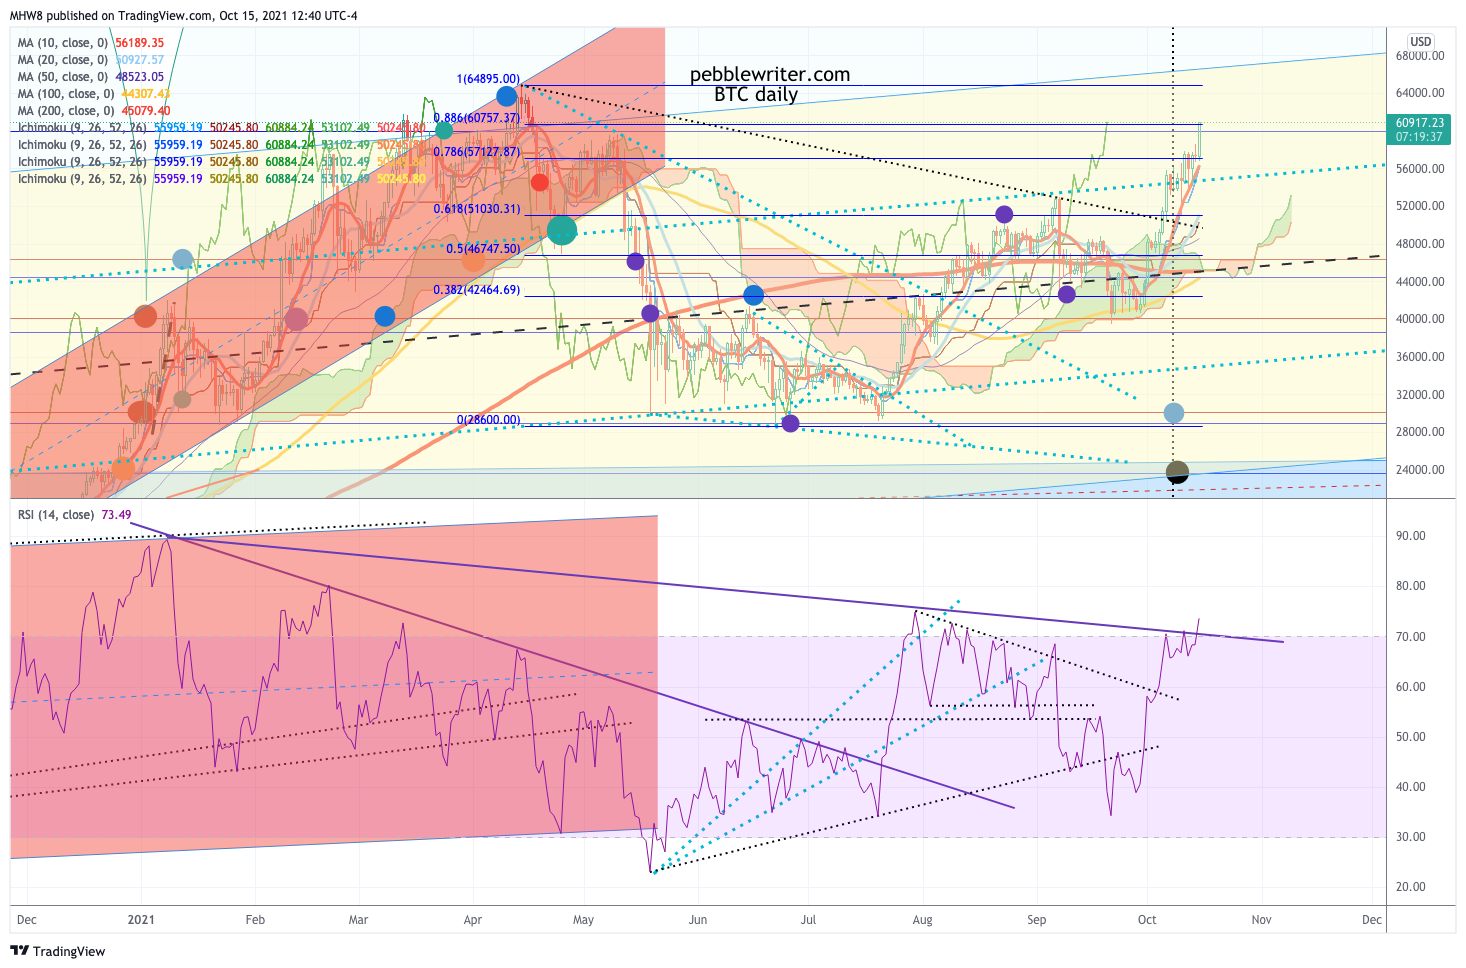 GLTA.
GLTA.