Tag: Yen

  • The Holding Pattern

    Futures are heading for another test of the 2.618 Fib extension at 3076.93, the fourth since last pushing above it on Monday.

    There are numerous targets below, but that would mean cooperation from the algos – a rare commodity these days. The bearish case, however, is growing stronger every day.

    continued for members(more…)

  • Powell: What Did I Say!?

    I saw an interesting interview on CNBC this morning where the guest observed how important overnight trading was to the market’s overall performance. Andrew Ross Sorkin offered data that if one bought the S&P 500 at the close of each day of trading and sold at the next morning’s open, they would be up 650% since 1993.  If, instead, they bought at the open and sold at the close, they would be down 3%.

    This observation won’t surprise any of our members, who are well-versed in the market’s increasingly endemic ramp jobs over the past 12 years. So far so good. The problem with the interview came when a rationale for the effect was offered: one should be compensated for taking overnight risk.  Mike Santoli then chipped in, adding another explanation: more news happens outside of market hours than during.  Ugh. And, it was going so well…

    Let’s be clear about one thing: markets are manipulated, and it’s almost always intentional. Sometimes it’s quite obvious and effective, such as the announcement of a enormous new round of QE on March 23. This particular one was ridiculously obvious, as it came at 8am on the day the Dow would complete a 38% crash to test its Nov 9, 2016 lows (the day after the presidential election.)

    The rest of the time, it’s done so discretely that most observers are unaware of the actual machinations. We discuss the whys and wherefores every single day, as understanding the motives and means provides an excellent road map for our forecasts.

    A great example is our VIX chart, which has exhibited an orderly collapse since it reached our Fibonacci .886 target at 80.3 on March 16.The declines most often come in the after-hours, before the cash market opens. This prompts the algos to buy futures, which results in a gap higher on the open as the rest of the machines kick into gear (index funds, ETFs, quants, etc.) The fundamental crowd, which accounts for only 10% of volume, brings up the rear.

    It’s notable then that after bouncing at its 200-DMA and a trend line off its 2018 lows, VIX finally departed from this channel (the yellow arrow above) last night.

    This allowed our favored scenario to play out as described yesterday.

    I’m leaning toward a correction beginning today, but am unsure whether the channel bottoms at ES 3076 and 3122-3135 will hold or not.  It depends a great deal on what Powell says later today.

    Bottom line, Powell’s comments weren’t terribly uplifting as he essentially confirmed that a rebound is not just around the corner. The problem is the fallout from the coronavirus – which the rest of the world is beginning to understand has not gone away — not even with the Fed’s best efforts.

    As to the markets… so far, so good. The key, of course, will be what happens if/when it reaches the 2.618 Fib extension at 3076.93.

    continued for members(more…)

  • The Hits Keep Coming

    It’s the last day of a short week packed with more important economic data — which the market has managed to ignore so far. Today might be a little different, as the spike in the savings rate and the collapse in consumption confirm a troubled road ahead for the strong consumer narrative.  Gee, could 25% unemployment actually begin to matter?

    Ignore the spike in personal income, as it reflects the massive government stimulus checks sent out last month.

    The PCE deflator also surprised, plunging almost to 2009 levels. So far, the futures have managed a muted reaction, with a likely falling wedge setting up following yesterday’s reversal at our channel midline target.But, with China trouble, riots in Minneapolis, and Trump taking a swing at social media darlings, maybe the data will matter for a change.

    continued for members(more…)

  • Yield Curve Warning

    In a bit of a delayed reaction to Treasury’s announcement of its $3 trillion borrowing needs in Q2, the 2s10s has pushed above the white TL connecting all-time lows – a clear warning, should it last, for equities.

    Meanwhile, CL backtested its Feb 2016 lows and USDJPY broke down at about the same time that ADP announced another 20 million job losses (roughly in line with Friday’s NFP.)  All of this came on the back of dismal earnings from market darling Disney.

    continued for members(more…)

  • Update on DJIA: Mar 18, 2020

    In our last dedicated update on the Dow [see: July 2019 Update], we noted the intersection of a number of overhead resistance features in its chart and offered some thoughts on its downside potential if it managed to reverse.

    Note that our 18974 target represents a backtest of the red channel from which DJIA broke out and backtested between 2014-2016 as well as the white 1.618. A May 2020 bottom at 18974ish would align nicely with the SPX 2138 target indicated by our analog.

    I posted my charts on July 29 (the yellow arrow) and was roundly cheered when he Dow cratered 7% over the next two weeks, even closing below its 200-DMA……and was loudly jeered when it made that up and went on to new all-time highs. I’ve seen this sort of thing so often from the Dow that I was pretty hot under the collar. I’m pretty sure an older (yes, there are a few) wiser colleague took me aside and muttered “Forget it, Pebble, it’s the Dow.”

    So, I did. You see, when it comes to manipulation the Dow is the all-time champ: share price weighted, with the ability to kick out losers and slide in winners whenever you like? How is this even an index?

    When the market reversed on cue in mid-February [see: A New Day, Same Old Nonsense]  I don’t think I even checked to see where the Dow was (the blue arrow below.) I’ll admit I got curious when it closed below its 200-DMA on Feb 25. But, I didn’t inhale. I stayed focused on real indices, cratering oil prices and the bond market.Well…guess where it landed today?  Go ahead.  I’ll wait.

    You guessed it. Right where our July 2019 forecast said: the bottom of the falling red channel where it intersected with the top of the rising red channel and the 1.618 Fib extension at 18974. It’s a 33% drop from stem to stern. You can’t make this stuff up.

    Knowing we have a global pandemic on our hands and a minimum of a quarter of negative GDP ahead of us, surely it’ll keep going, right?  I mean, did you hear Bill Ackman today?  Hell is coming!  So, the Dow is positioned for a bounce.  That’s right.  IF oil and gas can continue bouncing, and IF USDJPY can pop up through its SMA200 and IF VIX breaks down and IF the 2s10s craters back below 48 bps, then DJIA will definitely probably bounce.  At least a little.

    continued for members(more…)

  • Just Two Charts

    Two charts best define the day we had yesterday.

    First, VIX tagged our next highest target: the intersection of the .786 Fibonacci retracement and the trend line connecting two previous highs.

    The other one was the SPX arithmetic (as opposed to log) chart, which stopped on a dime at the channel bottom.The bleeding continued well past the Fed’s ineffectual $1.5 trillion injection and had to wait until the low-volume aftermarket to be staunched. At that point, central bankers went to work – pumping oil and gas, the dollar, interest rates and currencies in order to restore confidence whip up the algos. It worked…at least so far.

    I’ll have a separate post up later regarding COVID-19, including my latest projections for the US.

    continued for members(more…)

  • The Storm Finally Arrives

    After weeks of gathering clouds, the storm we’ve been watching has finally arrived. S&P futures are lock limit down just a few points above our next downside target.

    Not surprisingly, all of our other targets across currencies, commodities and fixed income have either tagged or exceeded our next downside targets, with more to go once the cash market opens.

    continued for members(more…)

  • Decision Time, Again

    We start this morning’s post with a peek at the Russell 2000 as it perfectly illustrates the dilemma facing the broader markets this morning.

    Up until September 2017, RUT followed a well-defined rising channel shown below in yellow.  Like all channels, it was defined by the tops and bottoms along the way. The only problem: The channel was rising only about 5% per year – hardly enough to get excited about. By late 2016, it had become obvious that algos had more influence than discretionary, fundamentally-oriented investors. The algos were, in turn, influenced by certain factors which central banks and their proxies could usually control quite easily.  By wagging the tail (the factors) the whole dog (the market) would usually fall in line.

    In September 2017, after RUT had been bumping up against the top of the rising yellow channel for over 9 months, the factors went to work and RUT  broke out of the yellow channel and rose 21% over the next year. The slope of the new rising white channel was good for about 20% per year.

    Everything was going well until September 2018 when RUT topped out at 1742 and plunged 27% in only three months. To make matters worse, the new rising white channel broke down and RUT fell back below the top of the yellow channel from which it had broken out.

    It spent the better part of the next year trying to break out of the yellow channel again – failing seven times until Dec 4, 2019, when it finally shot above the channel top and remained there. There was a scare last month when, on Jan 31, it successfully backtested the channel top and bounced 5.5%.

    Given yesterday’s carnage, though, it has fallen back to the top of the yellow channel where it faces that same important test all over again.  If it holds, all is well and investors can go back to mindless trend following.

    Even if it doesn’t, the SMA200 is now up to 1574, a modest 3.3% below yesterday’s close. But dropping through 1616ish would mean breaking down below the horizontal support (which served as overhead resistance between Oct 2018 and Dec 2019.) It could accelerate losses and complicate the rescue mission.RUT is typical of many of the indices and individual equities I chart every day. The Dow, for instance, faces a similar test at 27,700.And, SPX and ES completed important backtests (the purple channel top below) in the process of tagging our next downside targets yesterday.Given the way the factors are behaving this morning, there is a good possibility that we’ll see additional backtest targets such as DJIA 27,700 tested today. But, that would mean taking a chance on the algos’ ability to rescue stocks from some very risky waters.

    Stay tuned.

    continued for members(more…)

  • Inflation Games

    Inflation drives interest rates. Though the Fed probably wishes it didn’t, it’s an inconvenient truth.  There are much tighter correlations, but consider the strong positive correlation between CPI and 10Y notes.

    This matters, of course, because with $22 trillion in debt, the US faces the same problem as the ECB and Japan: High interest rates on rising debt levels (the blue bars below) would lead to insolvency.  The slight increase in average interest rates (the black line) between 2018 and 2019, for instance, sent interest expense (the red line) soaring.

    There are only two ways to keep interest expense from consuming untenable slices of the budget: cut back on spending or bring interest rates back down and keep them down. Since the government isn’t likely to cut spending any time soon, this means focusing on interest rates.

    Japan and the ECB have coped with runaway debt by manipulating rates below zero — negative interest rates where you pay the government money to borrow from you. Though not there yet, the US is on the same path, seen most notably lately in the repo market through Not-QE.

    The government plays lots of games with inflation.  There are many different definitions, some of which include or exclude different expenses such as food, gas prices and rent. Although just as flawed as any, I like good old-fashioned CPI as it includes food and gas prices — things that affect the budget of almost every American and is factored into many important calculations such as cost of living increases.

    CPI can be influenced in some very predictable ways, some of which are subject to manipulation such as oil and gas prices.  Without harping on geopolitical considerations [see: Coincidences and Consequences] all over again, it’s obvious that the Fed’s effort to keep interest rates low is dependent on keeping inflation under control which, in turn, is dependent on keeping the annual change in gas prices under control.  How so?

    CPI (which, remember, is a measure of the rate of change in prices) has averaged +1.74% through October 2019, while YoY changes in the price of gas have averaged -6.79%. Months such as January and February, when CPI registered 1.55% and 1.52%, corresponded with the largest YoY drops in gas prices: -13.05% and -10.65%.  In April, the only positive YoY change in gas prices (+1.58%) produced the highest CPI measure of the year: 2.0%.

    The chart below illustrates the relationship so far in 2019 which simple regression analysis reveals is:

    CPI = (0.0263 x YoY change in gas prices) + 0.01918.

    In November, the rate of change in gas prices was only -3.16%. All else being equal, this suggests CPI will come in around 1.84% – a modest uptick. However, the first reading in December (unless gas prices fall) would indicate a 9.8% YoY increase in gas prices and a CPI reading of +2.18% or greater.

    That, folks, is why the Fed is considering formal changes to the way it evaluates inflation as (not) detailed in the official gobbledygook offered last month. It also explains the various comments made by Fed officials – first suggesting that inflation should target a range rather than a specific level (i.e. 2.0%) and more recently suggesting that inflation should be allowed to “run hot.”

    As the Financial Times reported:

    The Federal Reserve is considering introducing a rule that would let inflation run above its 2 per cent target, a potentially significant shift in its interest rate policy.

    The Fed’s year-long review of its monetary policy tools is due to conclude next year and, according to interviews with current and former policymakers, the central bank is considering a promise that when it misses its inflation target, it will then temporarily raise that target, to make up for lost inflation…

    If the Fed adopts this so-called “make-up strategy”, it would mark the biggest shift in how it carries out its interest rate policy since it began to target 2 per cent inflation in 2012.

    Most economists would probably suggest that the Fed has been working hard over the years to get inflation up to 2%. I strongly disagree and believe the Fed has used the constant shortfalls as the primary rationale for accommodative monetary policy – the purpose of which is to keep interest rates low and support equity prices.

    This latest prevarication is intended to provide cover for the fact that oil and gas prices have been propped up in the lead up to the Aramco IPO.  Now that the IPO is in the rear view, we’ll find out whether central banks can really stomach 2.2% CPI or gas prices are about to tumble a good 6-8%.

    If the past is any indication, the Fed won’t take a chance on CPI over 2.0% and we’ll see oil and gas prices drop substantially over the next couple of weeks. The White House wouldn’t complain, especially if it helps keep interest rates low.

    If I’m wrong, and inflation heads back above 2% (remember, the next tariff is scheduled to arrive on Monday) then we face bigger problems in January (when December CPI is reported.) I’ll post oil and gas price targets below the break.

    Meanwhile, it’s Tuesday and futures were off substantially overnight, so of course there’s news on the trade front – particularly in light of the impeachment goings on.  S&P futures have spiked 25 points off their overnight lows, but have yet to break out of the falling white channel that leads to a 3.5% correction.

    continued for members(more…)

  • Because Appearances Matter

    It’s not too surprising that there’s been a firm floor under oil and gas prices, given the upcoming Aramco IPO.  But, isn’t it funny how CL has popped above its SMA200 every single day this week, even in the wake of dismal inventory data?

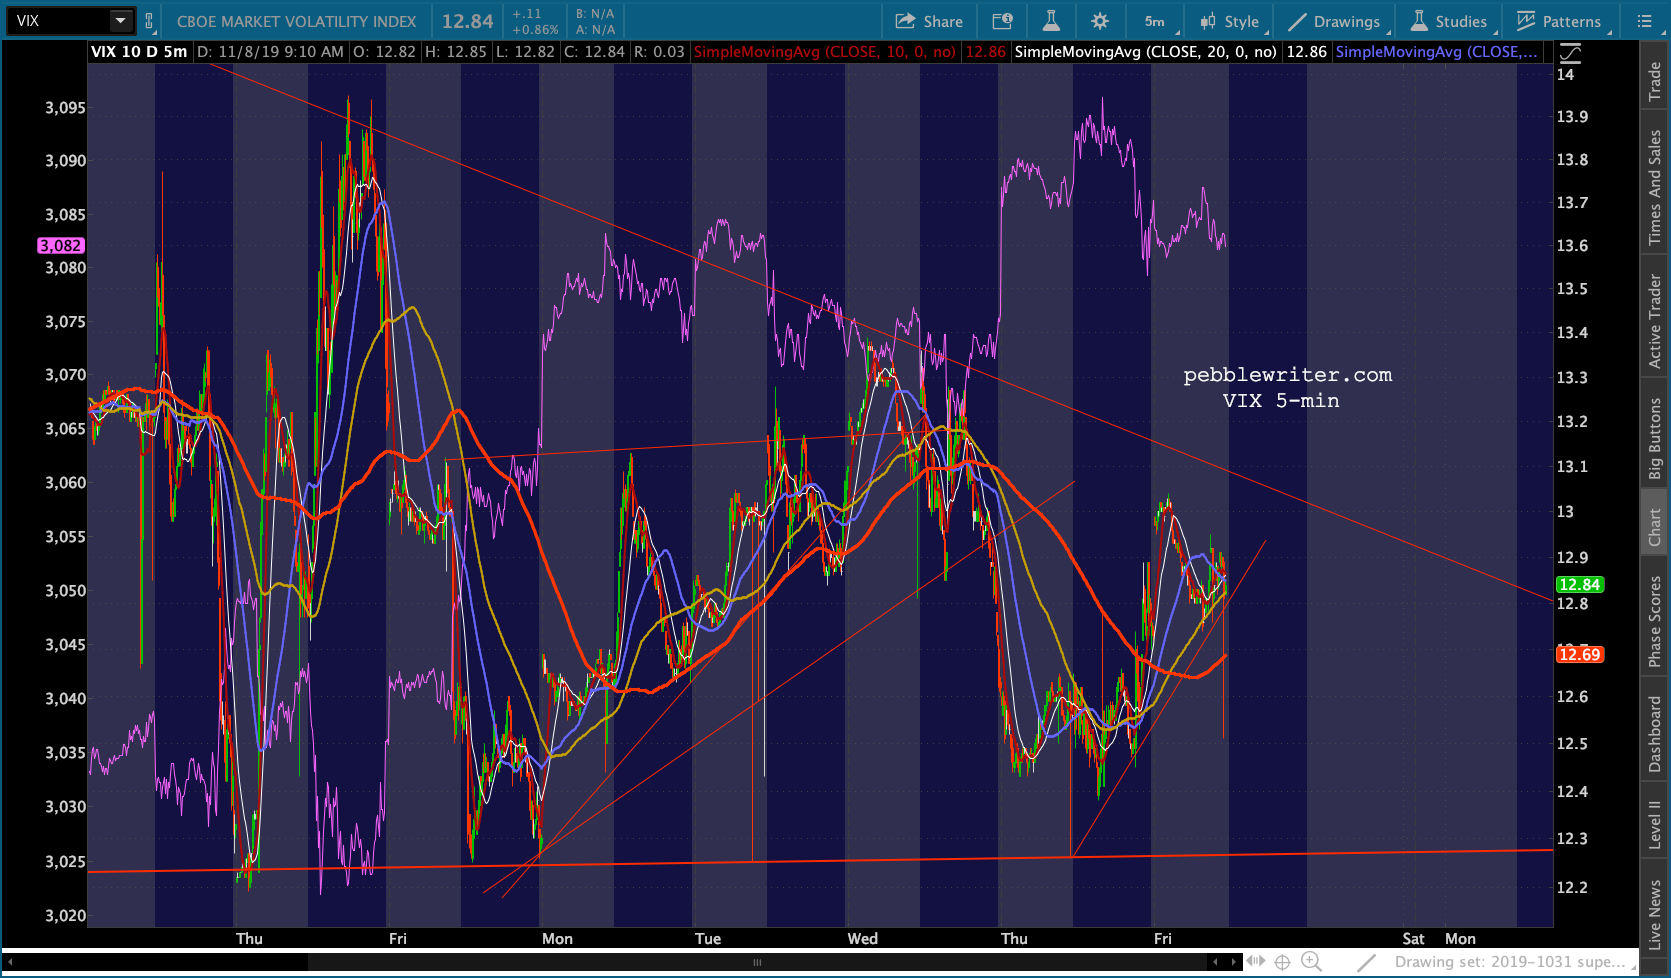
    Just like it’s funny that ES, which pretty obviously should have given up all its overnight trade data related gains should have given up at least most of them after the Reuters laid a little trade truthiness on us.If it had done so before the close, ES would have put in another bearish-looking daily candle.  But, it waited until later in the evening, which allowed ES to leave a bullish candle in its wake.  Funny how that happened.VIX is well-known for timely “breakdowns” that last anywhere from a few seconds to a few minutes which remind the algos of the glory which awaits them if they’ll simply buy-buy-buy.  Today, like yesterday, it hit at exactly 9:00 AM – about the time futures were trying to decide whether the market should open in the green or the red.  Watch for it to happen again if stocks should have the nerve to slip lower.But, the champion of bullish appearances has to be the USDJPY, which has reminded us of its incredible upside potential over the past month, repeatedly pushing above its SMA200 and pumping the Nikkei 12% in the process.Combined with timely soundbites from the White House on the incredible successes being achieved on the trade front, the market can’t be blamed for ramping higher most every day.  But, what happens if the narrative changes?  What happens if one or more of the factors fueling the machine runs dry?
    continued for members(more…)

