

It’s a strange phenomenon: the more serious the coronavirus threat, the more strenuous the efforts to prop up stocks. After headlines such as those below, the market has no business being in positive territory.


Yet, here we are, with ES up 6.50 points. VIX is actually off. Sheer lunacy. Likewise, oil and gas are rallying as though the EIA, API and OPEC hadn’t all downgraded their demand estimates.
Will the market take any of this information to heart, or will we get the usual holiday weekend gap higher?
continued for members…
USDJPY is holding the SMA60 200 as support and, more importantly, not breaking down yet. Remember, the bulls need a breakout above that red channel top.
 DXY remains broken out and is threatening new cycle highs – almost a certainty if stocks are going to push any higher.
 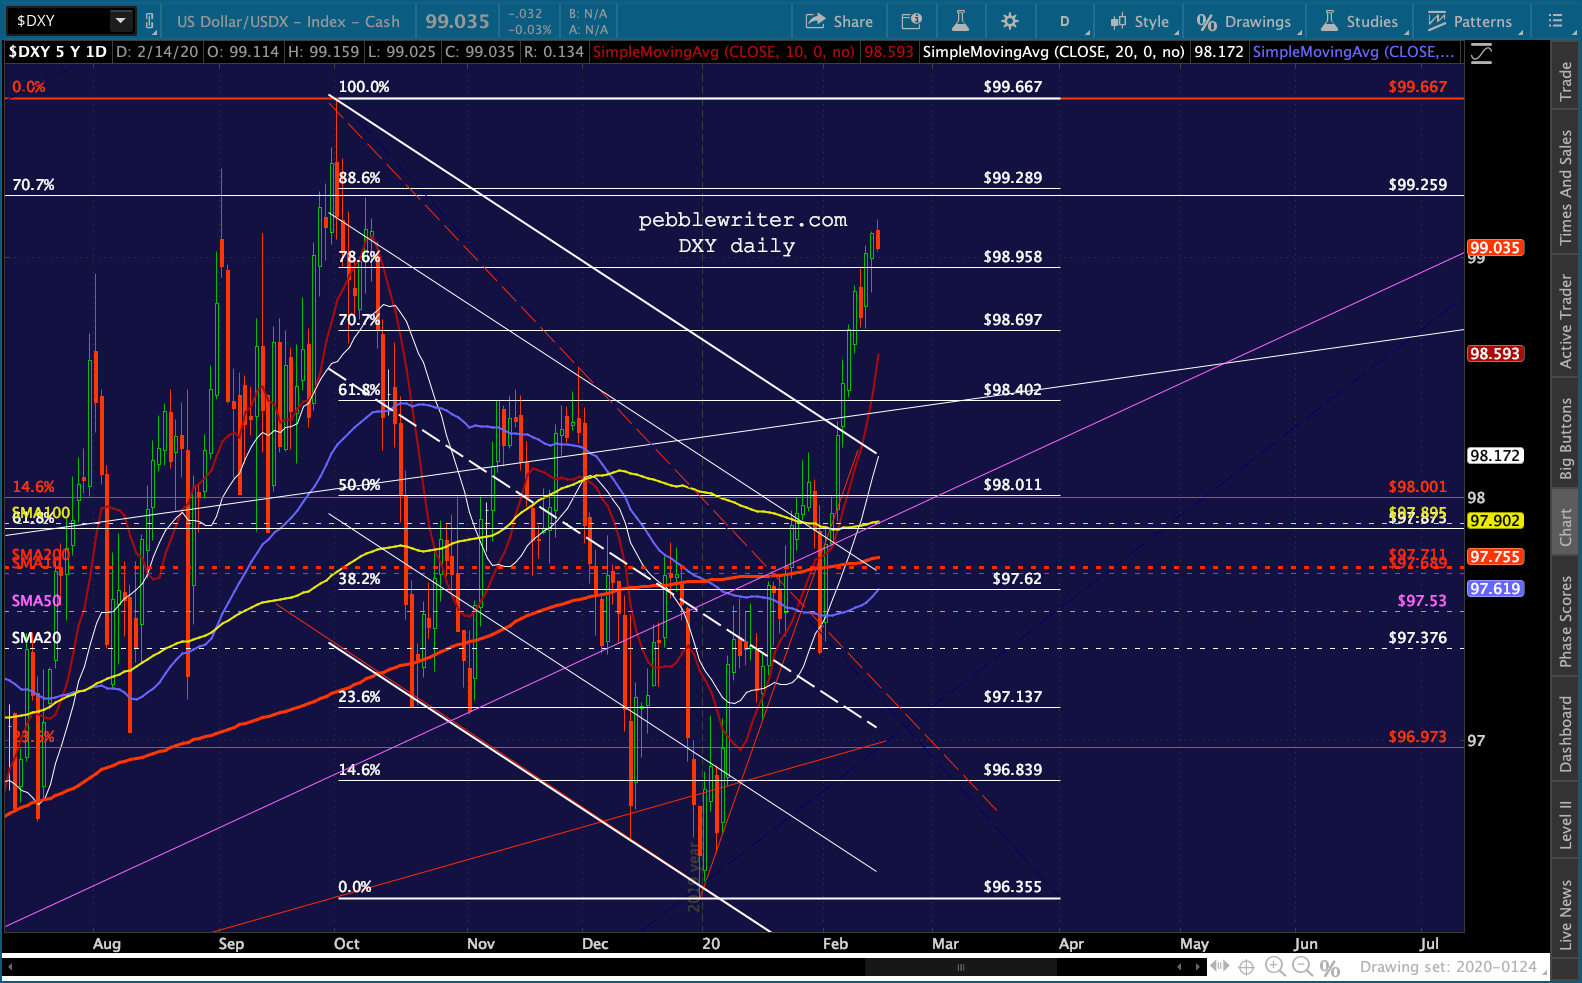 EURUSD’s downside potential to 1.07-1.08 suggests DXY can push at least a little higher.
  But, this is strong support for EURUSD, meaning DXY’s days may be numbered.
  RB is pretty clearly running out of steam…
 …while CL continues backtesting the white channel bottom. If it pushes through, it will have to contend with the red trend line at 54.65ish.
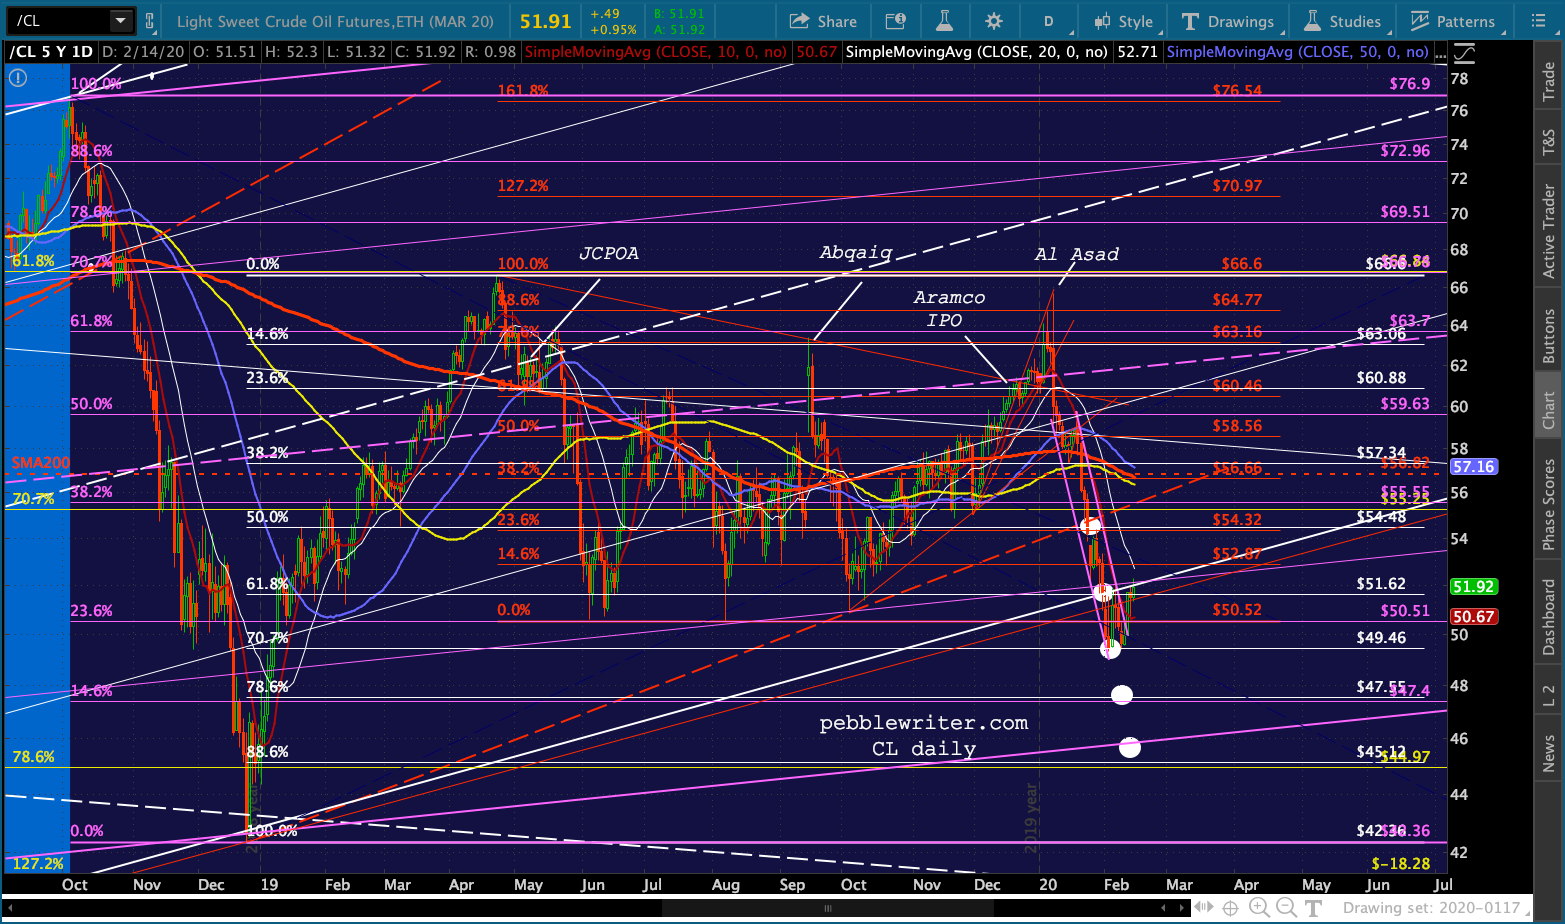 Remember, a breakdown below the white channel bottom – currently around 51.48 – would be hard on stocks. A breakdown below the purple channel bottom at 45.48 would be disastrous.
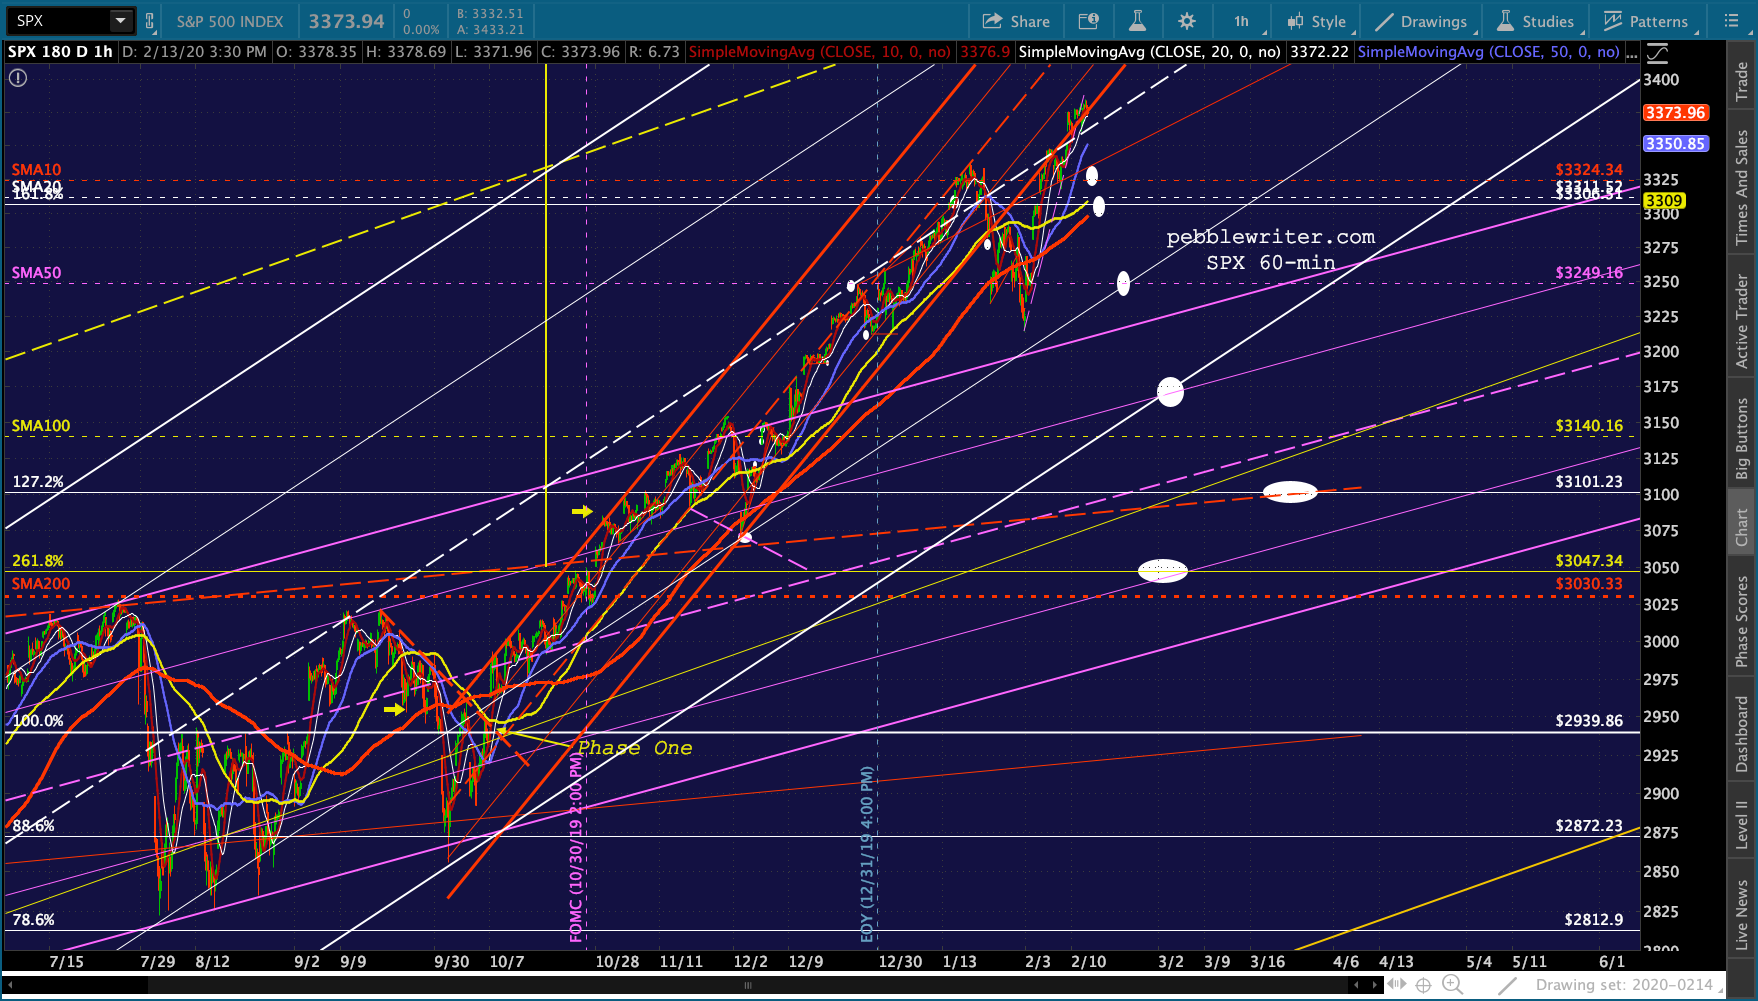
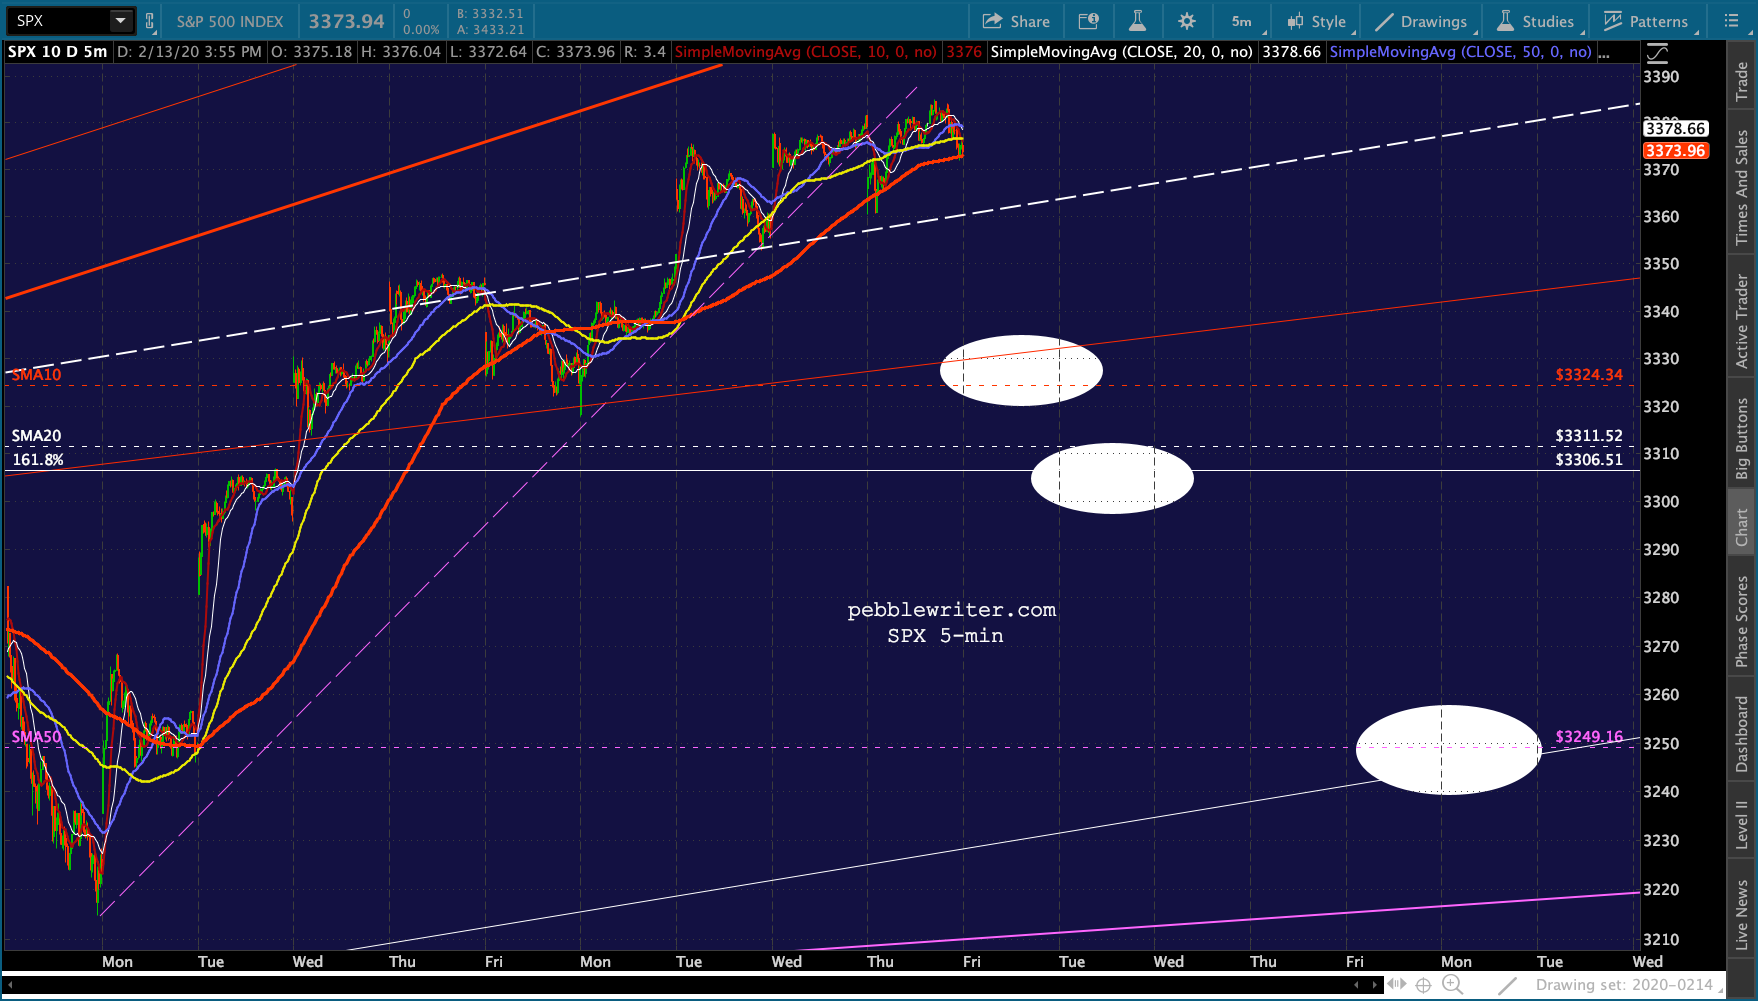
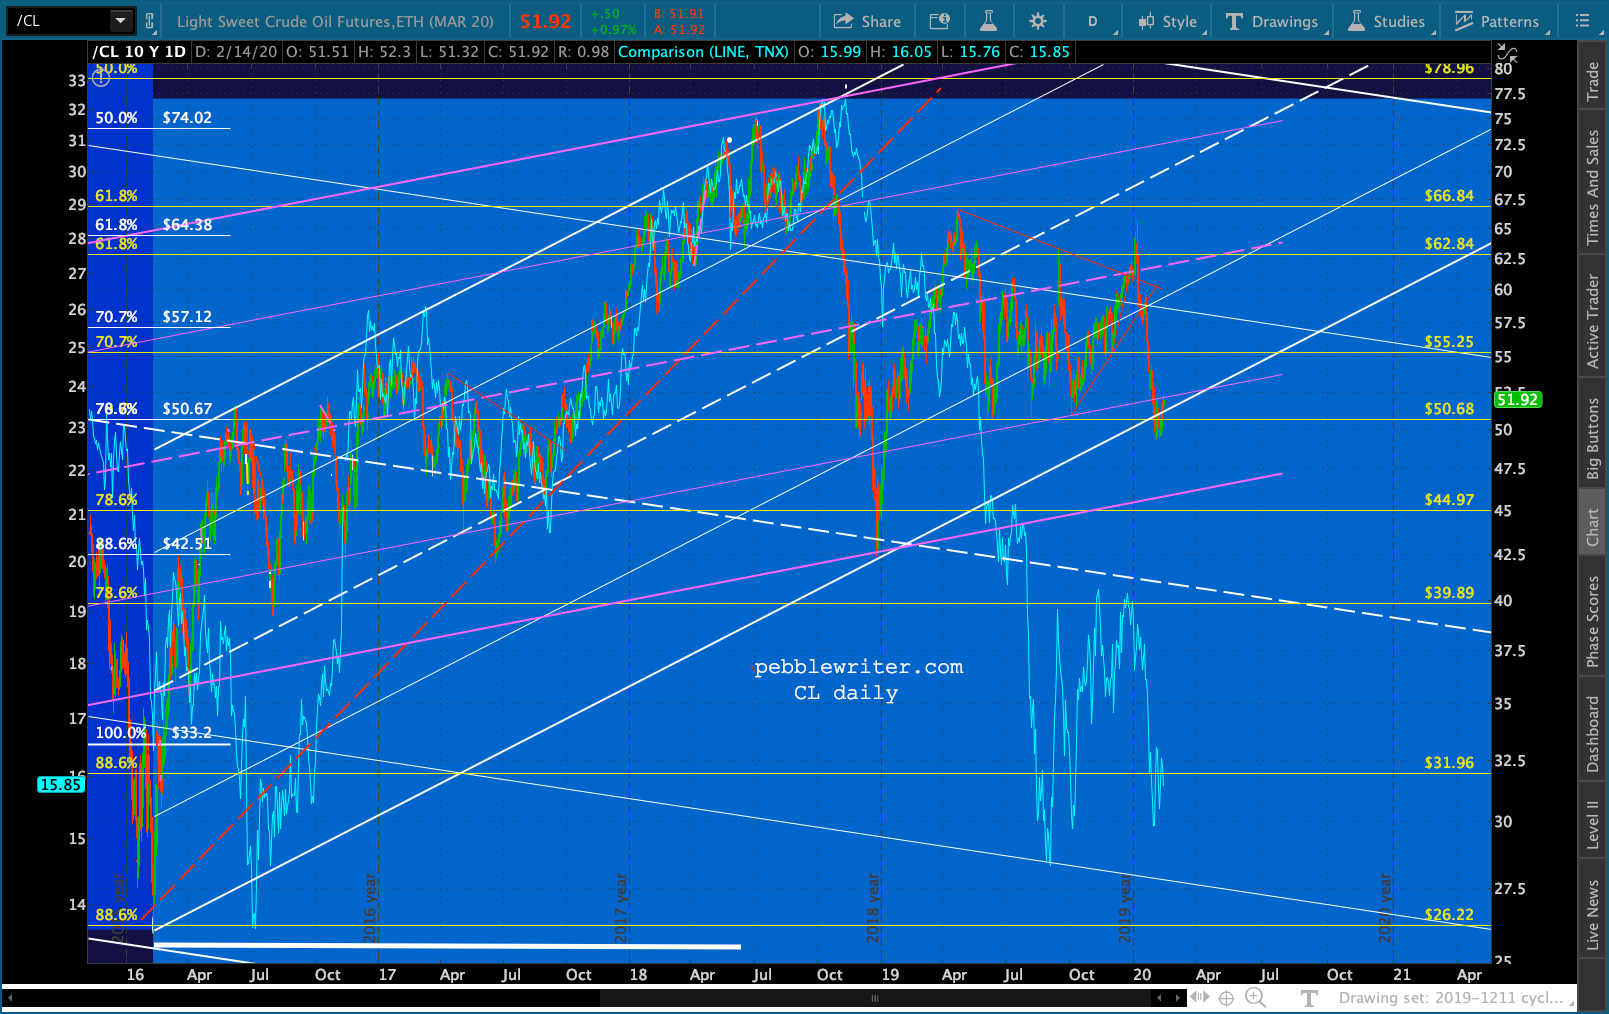 The big picture for stocks hasn’t changed. There are upside targets which have opened up as the result of “breakouts,” but IMO the breakouts are bogus. So, I’m expecting more downside, with ES’ SMA10 having reached the white 1.618 at 3336.49 and SPX’s SMA20 having reached its 1.618 at 3306.51.
Take your pick. My favorites remain ES 2728 and SPX 2703. But, there are lots of air pockets below those.

 The bond market is still propping up stocks, with the 2Y still above the important 1.4% support…
  …and the 2s10s in limbo.
  The 10Y should let loose soon.
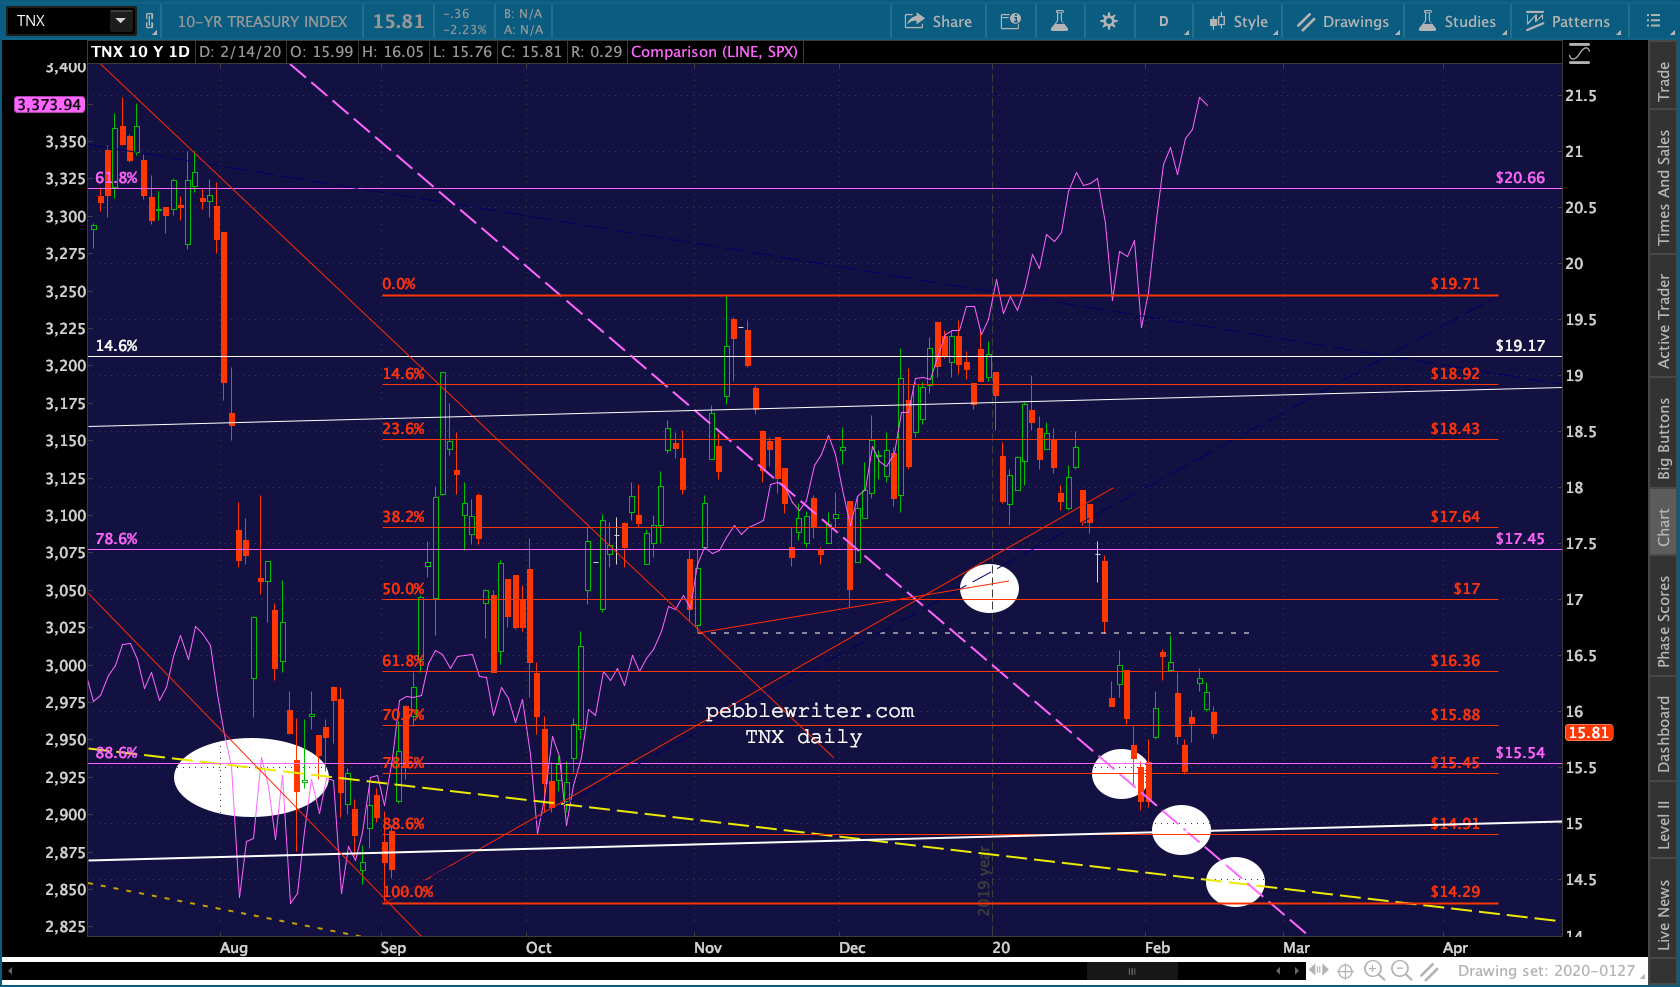
Bottom line, the bulls need quite a few maneuvers to work out just right in order to continue higher. The path of least resistance is now lower…potentially much lower.
Comments
2 responses to “A New Day, Same Old Nonsense”
Why does the market seem to have major turning points in March/1st quarter? The Nasdaq topped March 10th, 2000 and crashed. In 2009, the all three markets bottomed March 9th. What’s significant about March 9th and 10th? Hmm…
Sorry I didn’t notice this message sooner, Tim. Good question. There’s no correlation that I can see between Mar 9-10 and earnings season, FOMC meetings or OPEX. In 2016, SPX popped through the SMA200 on Mar 11 after recovering from the downturn which began Dec 30. In 2017, SPX shed 78 points between Mar 1-27. In 2018, SPX shed 249 points after its bounce topped out on Mar 13. And, in 2019 it dropped briefly back below its SMA200 on Mar 8 after that huge rally from the Dec 24 lows, then recovered and added 200+ points by May 1. We do usually get CPI/PPI around that time each month, which of course can have a big effect on bonds and currencies. Other than that, I’m at a loss.