That’s a relief! For months, pundits have been arguing whether the Fed needed to hike interest rates three times or four times this year — you know, because of all the growth coming down the pike.
Fed Über-Dove and “Man Who Thinks Market Integrity is Overrated” Jim Bullard just announced that the correct number is zero. That’s right. Everything is perfect just like it is.
Amazingly, and quite by coincidence, this pronouncement occurred on the exact same day that several stock market indices were in danger of falling below a very important technical level of support: their 200-day moving averages. As we discussed on Monday, falling below the SMA200 isn’t usually very healthy for markets.
For visitors and new members, this seems like a good time to take a walk down memory lane. This isn’t Mr Bullard’s first rodeo. Nor is it the first time “someone” did something clever to ensure the market’s continued ascent.
The S&P 500 illustrates the phenomenon quite well, having experienced a number of such fortunate events at crucial times.  October 2014 – Bullard!
Bullard appeared on Bloomberg to explain that another round of QE might be in order. As “luck” would have it, this enabled SPX to reverse right as it reached important Fibonacci support, ending a 9.9% tumble and narrowly averting an official correction.
Big assist from USDJPY, which soared 16% over the next 7 weeks in spite of the fact that more QE should have weakened the US dollar. The Yen Carry Trade in all its glory.
 August 2015 – USDJPY!
This 12.5% correction was set up by USDJPY falling back below a critical Fibonacci level (the .618 at 120.11) in the wake of SPX reaching a key Fibonacci extension (the 1.618 at 2138.)
We had correctly forecast the top [see: The Last Big Butterfly] but it was unclear whether or not USDJPY could remain above 120. SPX plummeted when 120 finally fell but, as “luck” would have it, was (temporarily) rescued by USDJPY’s bounce back above it.
 February 2016 – Oil!
The price of West Texas Intermediate Oil (CL) had fallen 77% between Aug 2013 and Feb 2016. While this crushed inflation to a manageable level, it made investors in and lenders to energy-related companies pretty nervous.
As “luck” would have it, CL bottomed out on Feb 11, 2016 — the exact same day that SPX reached that critical Fibonacci support level of 1823. CL doubled over the next four months, and SPX rebounded sharply. By accurately forecast the bottom in oil, we could confidently call a bottom for SPX [see: USDJPY Finally Relents.] June 2016 – USDJPY!
Stocks plunged in the wake of the Brexit vote. As “luck” would have it, USDJPY — which had used CL’s rally as an opportunity to reset — picked this particular day to bottom out and spiked 8% higher over the following month.
Futures had sold off by 6.5%, but by the time SPX opened the next morning the recovery was well underway. It was soon back above its recent highs and the critical 1.618 extension at 1.618. In other words: new all-time highs.
November 2016 – Trump*! Unfortunately for stocks, the US election results weren’t conducive to a rally. Once Trump’s election became apparent, futures plummeted over 5% in a matter of hours. SPX had bounced off its SMA200 a few days earlier. Unless something was done quickly, it would drop through this key support the following morning. As “luck” would have it, USDJPY picked this particular day to bottom out. It spiked 5% over the next few hours and 18% over the next few weeks — a supersized version of the exercise which had saved stocks post-Brexit.
And, if that weren’t enough, VIX — the widely accepted indicator of fear and volatility — plummeted even as futures were plunging. It’s the equivalent of calling your insurance broker to cancel your homeowner’s policy as a hurricane bears down on your beach house. How very, very “lucky” indeed. Futures recovered almost all of their losses by the time the cash market opened the following morning. VIX went on to shed over 50% of its value and broke down through trend line support (above, the white arrow.)
Stocks were soon registered new all-time highs. The talking heads called it the “Trump Rally” and attributed the gains to the incoming president’s pro-business orientation and deal-making acumen. But, I think it deserves an asterisk…on account of the incredible “luck” involved [see: Why the Trump Rally is a Fraud.]
The SPX chart isn’t labeled as such, but the rise from 2138 to 2703 (the next major Fib level) wouldn’t have been possible without continued support from oil and VIX. After doubling in value, CL proceeded to construct a well-formed rising channel (below, in purple) that was very supportive of stocks. It oscillated between the channel’s top and bottom like clockwork — until December 2017. We’ll come back to that. Also during that time, VIX was trying something new. After years of occasionally bouncing off the bottom of a long-term channel (below, the yellow arrows) it decided to plunge below that channel bottom and spend 80% of its subsequent days in the cellar — reaching new all-time lows in the process.
 This sent a strong all-clear signal to stocks (or, at least the algos that trigger stock purchases) that the coast was clear. It was completely safe to buy stocks, which they did — producing a rally that accelerated all the way up to the 2.24 extension at 2703.
December 2017 – Oil!
At that point, oil’s breakout (remember the purple channel above?) and the onslaught of new, daily lows in VIX combined to give SPX the boost it needed to climb above that resistance. I mean, how “lucky” can you get? It popped above 2703 and tacked on another 6.3% for good measure.
Unfortunately for stocks, though, there was a practical limit to how high CL could go without creating problems. Someone had forgotten that higher oil prices mean higher inflation. And, higher inflation means higher interest rates. And, when you’re $21 trillion in debt and pass a tax bill and budget that greatly widen the deficit considerably…higher interest rates are not exactly lucky [see: Why Higher Interest Rates Are a Problem This Time.]
Between that realization and a growing disconnect between price and supply & demand, CL had to drop. When it did, and the (dashed, red) trend line from August 2017 finally broke down, stocks didn’t take it well. SPX plunged almost 12% over the next two weeks, one of the sharpest corrections ever. Luckily, the SMA200 was there to catch it. A few days later, CL popped back above its channel top and SPX recovered to back above 2703.
As the bounce began to fade, we had a surprise message from Bullard that “too many rate hikes could slow the economy.” It was enough to extend SPX’s bounce for another few weeks. But, ultimately it slipped back down below 2703 to tag its SMA200 again. And, again. And, again. And, again.
By then, DJIA and RUT had finally risen to the point where they could tag their SMA200s as well. SPX bounced at our 2561 target. Investors were in luck! Until this morning.
April 2018 – Bullard!
Apparently, someone forgot to explain to the Chinese that we were supposed to win the trade war (winning them is easy!) This morning, we found out that China had the gall to fight back. When I was woken by an price alert at 3:15 this morning, the futures were off 55 points. SPX would open back below its SMA200.
But, the futures didn’t know what they were up against!
 Then came Larry Kudlow, the guy who in May 2008 called the impending Great Financial Crisis a “non-recession recession.” Some people might have misunderstood; but, obviously he meant it would be much worse than a recession. (I can’t wait to find the pot of gold!)
 As “luck” would have it, the market was quite pleased with all this positive scuttlebutt. ES, once down 55 points, closed up 34 points. SPX and the Dow rose about 1%. RUT added 1.30%. And, COMP — which never did tag its SMA200 — popped 1.45%. Take that, 200-day moving average!
 Bounces are nice, whether driven by oil, the USDJPY or Fed cheerleaders. This one got SPX back above its SMA200, which is a good start. Next comes the 2.24 Fib, which SPX has crossed some twenty times in the past two months. Can it rise back above and stay there this time?
Oil’s limitations haven’t disappeared. Managing inflation and interest rate expectations will continue to dominate its price action. Lately, the market has a very narrow range within which it feels comfortable.
USJDPY is threatening to break out from a falling flag pattern, but one has to wonder why it hasn’t done so already. Japan got no love from Trump in the trade war chatter to date. It’s quite possible they’re done cooperating with currency intervention. VIX, after popping back above the yellow channel bottom in dramatic fashion in February, has fallen back to a trend line (red, dashed) from its January lows. Every time it pops above the trend line, SPX stumbles. Every time it drops below it, SPX rips.
  Today, it tagged it and reversed lower – hence the day’s gains. It has plenty of additional downside potential, with the potential to drive stocks back above 2700. But, again, it hasn’t done so yet.
It makes one wonder whether SPX will be allowed to put in a lower low in order to make the corrective wave look a little more conventional and give COMP a shot at its SMA200. We have oodles and oodles of downside targets if SPX’s SMA200 should fail. That white dot at 2138 in the chart above is there for a reason [see: More Where That Came From.]
There are countless other factors I haven’t even mentioned: our yield curve model (which tentatively turned bullish today), 10yr note rates, the US dollar’s buoyancy, various momentum indicators, and the continuing sagas of FB, TSLA, AMZN and DB — all of which have played a role in the market’s gyrations (mostly of the bad luck variety.)
Whatever happens, it’s hard to imagine we could reach new highs without plenty more luck. Trade safe, and stay tuned.


 Do what I did and google “Japan” and “economy” for the past month and you’ll see nothing but negative stories including this one which confirms a “worsening economy” even before the effects of the recent 25% increase in the consumption tax have been absorbed.
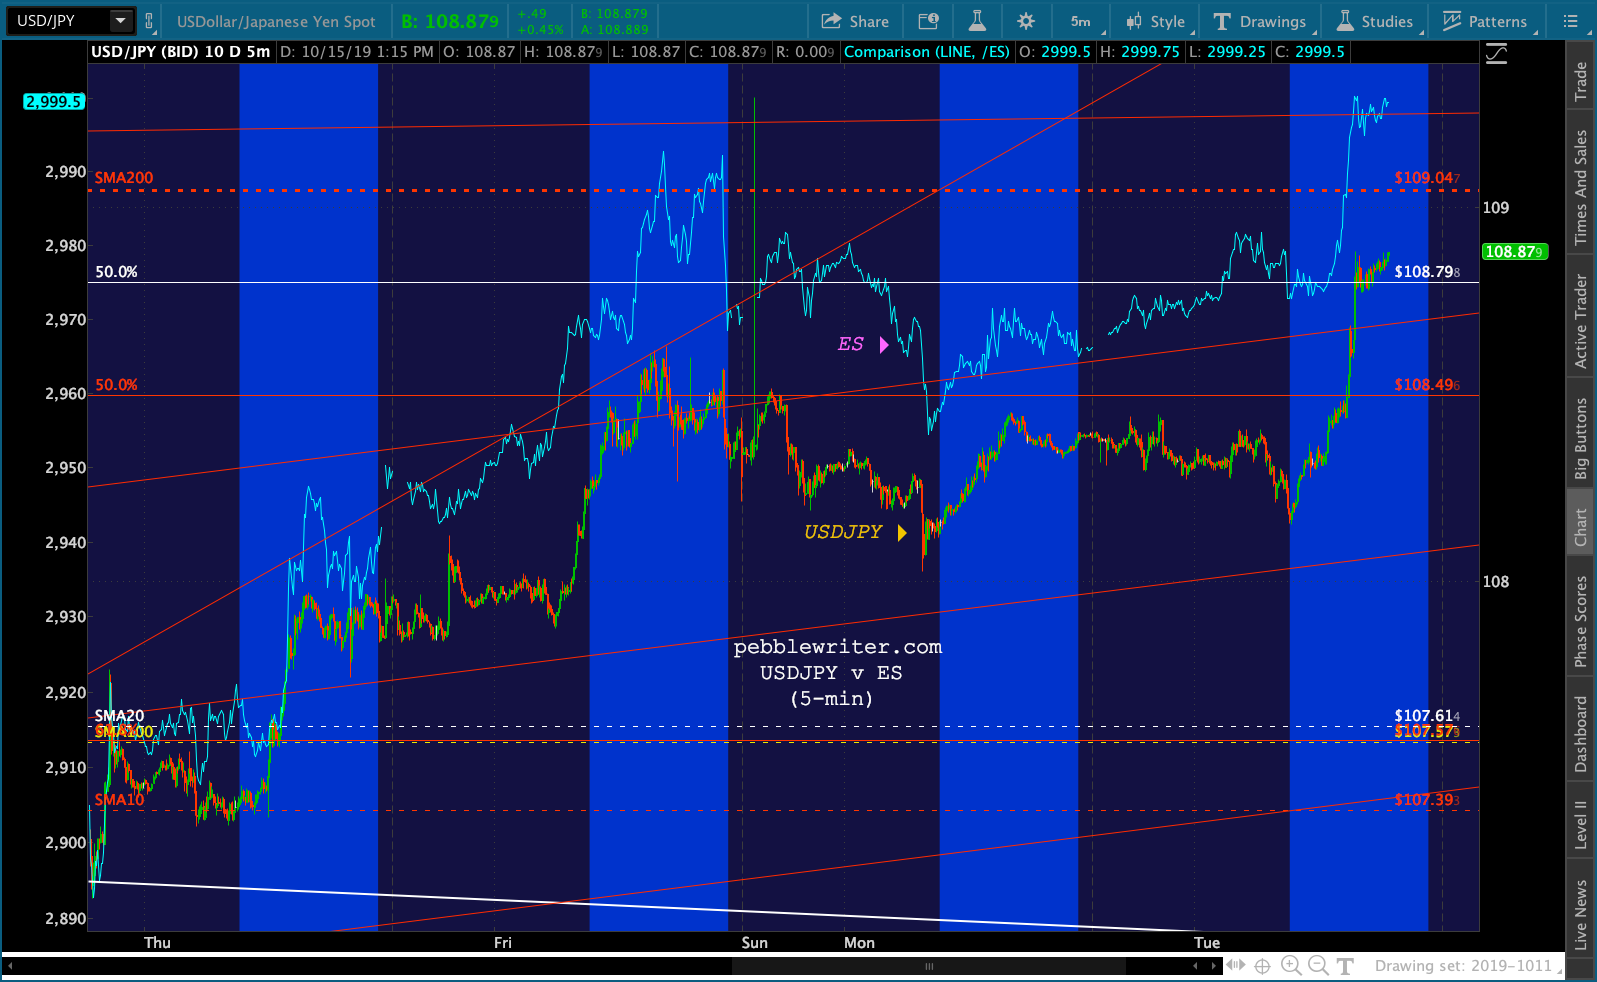
 The Fed has its own trading desk, presumably with the ability to dabble in the futures market. Their cost of funds is essentially zero as they can print money any time they like. Imagine how fun it will be when interest rates go negative and investors pay them to drive stock prices higher.