Companies and individuals alike are cutting back their activities as the omicron outbreak continues to accelerate. Many companies, short of employees, supplies, or customers are raising pay, trimming back hours or cutting product offerings in order to stay afloat. Individuals are cutting back their activities in order to stay healthy.
Though not official, the shutdown is real and is spreading, complicating the Fed’s already arduous task of reversing runaway price inflation. Woefully behind the inflationary curve, the Fed is leery of tipping the economy into stagflation and even more leery of tripping up the stock market. With that as a background, we’ll take a look back at 2021 and what to expect in 2022.
The Bear Case
As we’ve discussed many times over the past year, the market has responded positively to the prospect of reinflation. Stocks rally, for instance, when oil and gas prices rise – a sign of increased economic activity. But, the rally in oil and gas prices finally went too far, turning what might have been narrowly-focused, transitory inflation into widespread, persistent inflation which has permeated the labor market – the most sticky category of all. Inflation won’t subside unless the oil and gas rally at least flatlines – a negative for stocks.
The falling US dollar has likewise benefited stocks, but contributed to the spike in inflation as imports became pricier. DXY’s bounce off its May 2021 lows has been tentative, barely reaching the halfway mark of its drop from its March 2020 highs. Lower inflation will require the dollar to strengthen – a negative for stocks.
Historically low interest rates have obviously contributed to the market’s success over the past year. Companies and (some) individuals can borrow more cheaply, leveraging existing revenue streams into higher profitability. The present value of a future stream of income is worth more. And, perhaps most importantly, funds which might have been invested into bonds have landed instead in equities. If rates increase, as the Fed suggests they will, this would also be a negative for stocks.
Obviously, reflation wasn’t the only factor in last year’s rally. The Fed poured $8.7 trillion into markets between March 2020 and December 2021, reinflating bubbles in stocks and commodities and essentially destroying price discovery in the bond market. If the Fed sticks to its accelerated tapering schedule, that assistance will grind to a halt in March 2022 – an enormous negative for stocks.
The Bull Case
Even as it tapers, however, the Fed is still slated to pump a few hundred billion into markets by March 2022. No one would be shocked to see the taper schedule adjusted if, say, COVID continued to accelerate and economic activity the stock market took a major hit.
How and when the Fed “invests” those funds before the music finally stops could still exert a great deal of influence on markets. By periodically swooping in to hammer interest rates, manipulate currencies, or crush vol, the Fed still has the ability to influence markets. Algos are usually only too happy to play follow the leader.
Then, there’s the issue of the narrative. Although its reputation is somewhat impugned, the Fed’s utterances still carry weight. Consider how many months it took for the financial press to finally question the Fed’s “transitory inflation” fairy tale. Even with CPI at 6.8%, you still hear the word bandied about.
Fundamentally, many corporations have taken advantage of the Fed’s largesse to improve their balance sheets – retiring debt with lower priced borrowings or generous equity offerings. To the extent the economy is able to continue humming along, many also enjoy pricing power which will give them at least a fighting chance to keep up with inflation.
And, unless rates rise very sharply, stock repurchases will continue to be a major driver of rising stock prices. Companies no longer seem to care about appearances, tying purchases to tests of important price levels – an activity which used to be considered price manipulation.
There will be winners and losers, of course, with the largest and best capitalized companies continuing to attract the lion’s share of investment, even at nosebleed valuations in the absence of profits. Stay-at-home stocks will remain vulnerable to sharp downdrafts following positive COVID news and sharp rallies in response to negative COVID news. Should the pandemic eventually pass and markets balance themselves out, reopening stocks might even grow into their overinflated valuations.
The Verdict
Instead of one case or the other proving out, I see a strong possibility that both come to fruition. As we’ve discussed, inflation is a math problem. CPI is only 6.8% because of strong YoY increases in prices. If already elevated prices were to stabilize at present levels, it would hurt those already suffering from cash flow issues, but CPI would drop sharply as YoY price comparisons slid back toward a more acceptable 2-3%.
Once CPI reaches that range, the impetus for higher rates would be eliminated. This is the scenario the Fed was hoping for when first touting the transitory story. They either miscalculated badly or decided that prospective market gains justified consumers’ pain.
Of course, there’s another way rates could be contained, albeit one that involves a little short-term pain for longer-term gain. When equities sell off sharply, interest rates tend to plunge as well. A substantial equity correction triggered by a sharp drop in oil/gas prices and spike in the US dollar would knock inflation and interest rates back in a hurry.
If prices were to then stabilize and then resume a gradual increase with CPI and the 10Y in the 90 bps – 1.5% range, we’d again have a very constructive environment for equities. We came very close to this scenario unfolding several times over the past year.
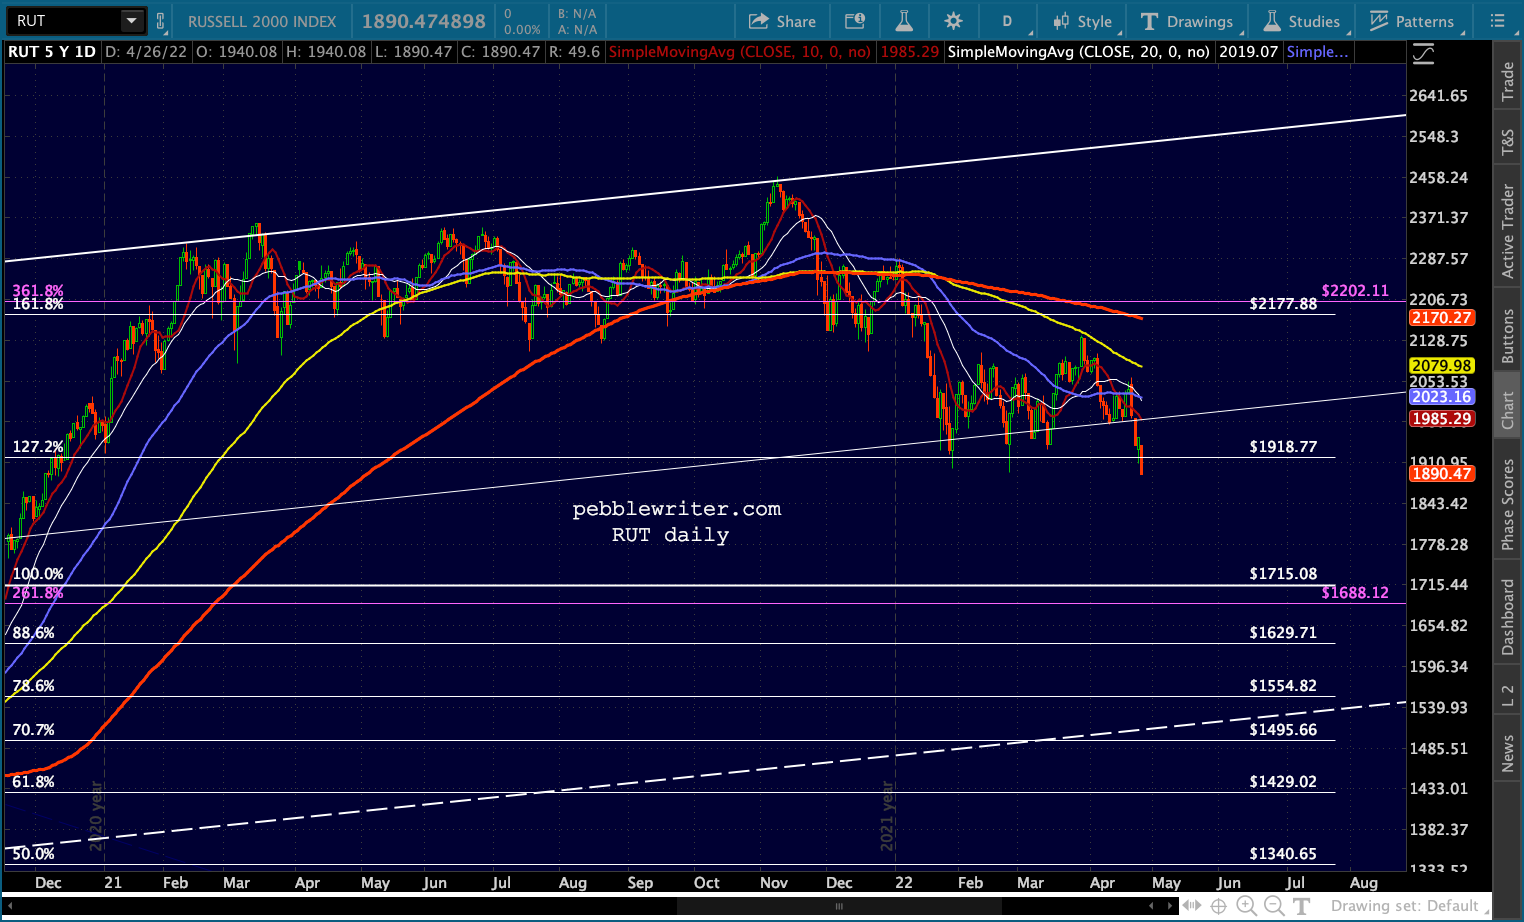
Since June 2020, potential corrections have been halted 12 times by the 50-day moving average, 7 times by the 100-day moving average, and twice by the 200-day moving average.  There was only one significant lower low during that period – the Sep 20 – Oct 1 Head and Shoulders pattern slump that produced a whopping (sarc) 6.3% drop that was erased within 3 weeks. Had the pattern played out normally, it would have resulted in a 20% drop and the backtest of a major Fibonacci level.
 However, it would also have required a drop below the 200-day moving average – an unacceptably bearish development in Chartland. Instead, VIX was hammered by 50% and WTI and USDJPY made new highs. Algos responded and the bearish pattern was promptly busted.
Interestingly, SPX/ES face another similar opportunity. But, things are different this time.
continued for members… (more…)


 It’s not unusual for BTC to overshoot important support. And, this .618 Fib level is theoretically important support. But, it’s also important to remember that a bounce is sometimes just a backtest of newly formed resistance before another leg down.