

In our last update [see: Nov 30, 2021 Update on RUT] we noted that RUT had fallen by over 10% and dropped below its 200-day moving average – both bearish developments.
Yet, it had bounced repeatedly at a key Fibonacci level, the 1.618 extension at 2177.88. By repeatedly, I mean seven separate times where it dropped below 2177.88, then recovered back above it. To complicate things, it had closed that day just above another important Fibonacci support level at 2202.11.  In the end, we left members with the simple advice:
If it drops through 2177, then I’d get short with tight stops muy pronto with a new target of 1918.77 (a 22% drop.) Otherwise, watch out for head fakes.
It should come as no surprise that RUT did eventually break down and reach 1918.77, but only after criss-crossing 2177 eighteen more times and rallying 9% into the end of the year. How’s that for headfakery?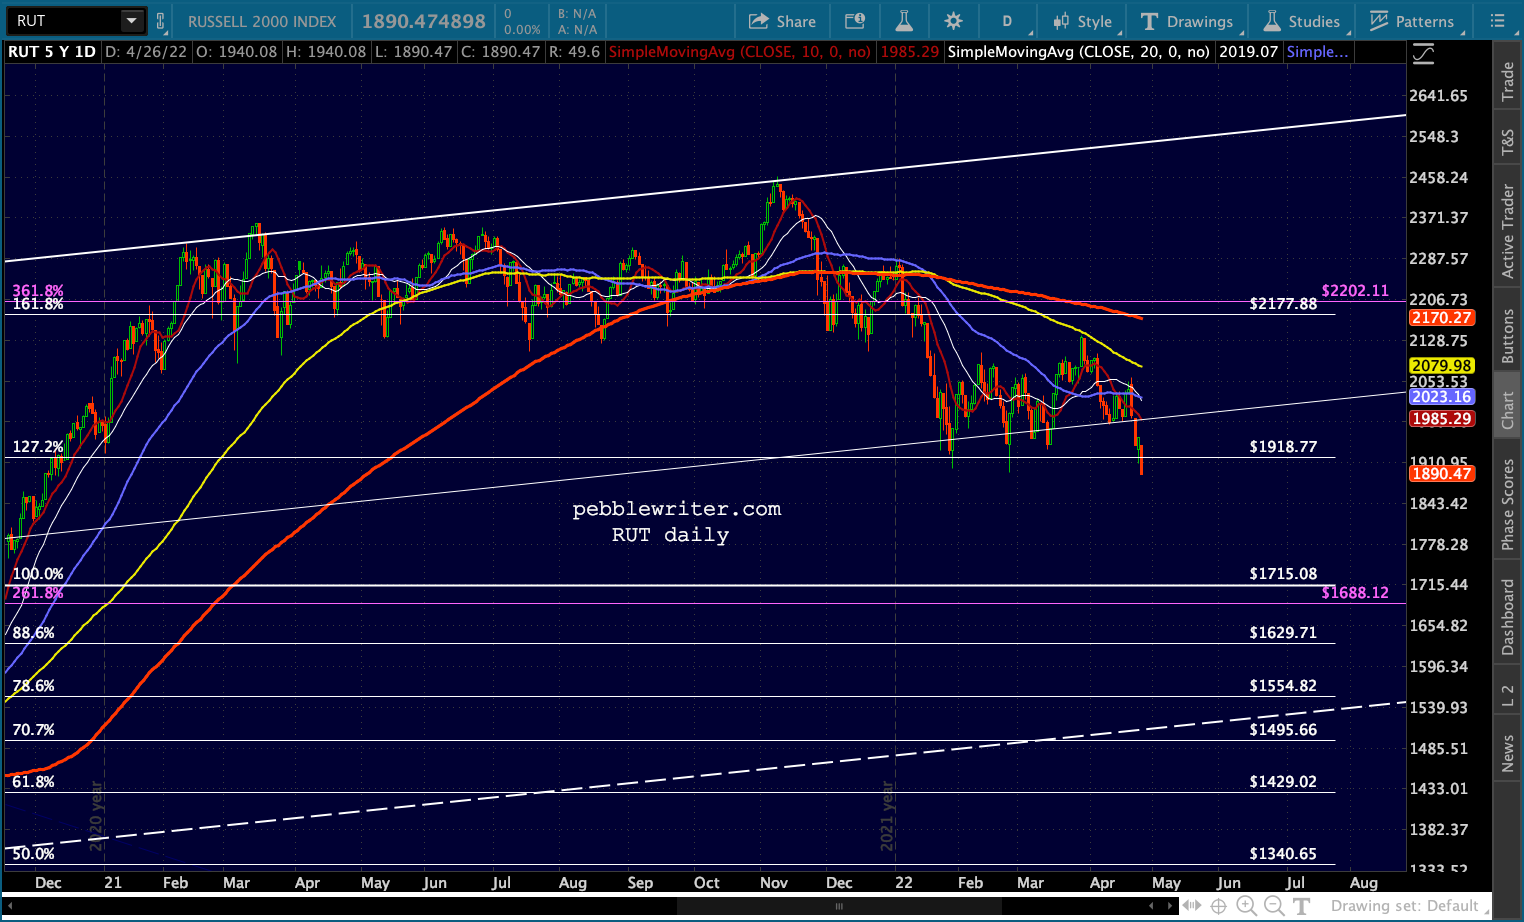 RUT has now tested its new best friend 1918.77 over and over and over again. Its latest tag occurred earlier today. It closed at 1890.47, within 0.5% of its two previous cycle lows.
Now what?
continued for members…Frankly, I consider this a lousy setup. Given its history, RUT could bounce at 1918 another dozen times over many months before heading further south. Or, it could plunge the next 200 points in the next couple of days.
When dropping through 2177, it took nearly a year and didn’t happen until the SMA200 had reached 2250. While this is arguably a different market than then, is it really worth the aggravation when there are other, more appealing setups out there for traders? I think not.
Having said that, I’ll venture a guess just for the heck of it. Remember RUT is in a fairly well-formed rising white channel whose midpoint is way down at 1510ish. 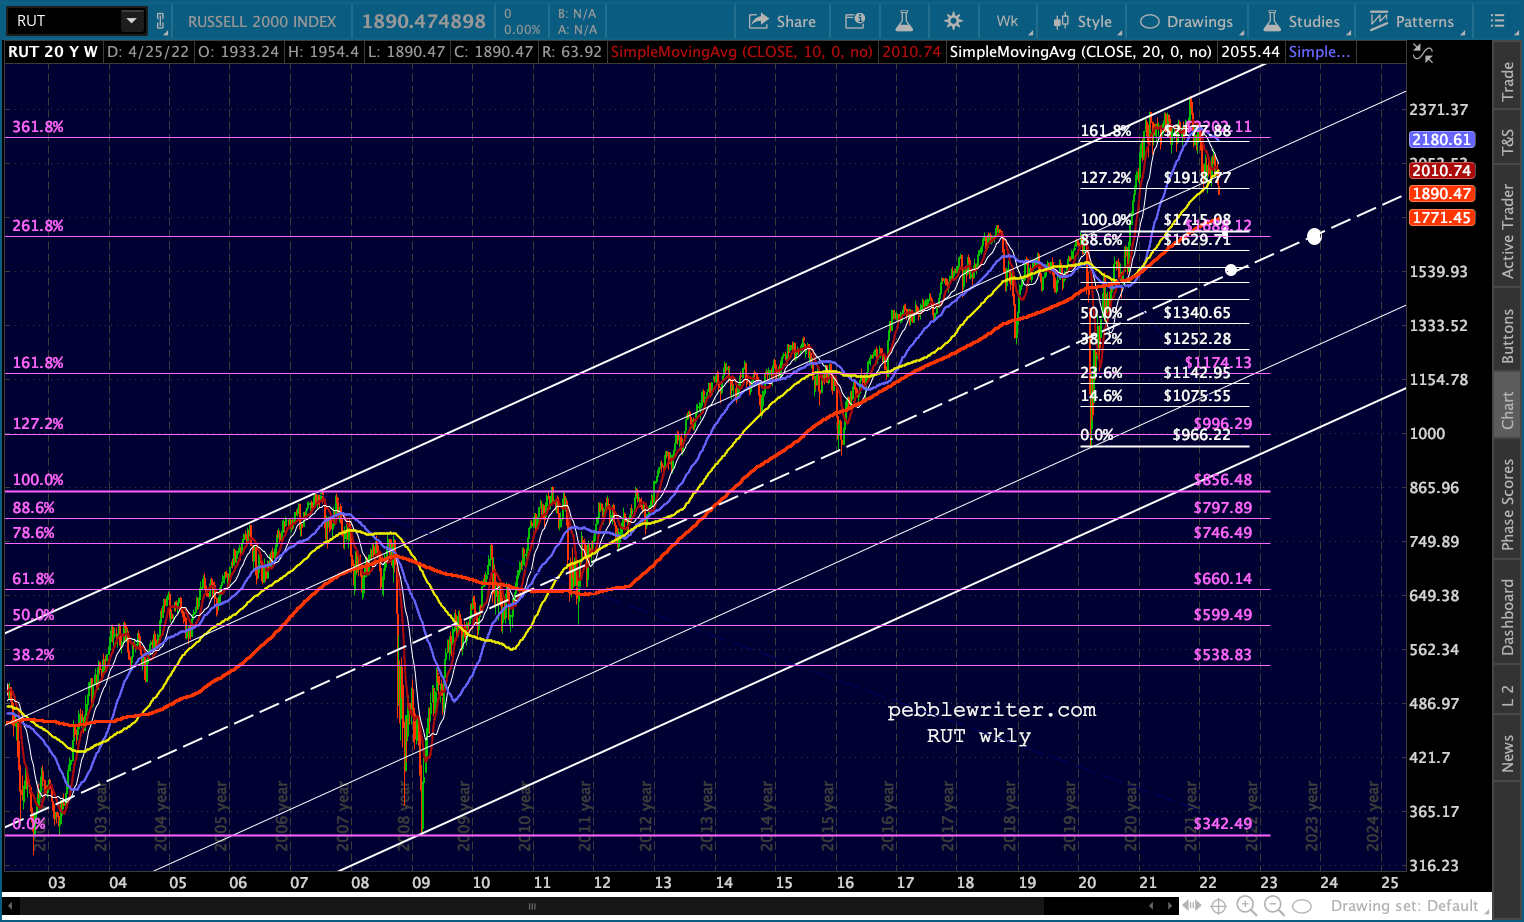
Since there are no Fibs at that level, odds are the drop (if it occurs) would be either to the Feb 2020 high at 1715 or the .786 at 1554.82.
If it waited until Aug-Sep 2022 it could tag the midline at the same time. But, again, this is a very unreliable setup – practically a coin toss from a charting standpoint.
GLTA.