

RUT’s chart reminds me of the old country and western song: “How Can I Miss You When You Won’t Go Away?”
The Russell 2000 is down over 10% today, so it’s technically in a correction. Some of its individual components have really taken it on the chin. And, it’s fallen below its 200-DMA, which is typically bearish. Seems like a sure fire shorting opportunity, right?
 Not so fast. RUT has fallen over 10% three previous times over the past 21 months, recovering each time to or near its former highs. The most recent peak represented new all-time highs.
How long can this go on? And, what does an Italian mathematician have to do with it?
continued for members…Going down the rabbit hole of intentional stick saves, we can see that RUT has benefited greatly by some Fibonacci patterns generated by both the 2007-2009 crash and the 2020 crash. The purple 3.618…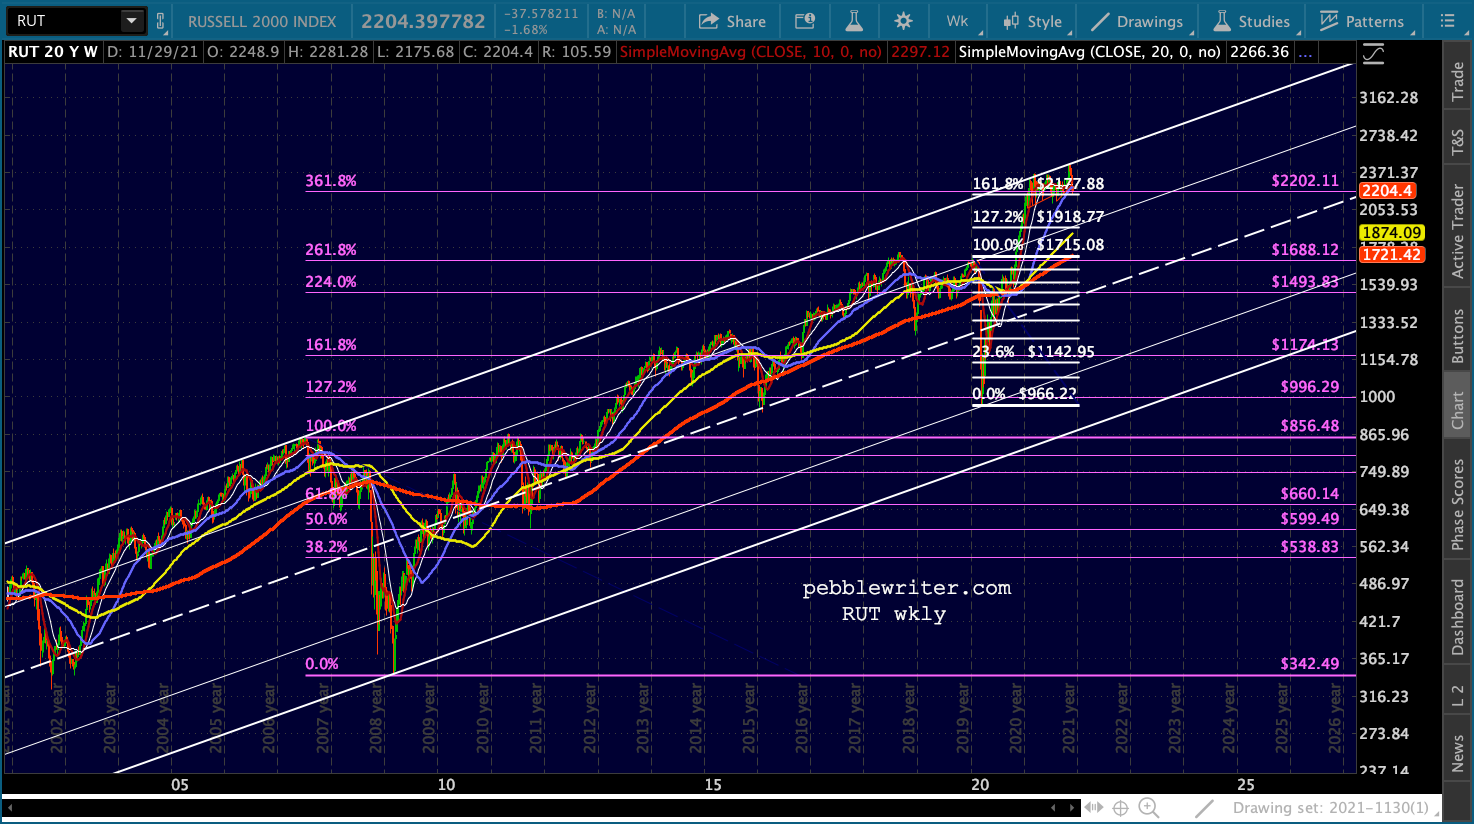 …and the white 1.618 have both held up – at least so far.
 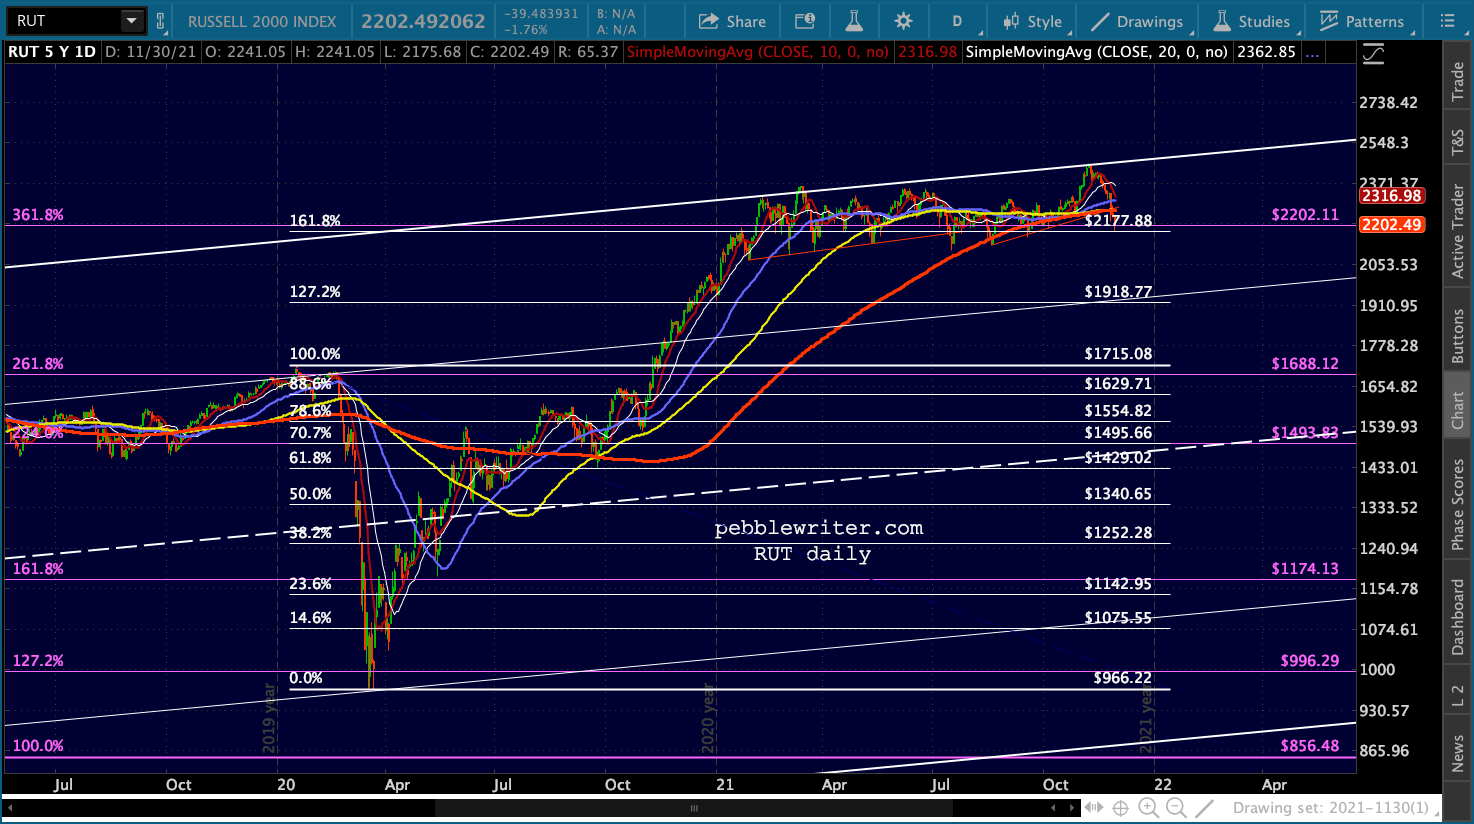 It it drops through 2177, then I’d get short with tight stops muy pronto. with a new target of 1918.77 (a 22% drop.) Otherwise, watch out for head fakes.