

Today is a very important day in the markets. The signals that prompted us to short on several days ago are still intact, and more have joined their ranks – the most notable being the breakdown in the 10Y flag pattern.
 ES snuck down and tagged our SMA200 target overnight. To put things simply: If it doesn’t hold, all hell will break loose.
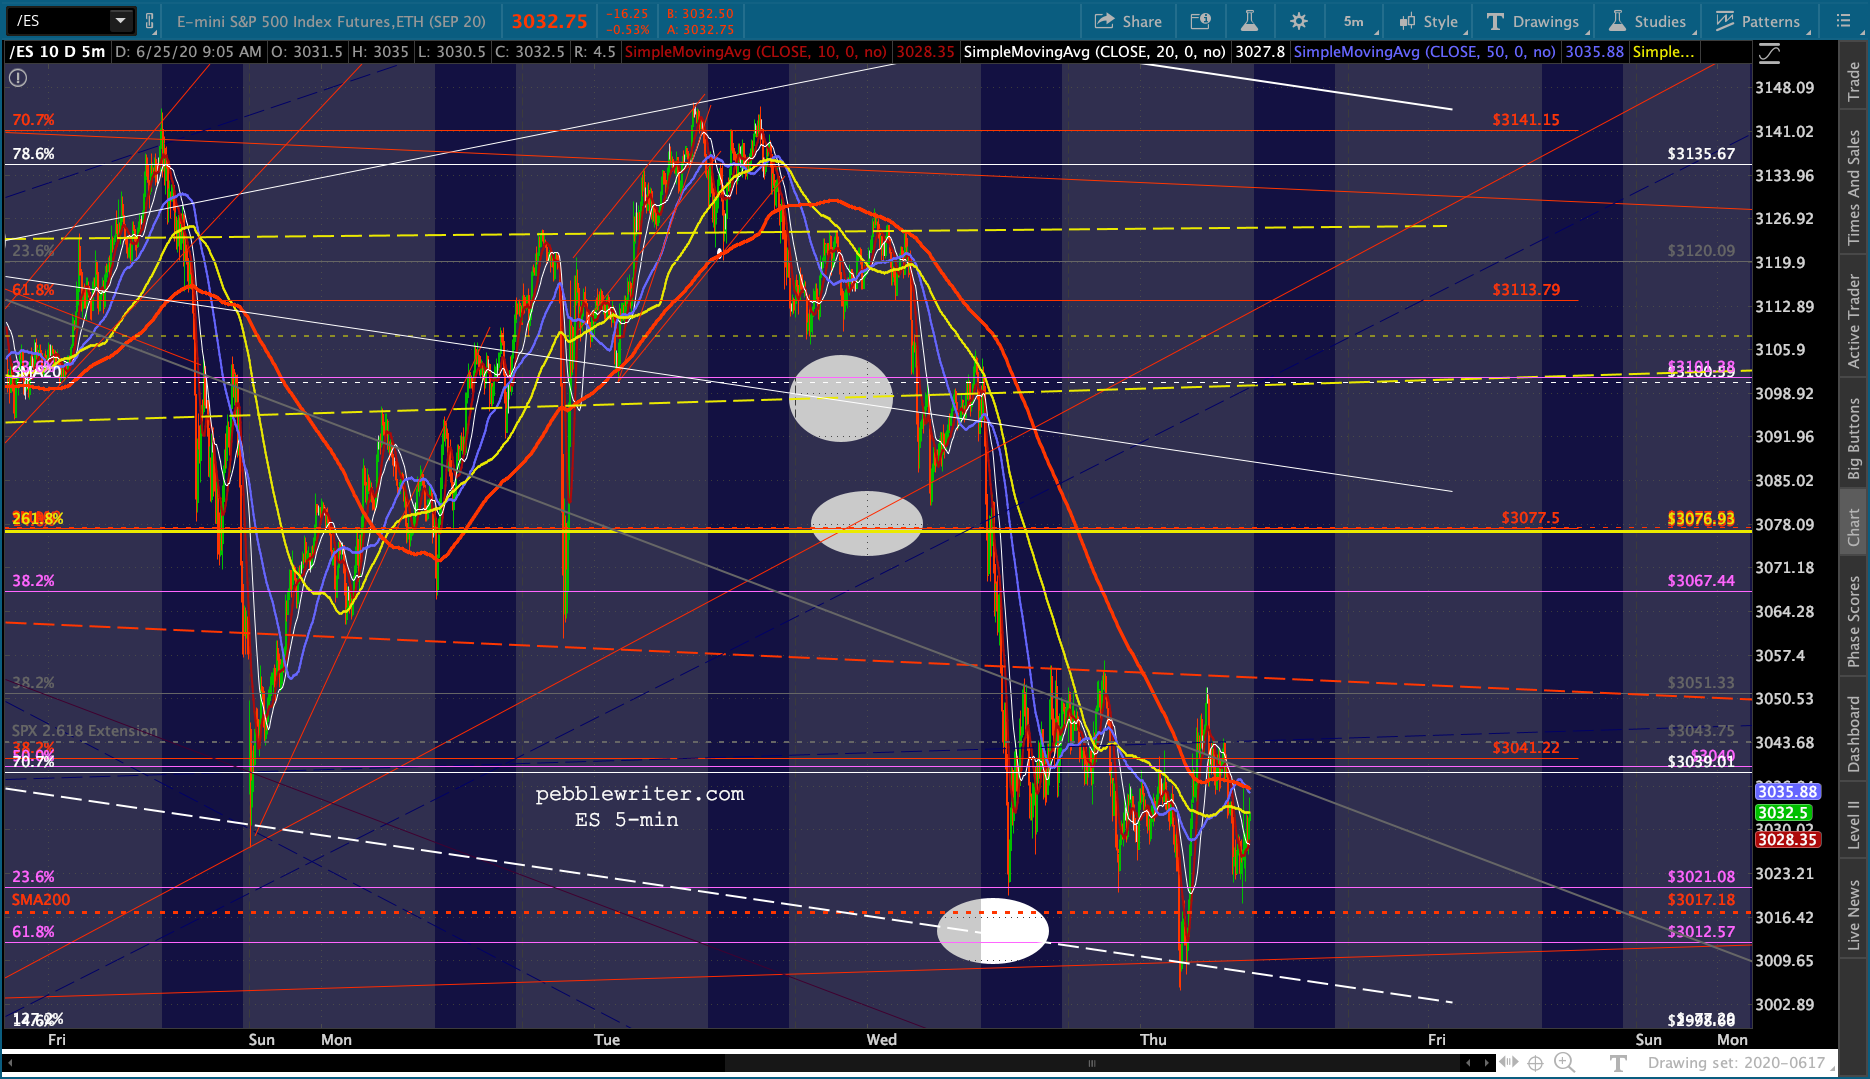 There are any number of fundamental reasons for the market to tank, including the spikes in coronavirus cases in many states. Some governors, such as Texas’ Abbott, are even copping to how disastrous the situation has become.
 Working to prevent a meltdown, of course, are the algo strategies which have been so effective since Mar 23. It should be an interesting next few days.
continued for members…
The bigger picture for ES and SPX:


 VIX could theoretically still right this listing ship.
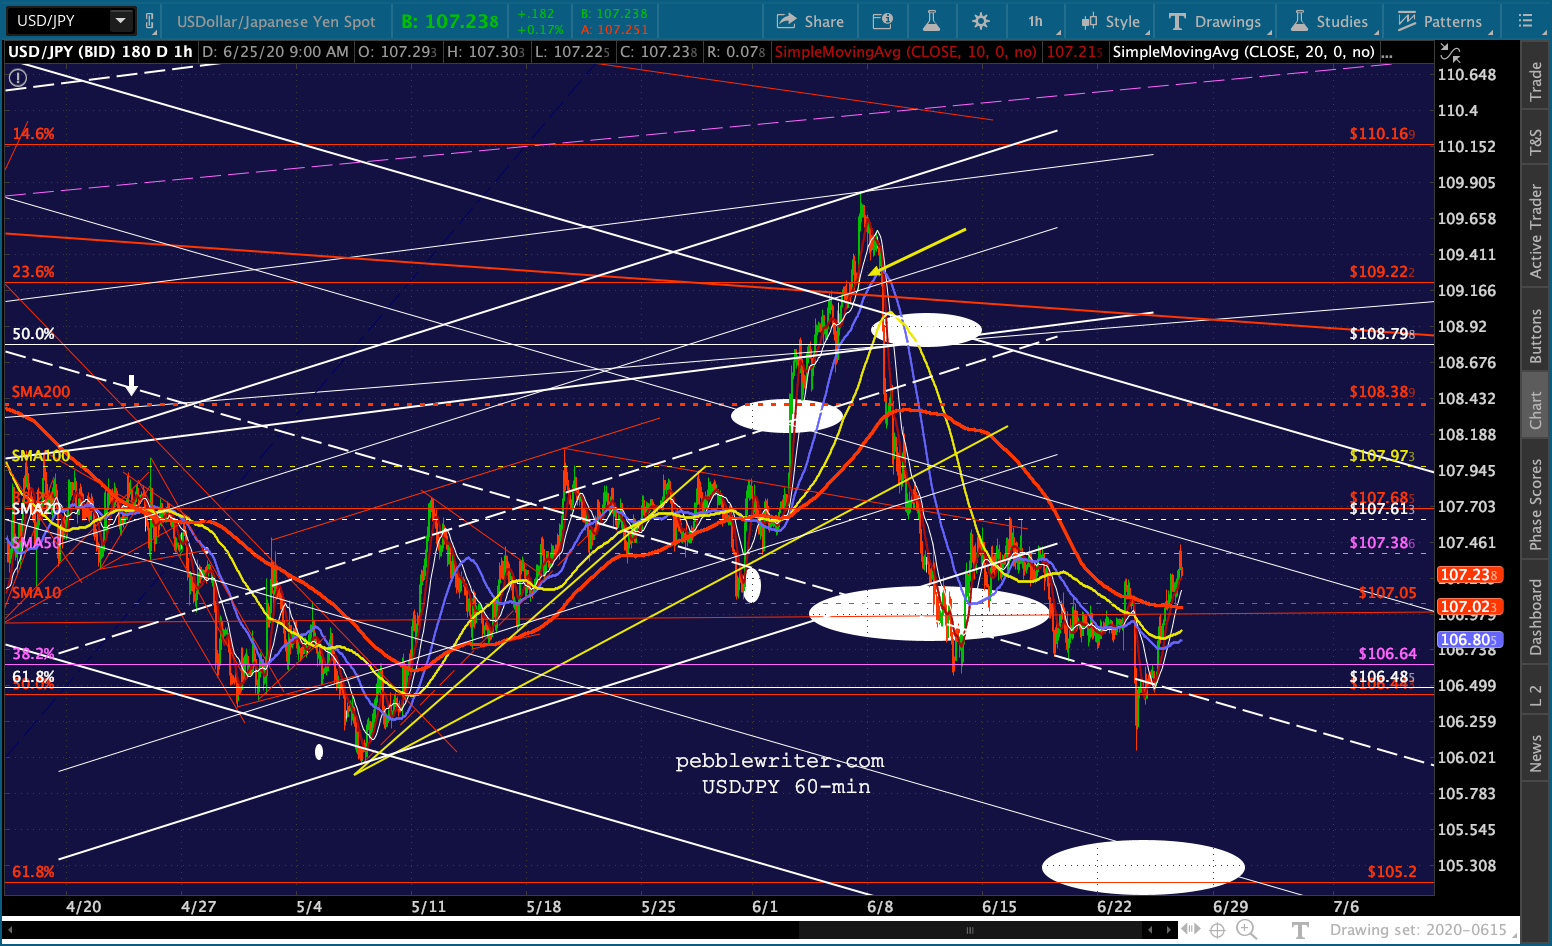
 USDJPY is also giving it a go.
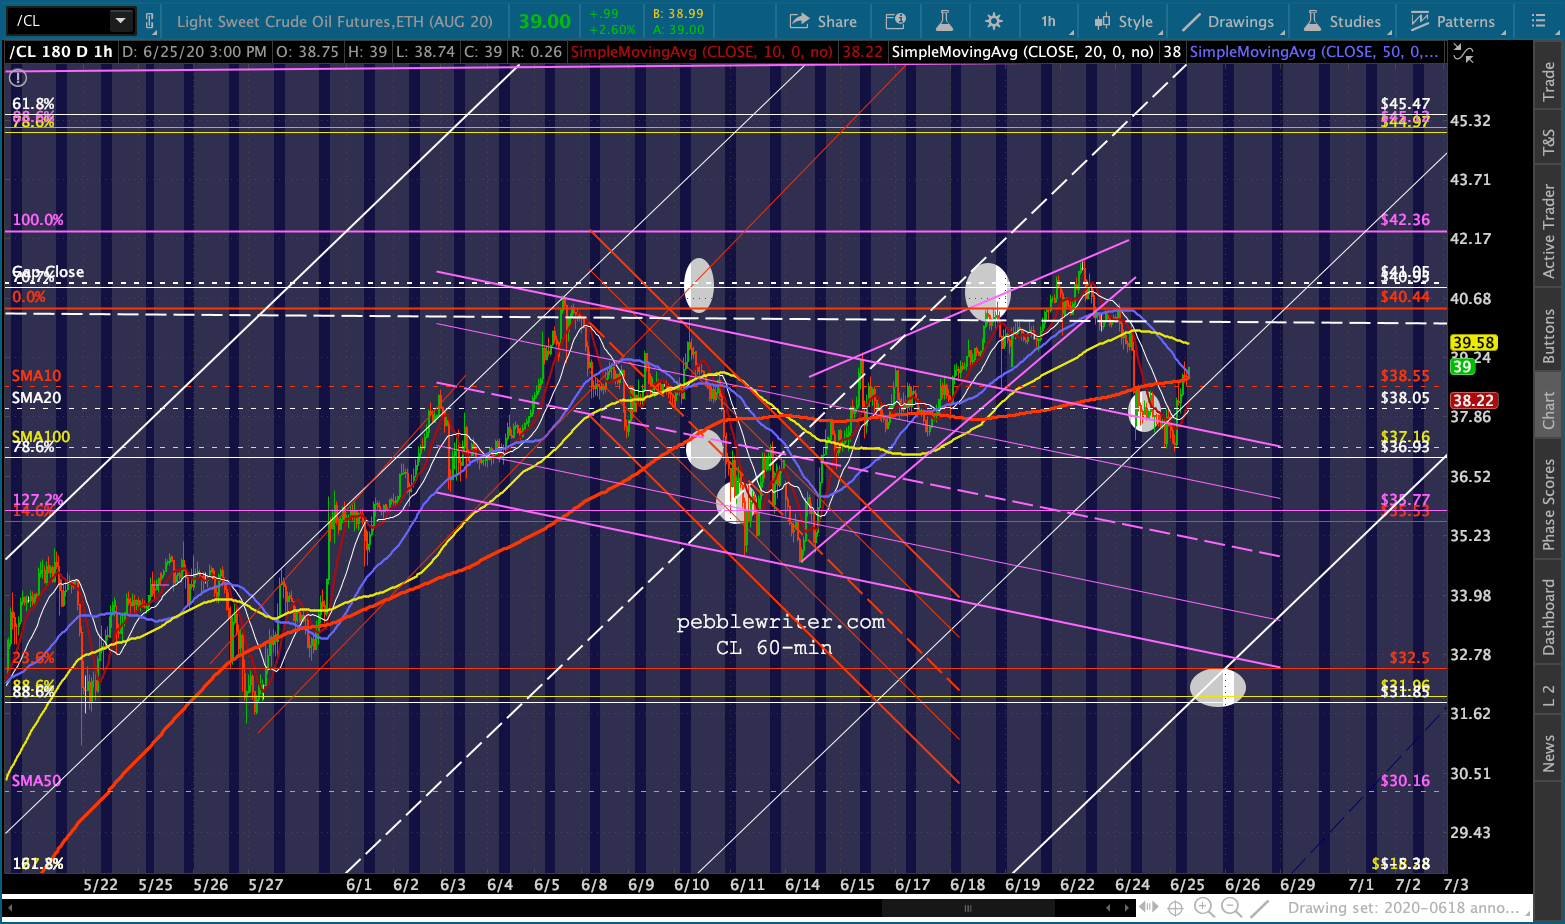
 CL could rebound off its SMA100 and channel backtest. But, if it doesn’t, it’s a long way down to support.
 Much will also depend on getting the 10Y back above 70 bps. As it is, the 2s10s has again dropped back below TL support – bearish for stocks.

 The Dow still looks quite sickly.
  And, COMP isn’t looking all that healthy following the drop back below the white 2.24.
 AAPL seems likely to test the important red 2.24 at 346.89 – also the scene of its rising SMA20. Note that it hasn’t even touched the SMA20 since gapping above it on Apr 6.
 Last, the EURUSD has reached its moment of truth – the potential golden cross where the SMA50 rises above the SMA200.
 A sharp drop here would mean a pop in DXY, which would suggest additional equity downside.
  Keep an eye on SPX 3020.38. More later…
UPDATE: 3:25 PM
Close, but not quite a tag for SPX on its SMA200. This has happened a couple of times before over the past year. It doesn’t necessarily mean we won’t get another attempt tomorrow, but the odds of another attempt before the end of the quarter decline daily.
Thought we’re getting a nice bounce, note that all the 10/20 crosses are still aligned bearishly, the 10Y has still broken down, and the headlines keep getting worse.

 I’ve inserted a vertical line in the SPX chart depicting the end of the Q2. Note that it connects both the bottom of the falling white channel at 2848 and the white .886 at 3256. It’s quite a range, but we’d have plenty of warning signs if the upside case is to play out: breaking back above the SMA10, 20 and 50, breaking out of the falling white channel, VIX breaking down, CL making new highs, USDJPY pushing back above the SMA50 and channel line at 107.40, etc.

 We would also probably see TNX pop back into the purple flag pattern at about 6.90ish.
 More later…
UPDATE: 5:20 PM
VIX has dropped 14.5% since yesterday’s highs. The result: a 1.10% gain in SPX. It just goes to show the lengths to which the algos will go to prop up stocks.

 ES rallied sharply into the close, but ended up right at its 2.618 Fib extension – what would normally be strong resistance. Doubtful it would stand up to another 15% crash in VIX, the kind we’ve seen many times before in such circumstances.
After the close, we got news that the CCAR stress tests dictated a freeze on banks increasing dividends or buying back shares. This, combined with negative assessments of the economy by several Fed governors, could weigh on shares.
However, tomorrow is one of the biggest POMO days coming down the pike – not a coincidence and often a bullish factor.

Again, the next few sessions should be very interesting.