

Futures tested the important 2.618 Fib extension four times since yesterday’s close, bailing on the upper bound of a rising wedge with the last tag. This is a bearish pattern which, combined with numerous other bearish charts, still signals elevated risk.
 But, we’ve been beating that drum for a while. Today, I’ll focus on the bond market which continues to send its own signals of potential downside ahead. After an extended bounce, the 10Y broke trend ever so slightly just yesterday.
 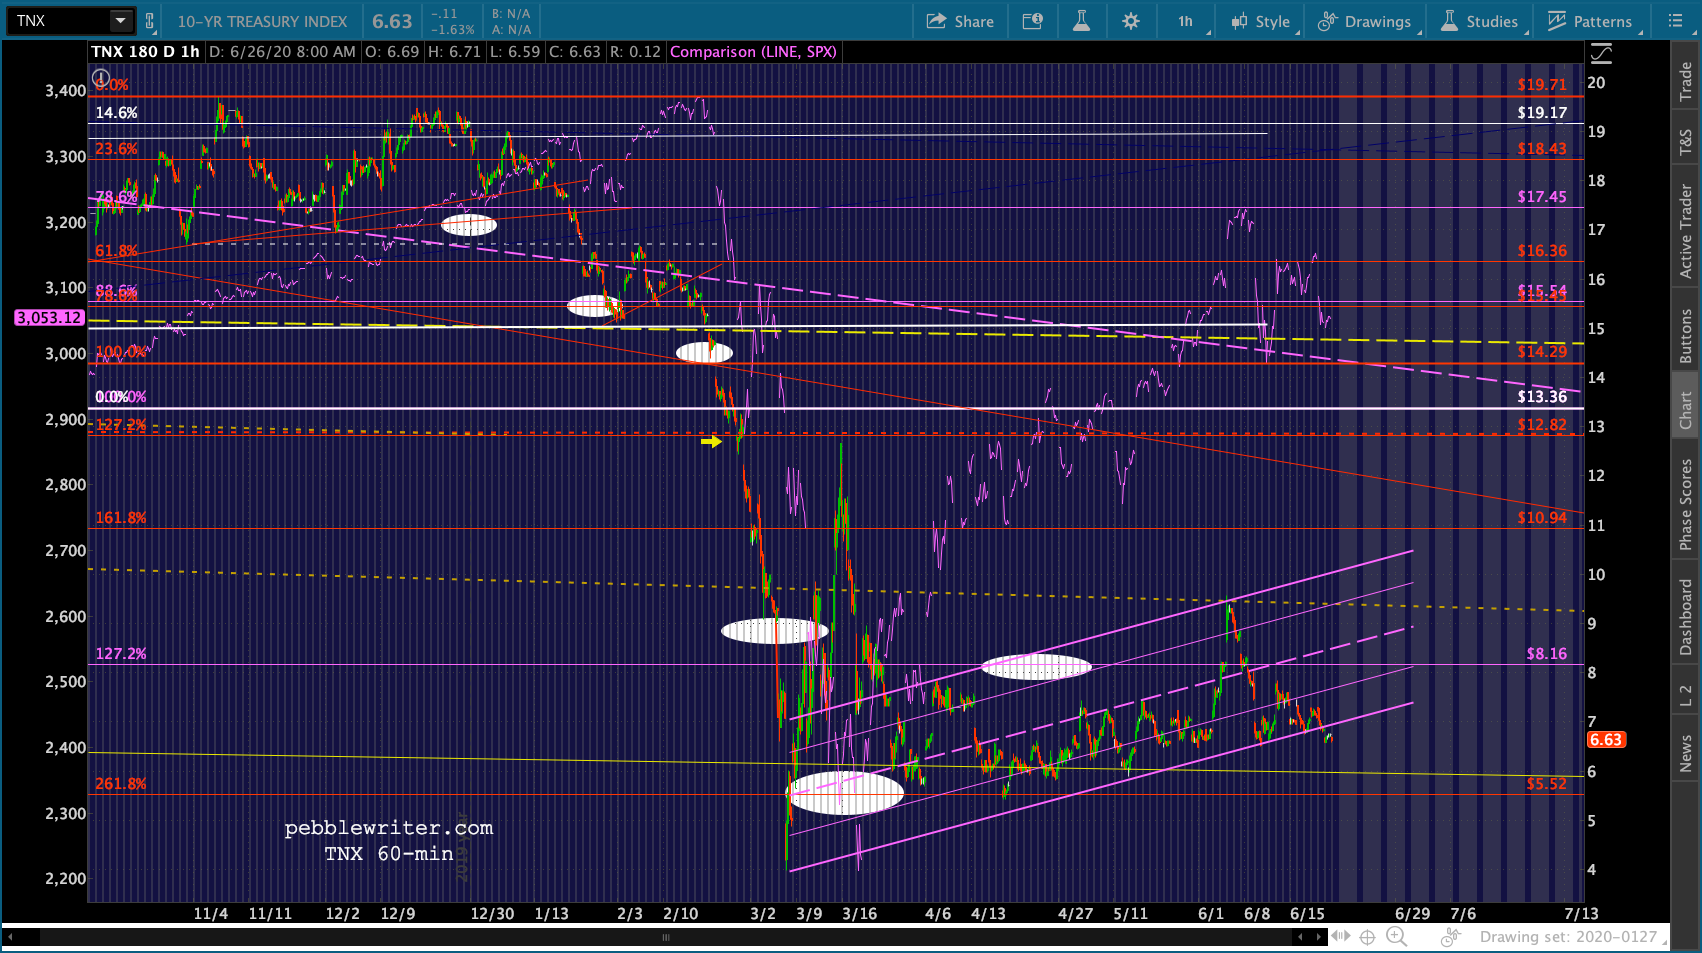 What does this mean for bonds and for stocks? Hint: bonds still matter.
continued for members…First, the bigger picture for ES and SPX… if the Fib is broken, our upside targets are unchanged. The downside case still represents some significant potential losses.
 VIX is still in the algos’ driver seat.
 While USDJPY is also still propping up stocks with its latest pop up to the SMA10.

 And, CL and RB have bounced as planned, but to where? They both have plenty of room to drop if they don’t hold their current support.

UPDATE: 10:29 AM
Apologies for the interruption…had a little medical emergency with one of our cats that will require a trip to the vet in an hour or so.
VIX has reached TL resistance, right as SPX reached TL support. Time for the bears to put up or shut up. Remember, SPX didn’t quite reach its SMA200 yesterday. Today it’s at 3020.90. That’s based on yesterday’s close. Intraday, it looks more like 3021.02.

 UPDATE: 10:29 AM
SPX just tagged its SMA200. Should get a bounce here, but keep a close eye on VIX, which is hinting at a breakout. CL and RB are also slumping badly. This being Friday leading into a holiday week and the Q2 end, could see a lot of folks taking their chips off the table.


 The most legit target below here is SPX’s .886 at 2987.31, which would align with ES’ SMA50 and purple .786 at 2973.51.
 UPDATE: 3:00 PM
So much for a quick trip to the vet… Just popping in to update things, then have to zip out again until after the close. The bond update will have to wait until later this evening or this weekend.
ES/SPX are making lower lows, so SPX’s .886 target is looking better by the minute.


Update on Bonds – continued
My bond forecasts have been largely driven by: (1) the often overlooked relationship between interest rates, inflation, and equity markets; and (2) chart patterns; and (3) Fibonacci patterns.
The relationship between bond yields, inflation and equity markets has evolved greatly over the past 20 years as rising debt levels and interest expense have made lower interest rates a necessity. The best examples can be found during recessions.
Most investors understand that increased deficit spending during recessions drives debt levels higher, necessitating lower interest rates (the black line below) in order to prevent interest expense (red line) from spiking higher.

Had the average interest rate on federal debt remained at 6.63% since 2000, for example, interest expense in FY 2019 would have topped $1.5 trillion instead of only $574 billion, consuming 53% of government revenues and resulted in nearly $50 trillion in federal debt.
The chart below is a stark visual of the impact that failing to lower rates would have had; but, it only tells half the story. The reality would have been even worse as much greater interest expense would have generated larger annual deficits and greater accumulated debt which would have, in a vicious cycle, increased interest expense.
 The BoJ and ECB have learned the hard way that there is no easy way out of such a debt spiral. The only alternatives to defaulting are to grow your way into budget surpluses – nice in theory, nearly impossible historically – or to continue borrowing at ever more affordable rates that compensate for the rising debt.
“Ever more affordable rates” of course is the gateway to negative interest rates. As long as borrowing costs nothing or even brings in revenue the game can theoretically continue forever – a consequence-free means to a solvent end, with rising stock prices to boot. At least, that’s the horse to which the Fed has hitched our wagon.
Many investors fail to fully appreciate the relationship between interest rates and equities. Fundamental analysis maintains that lower interest rates boost stock valuations by increasing the present value of future cash flows. Of course, market crashes also produce falling interest rates. As capital flows out of stocks and into bonds, bond prices rise and yields fall.
As central banks have become increasingly active in equity markets, we’ve also seen interest rate policy driven by the anticipated effect on stock prices more so than considerations of stable prices and full employment. In periods of high inflation and interest rates, when investors most fear the repercussions of rising debt, we’ve witnessed the Fed lower interest rates to alleviate fear and support stocks. During periods of low inflation and low interest rates, we’ve seen the Fed raise rates (or simply allow them to rise) in order to boost inflationary expectations.
Through these various cycles, equities have become increasingly sensitive to changes in rates. Algorithms cue off them in making buy/sell decisions, resulting in an environment where the Fed’s unspoken motives have become more important than the presumed economic impact of changes in interest rate policy.
There is no way that the US can afford for interest rates to normalize. Therefore, we can assume that the Fed will continue to follow the Bank of Japan and the ECB down the rabbit hole of lower rates in the interest of both minimizing debt and deficits and maximizing equity returns.
The good news is that it isn’t hard to do. As mentioned above, a good market crash now and then can drive interest rates much lower with very little effort. At that point, the Fed needs merely to depress them only slightly or to keep them low until markets have stabilized.
The bad news is that the Fed risks painting itself into a corner much like the BoJ, where markets aren’t satisfied with low enough – they need lower. Eventually, the law of diminishing returns kicks in. At least that’s the theory.
continuing…