Category: Charts I’m Watching

  • The Yield Curve Model: Dec 8, 2020

    One of my favorite market indicators is our yield curve model. It has warned us several times in advance of significant correctionsthis year.

    Warnings over the past few years have included:

    July 16, 2018: The Yield Curve Update – We were a little early. SPX closed at 2798 that day, rose to 2940 before crashing 20% by Dec 26.  The final 13% was signaled on Dec 5: The Yield Curve’s Warning.]

    April 25, 2019: The Yield Curve Model Warns Again – SPX gained 21 points over the next four sessions before quickly shedding 226 points.

    February 20, 2020: Buckle Up – SPX (which had topped out the day before) crashed by over 35% over the next month.

    August 25, 2020: Update on AAPL – We were about a week early, but the model signaled a correction which saw SPX fall 11%, followed by another 9% the next month.

    The recent breakout of the 2s10s is clearly a bearish signal – though it hasn’t yet paid off.  Is the model still working?  First, a little history. Among other things, the model holds that breakouts above significant resistance are bearish for equities.

    If we plot the 2Y and 10Y together, we can see that significant sell-offs in stocks were marked by more rapid declines in 2Y yields than in 10Y yields (i.e., a widening of the spread between the two.)

    The shaded areas below illustrate the period during which stocks experienced their most significant corrections between 2000-2013. Though the 2Y and 10Y both declined during these periods, the 2Y yields clearly fell faster.

    But, as we saw in 2015-2016 and again in late 2019, not all corrections involved a steepening. These selloffs occurred without the yield curve model signal being triggered. Did the model stop working?  Hardly. The decline earlier this year was a stark reminder of its predictive power.  What made these corrections different?  More importantly, what is the model signaling now, and how likely is it to play out?

    continued for members(more…)

  • Different This Time?

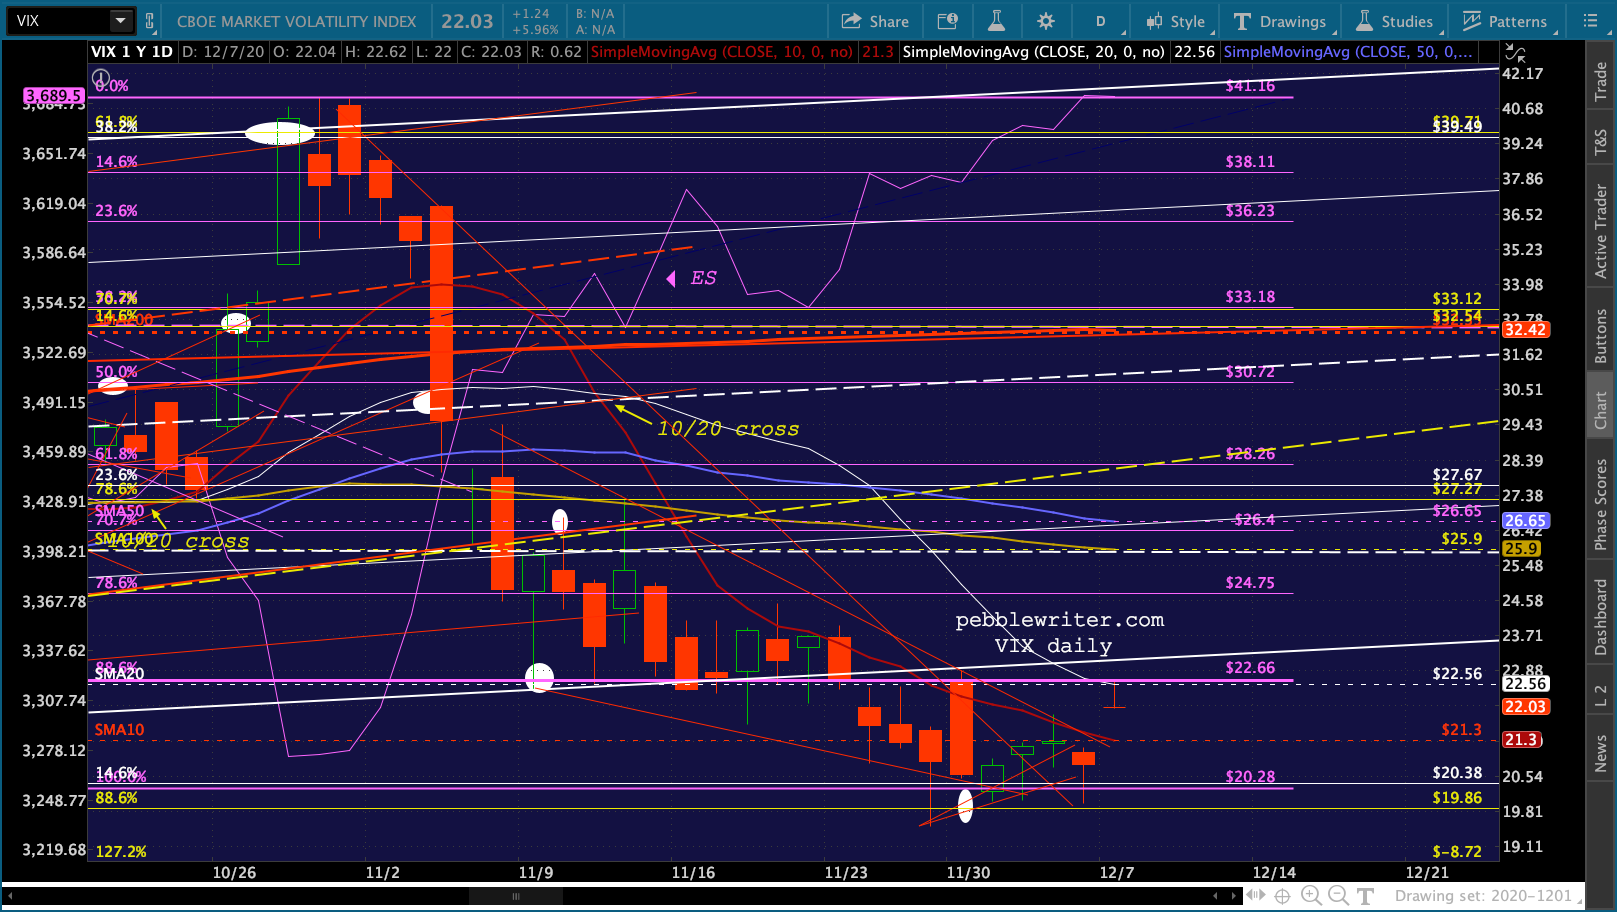
    VIX did something this morning it hasn’t done since mid-October: gap above its 10-DMA.  The last time it did this, SPX promptly dropped 250 points.Of course, every time VIX acts up, it’s promptly slapped back down. But, this time it happened at the 20-DMA. Could this latest move be different?

    continued for members(more…)

  • Stocks Decimated by Unemployment Woes

    In news that should surprise no one, job growth is slowing as the country enters the most dangerous phase of the pandemic.

    The news shook stocks, with S&P futures now off a stunning 2 points since prior to the announcement.

    Aghast that the index might not make another new all-time high today, investors across Wall Street had to be talked off of window ledges.  Observing the carnage, algos could be heard muttering, “VIX…VIX…VIX…”

    Hopefully stocks, after suffering through the greatest monthly gain since 1987 in November, will recover.

    continued for members(more…)

  • Update on Currencies: Part 2

    We will continue yesterday’s overview on currencies and how their recent price action affects bonds, gold, crypto and equities.

    First, note that DXY did in fact break below the midline. As we discussed yesterday, this is potentially very significant.

    continued for members(more…)

  • Update on Currencies: Dec 2, 2020

    Back in March, when currencies were gyrating wildly, DXY shot nearly 10% higher in a little over a week [see: Currencies to the Rescue] to rescue stocks – which sorely needed a rescue at the time. But, it became very overbought. Our downside target of 94.20 remained in place.

    In July, when DXY reached the target and plunged through the channel bottom there, we started looking at 91.358 as the next most important level of support.

    The 91.358 target was even more important tha 94.20 for a number of reasons. Now that we’ve reached it, what can we expect for the dollar and other major currencies?And, what does it mean for bonds, gold and equities?

    continued for members(more…)

  • It’s VIX’s Party Now

    ES is up 13.7% since the last bearish (bullish for stocks) cross in VIX’s 10- and 20-day moving averages on Nov 11. Since its recent highs, VIX has dropped from 41.16 to Friday’s lows of 19.51 – a plunge of 52.6%. Just as importantly, it broke below several trend lines of support along the way, with each breakdown triggering algos to push stocks to new highs.

    As we’ve discussed many times over the past few months, 19.86 is a key price level for VIX – the 88.6% Fibonacci retracement of its rise from 11.42 on Nov 26, 2019 to 85.47 on Mar 18, 2020.After testing 19.86 in Friday’s pre-market, VIX bounced up to backtest its hapless 10-DMA – where it was unceremoniously slammed 12.6% lower – thus ramping ES 72 points higher.

    This is a game VIX plays very, very well. Sitting just above this key level of support, it is once again firmly in control. It’s VIX’s party now.

    continued for members(more…)

  • Update on Gold & Silver: Nov 30, 2020

    We noted back on July 9 [see: Moment of Truth] that GC had reached our long-held 1823.60 target well ahead of schedule.

    From a charting standpoint, it should reverse here at its .886 Fib retracement. From a fundamental standpoint, of course, the fiscal picture suggests plenty of additional upside. Remember, it broke out of two different rising channels in order to reach this price level well ahead of schedule. We have to wonder whether a reversal in GC would, as would normally be the case, result in a rally in the long-suffering DXY.

    We were still bearish on DXY, so the potential for a reversal in GC seemed limited.

    As it turned out, the fundamental picture won out. Though it took it about 9 sessions, it finally pushed above its .886 retracement, and then its former all-time highs – breaking out of rising channels in an explosion up to 2089.20.

    We got a (quite violent) backtest of 1823 as expected, followed by six weeks of sideways consolidation while pretty much everybody waited for Congress to approve another round of stimulus. Unfortunately for GC, the stimulus never came.

    Since then, GC has been settling lower in a falling channel which pointed to a rendezvous with the 200-DMA – which was breached on Friday. This is a significant breakdown which implies a troubled path forward. But, there are other factors at work.

    continued for members(more…)

  • TSLA: To Infinity and Beyond?

    Few stocks exemplify the current excesses of the stock market better than TSLA. In our last posted update on Jan 30 [see: TSLA on Autopilot?] we noted that it was approaching the top of a channel and a potential Fibonacci reversal point at 653.26 [131.15 post-split.]  We noted at the time:

    If it reverses here, the nearest support is at the 10-day moving average at 550, with 521 [104.20 post-split] being the nearest strong support and the previous high of 389.61 [77.92 post split] the next most likely.

    That weekend, ARK Invest said it estimated Tesla shares would be worth about 7,000 (1,400 post-split) by 2024.  And on Monday, Argus analyst William Selesky boosted his 12-month price target on the shares from 556 to 808 (161.6 post-split.)

    With such bullish tailwinds, TSLA gapped past the 2.24 extension on the open Monday morning and broke out of the channel, reaching the 3.618 extension at 190.29 the following day before running out of steam.  By Mar 18, it had plunged to its 77.92 previous high, shedding a stunning 64% in 6 weeks.

    In previous posts [see: Can TSLA Survive This Crash?, Is the Pressure Getting to Elon Musk? and TSLA Skids Into An Important Target] we have noted Elon Musk’s propensity to “support” the stock at important inflection points.  Remember “Funding Secured?”  Remaining above its 200-day moving average and previous highs certainly qualified as important.

    Since Mar 18, TSLA has soared an astounding 750%, surpassing even Selesky’s revised Aug 31 target of 566 following several sessions reminiscent of February’s blow-off top. Is there an end in sight?

    continued for members(more…)

  • Charts I’m Watching: Nov 25, 2020

    It’s a big day for economic data. The GDP second estimate came in on target at 33.1%, as did the GDP deflator at 3.6%. Durable orders beat at 1.3% versus 0.8% forecast. But, it was Initial Claims at 778K versus consensus of 735K that necessitated a quick dip to yesterday’s lows in VIX.

    As a result, ES is back to flat after backtesting its broken channel overnight. continued for members(more…)

  • The End?

    So…Janet Yellen again. The market seems quite pleased with the idea of a dovish Treasury Secretary paired with a dovish Fed. Is this the end of equity corrections?

    continued for members(more…)