

Few stocks exemplify the current excesses of the stock market better than TSLA. In our last posted update on Jan 30 [see: TSLA on Autopilot?] we noted that it was approaching the top of a channel and a potential Fibonacci reversal point at 653.26 [131.15 post-split.] We noted at the time:
If it reverses here, the nearest support is at the 10-day moving average at 550, with 521 [104.20 post-split] being the nearest strong support and the previous high of 389.61 [77.92 post split] the next most likely.

That weekend, ARK Invest said it estimated Tesla shares would be worth about 7,000 (1,400 post-split) by 2024. And on Monday, Argus analyst William Selesky boosted his 12-month price target on the shares from 556 to 808 (161.6 post-split.)
With such bullish tailwinds, TSLA gapped past the 2.24 extension on the open Monday morning and broke out of the channel, reaching the 3.618 extension at 190.29 the following day before running out of steam.  By Mar 18, it had plunged to its 77.92 previous high, shedding a stunning 64% in 6 weeks.
In previous posts [see: Can TSLA Survive This Crash?, Is the Pressure Getting to Elon Musk? and TSLA Skids Into An Important Target] we have noted Elon Musk’s propensity to “support” the stock at important inflection points. Remember “Funding Secured?” Remaining above its 200-day moving average and previous highs certainly qualified as important.
Since Mar 18, TSLA has soared an astounding 750%, surpassing even Selesky’s revised Aug 31 target of 566 following several sessions reminiscent of February’s blow-off top. Is there an end in sight?
continued for members…The first, most obvious point from examining the charts is that the yellow channel is kaput. The second is that TSLA has exceeded even the 3.618 extension of the Feb-Mar 2020 drop.
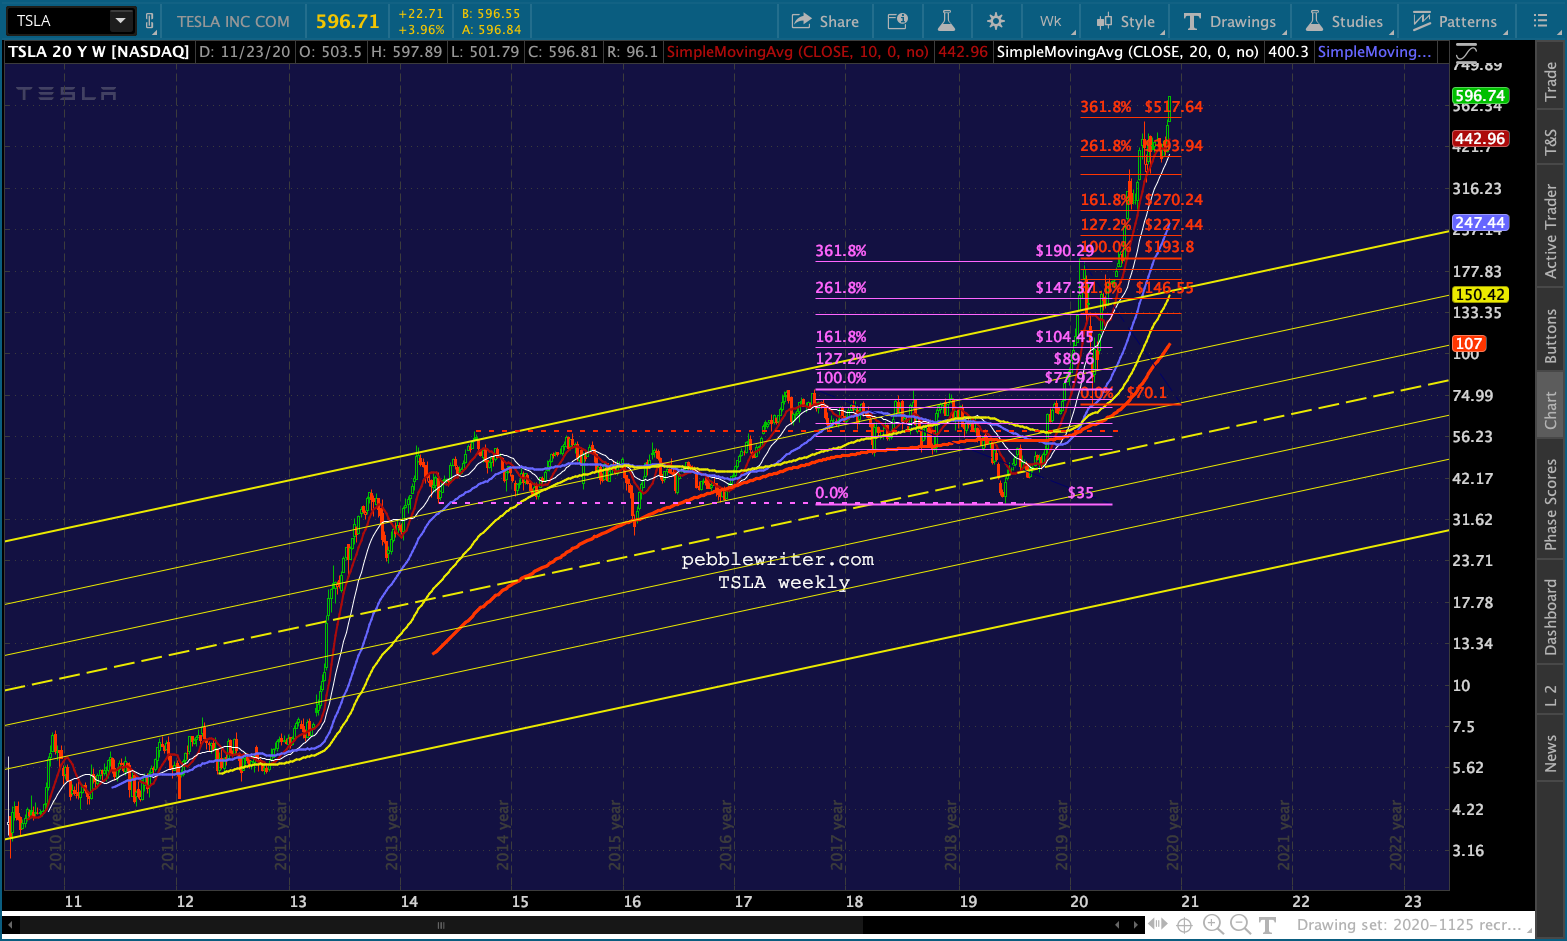 Not only is the yellow channel kaput, a more aggressive/generous rising channel based on the lows is also insufficient to capture the recent highs.
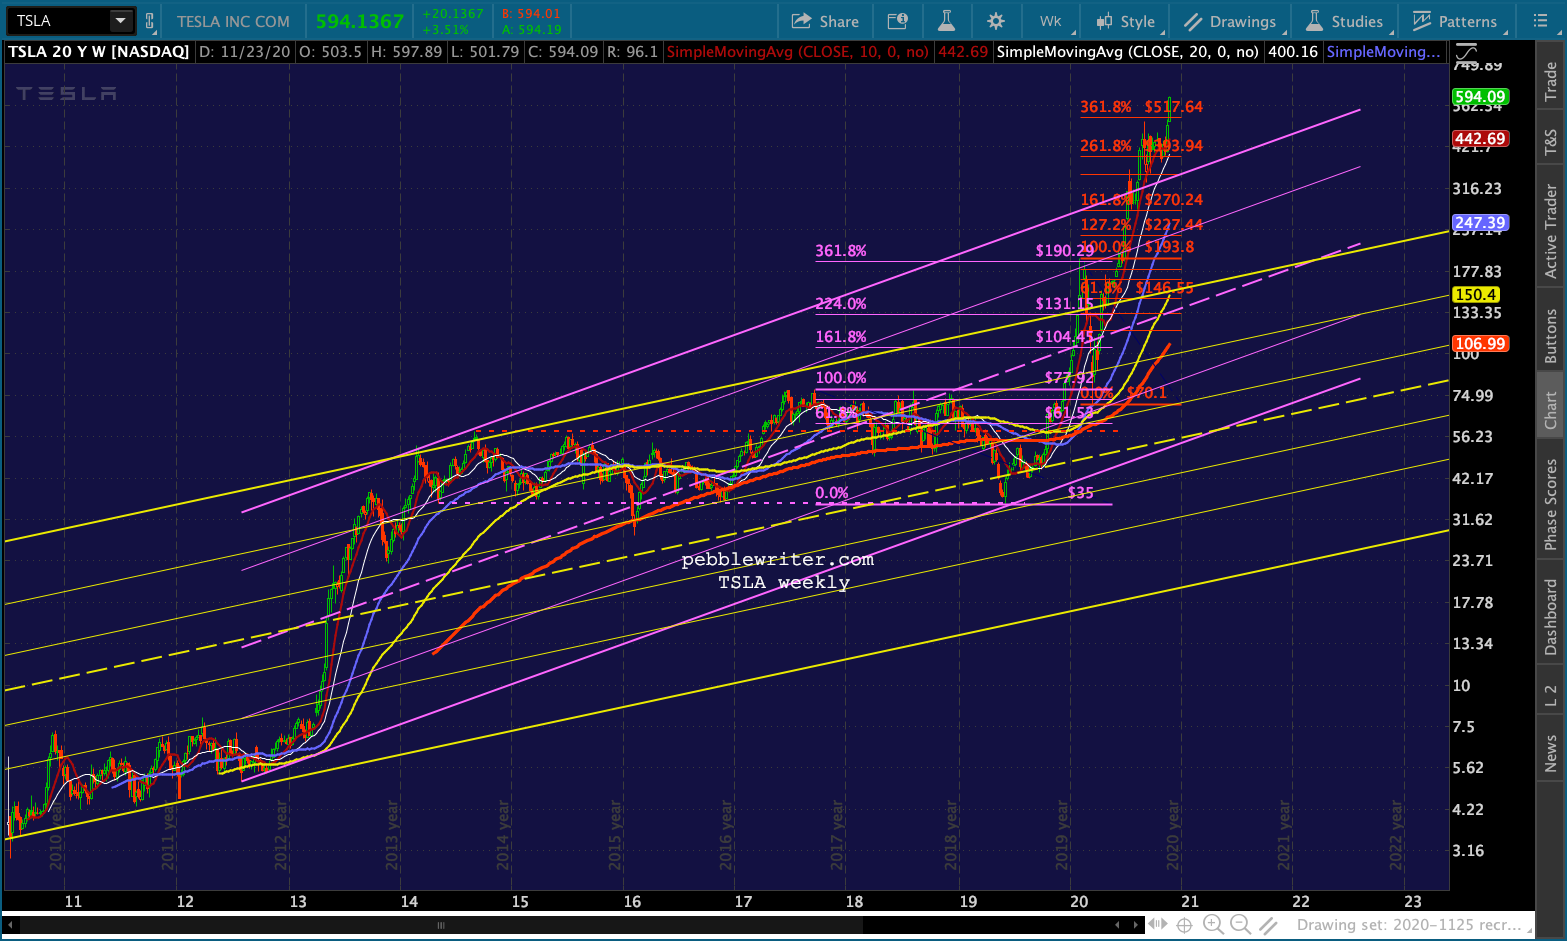 Zooming in, we can see that it had potential to represent an important top at the red 2.24 extension of 347.18. TSLA even reversed there – falling 24% from 359 to 273.
 It subsequently recovered, breaking out of the purple channel four sessions later to test the 3.618 at 517.64. This time, the correction was a more substantial 34% – in only one week. It backtested the purple channel for good measure.
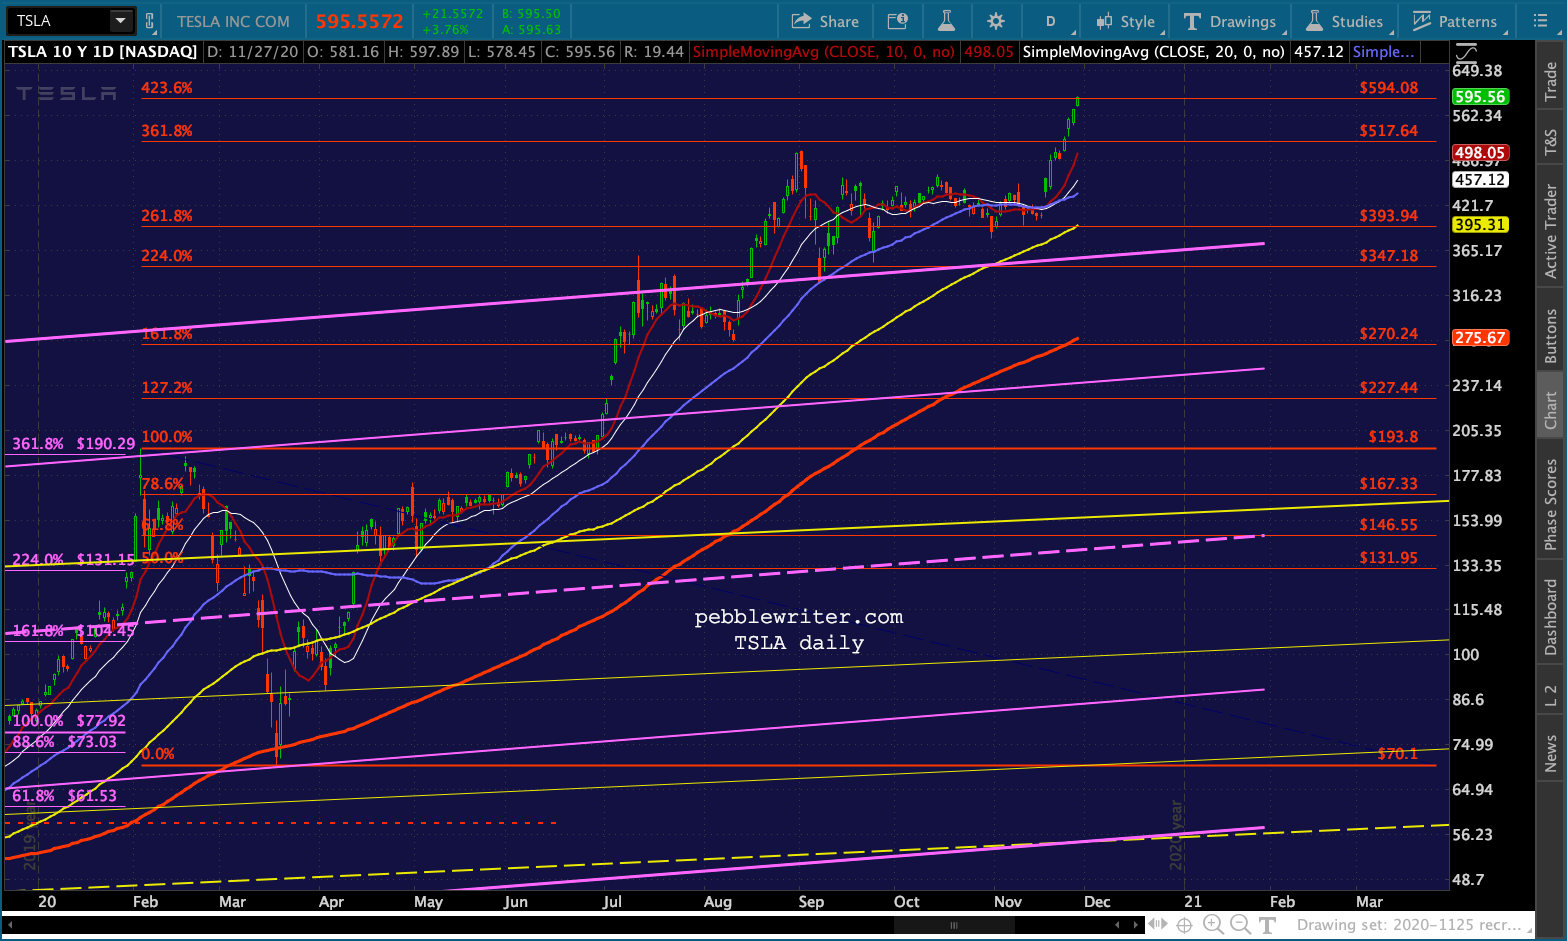 It has since reached the 4.236 extension at 594.09 and the .786 line of a channel based on 2020 highs. But, it’s actually slipping past the 4.236, notching new highs.
 If we zoom in a little further, we can see that it’s approaching the 1.618 extension of the 34% Sep 1-8 drop as well as the significant round number of 600.
 If it has trouble pushing past these levels, it has immediate downside potential to 502.49 – its former highs and the level its SMA10 should reach by Monday – a garden-variety 16% correction. If it pushes past 609.16, it has potential to the 2.24 at 716.53 followed by the 2.618 at 781.77. Given the steepness of this white channel, 781.77 would need to come very quickly – within the next few sessions.
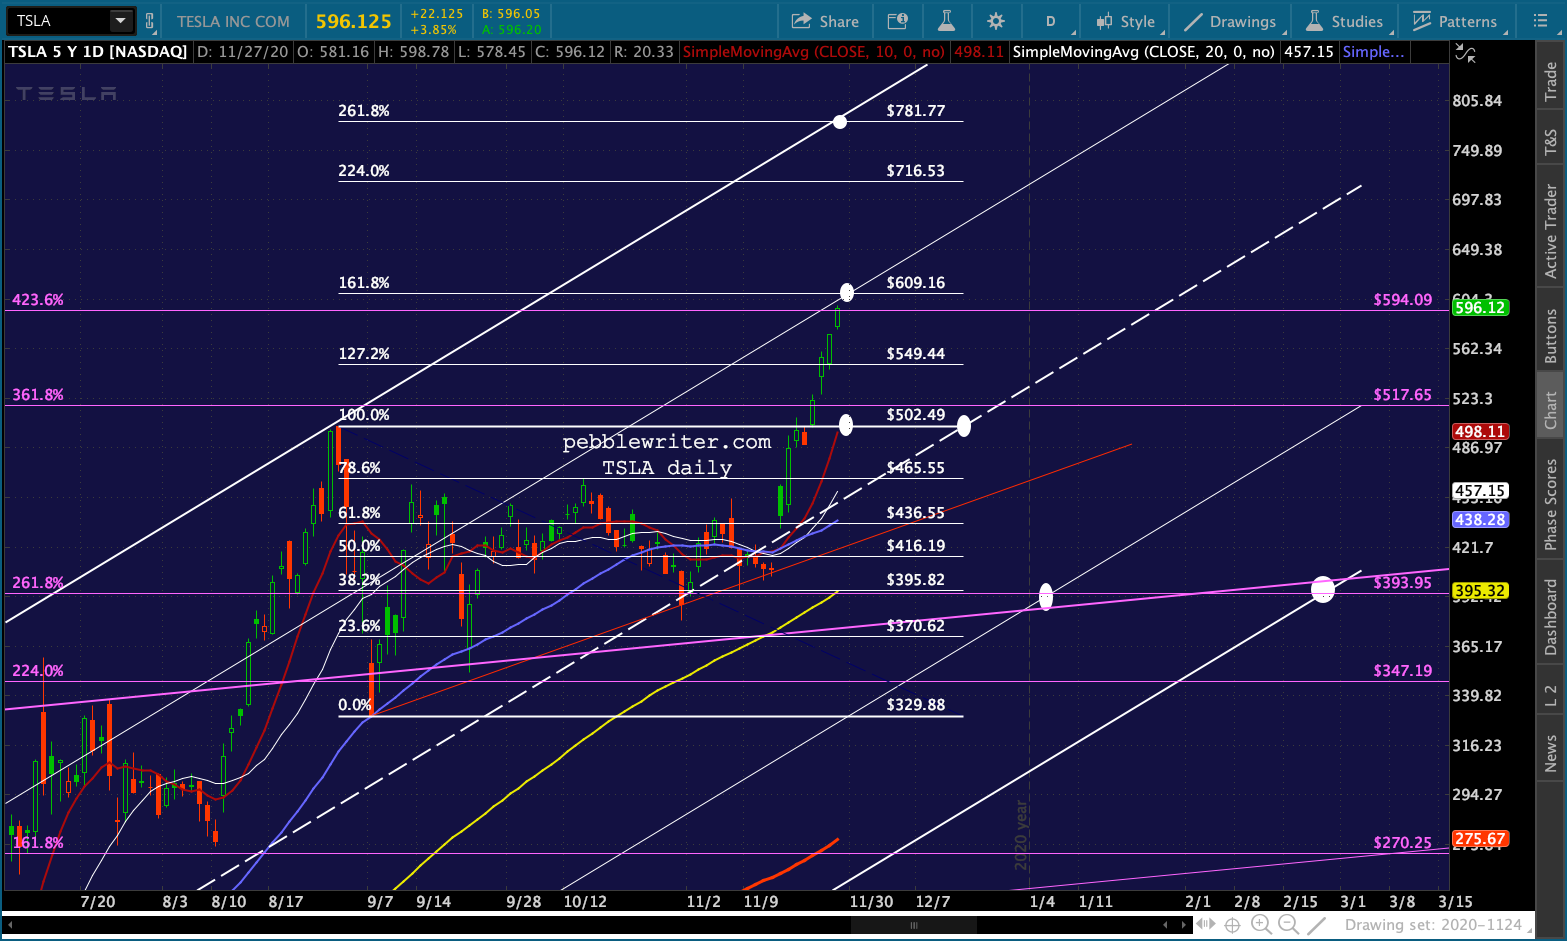 I find this somewhat unlikely given the strength it has shown in getting to current levels as quickly as it has. So, let’s look at the downside case.
Assuming 609.16 holds – which I think is somewhat likely – we have:
- the SMA10 and former high at 502.49 right away
- the same level, but around Dec 21 when the white channel midline reaches it.
- 393.95 either in early Jan when the broken purple channel top reaches the white channel .236 line
- 393.95 in late Feb at the intersection of the purple 2.618, white channel bottom and purple channel top.
Would I bet on TSLA reversing here? Perhaps with speculative money. Musk has few inhibitions when it comes to manipulating this stock. And, the Robin Hood crowd has few inhibitions when it comes to chasing momentum.
On the other hand, there are many issues and controversies hanging over the company which could prompt a selloff. It is very, very overbought on quite negative divergence and its RSI has reached a falling TL – one of my favorite indicators.
 GLTA.
GLTA.