

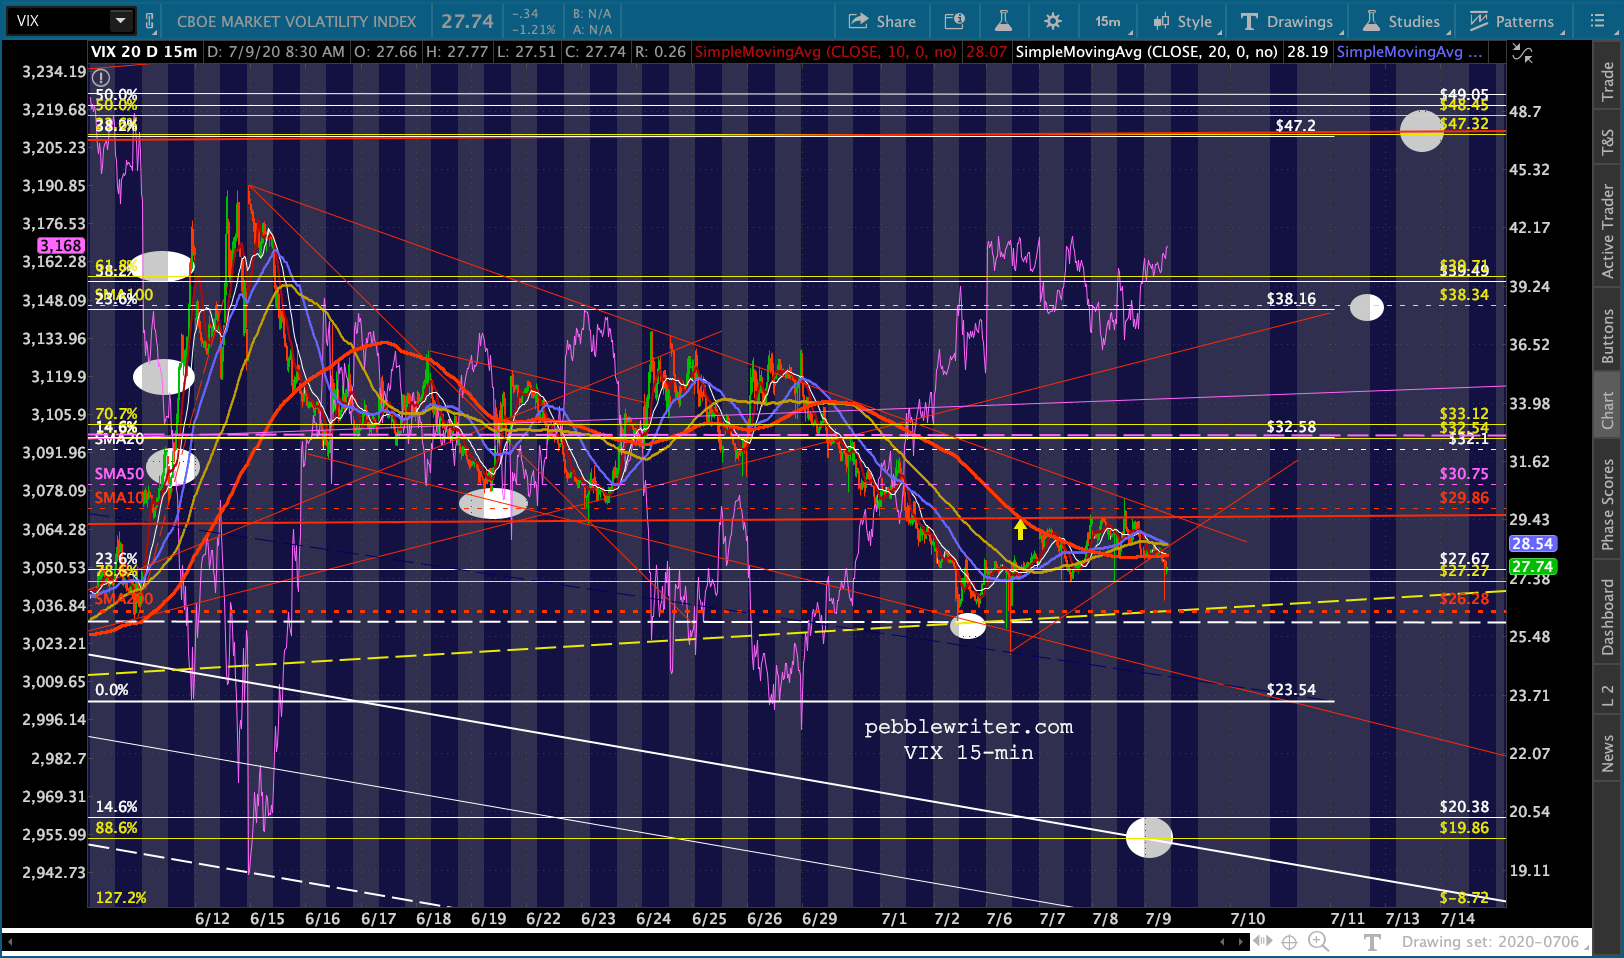
Algos continue to prop up stocks. This morning, VIX tested its 200-day moving average yet again, setting the stage for SPX to join ES in completing a golden cross. It will either be a springboard to new highs or, as we discussed on Tuesday [see: The Big Picture], a nasty headfake.
 It’s another moment of truth for stocks which seemingly everyone agrees are way ahead of fundamentals.
continued for members…Personally, I think it will be a headfake. I think the top is either already in or will be shortly.
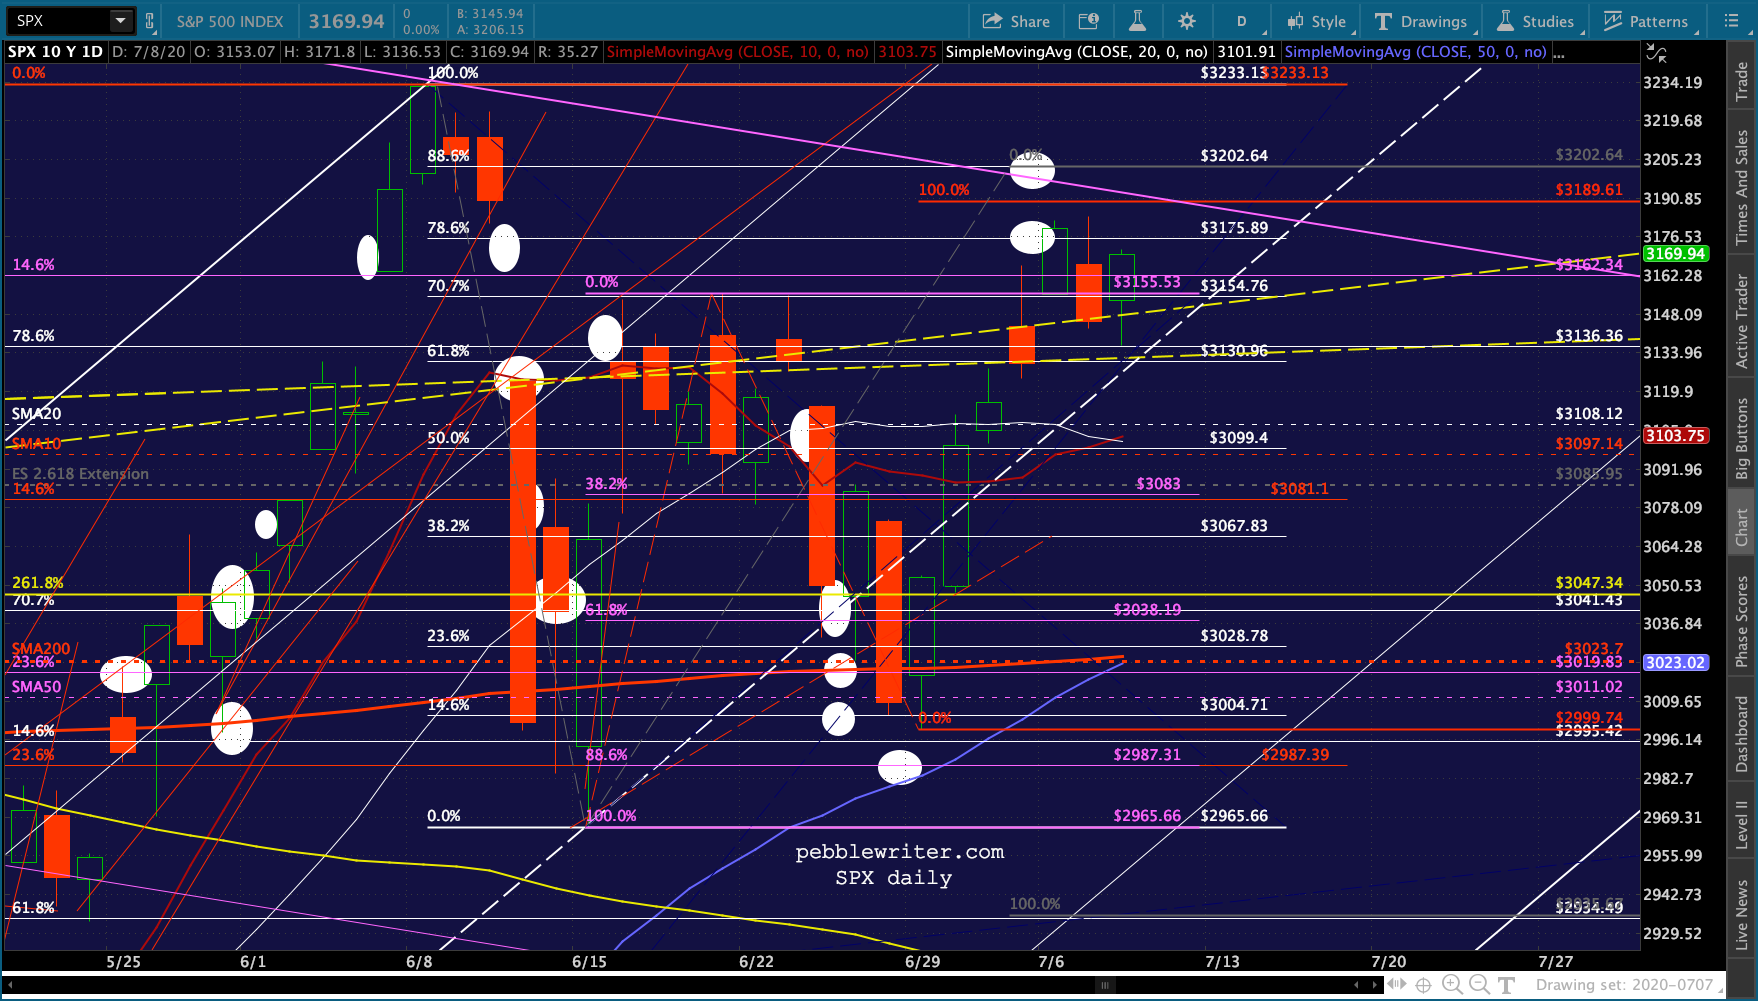
 The SPX version:
 VIX continues to threaten a breakdown, which continues to be the biggest driver and the biggest wild card for stocks.
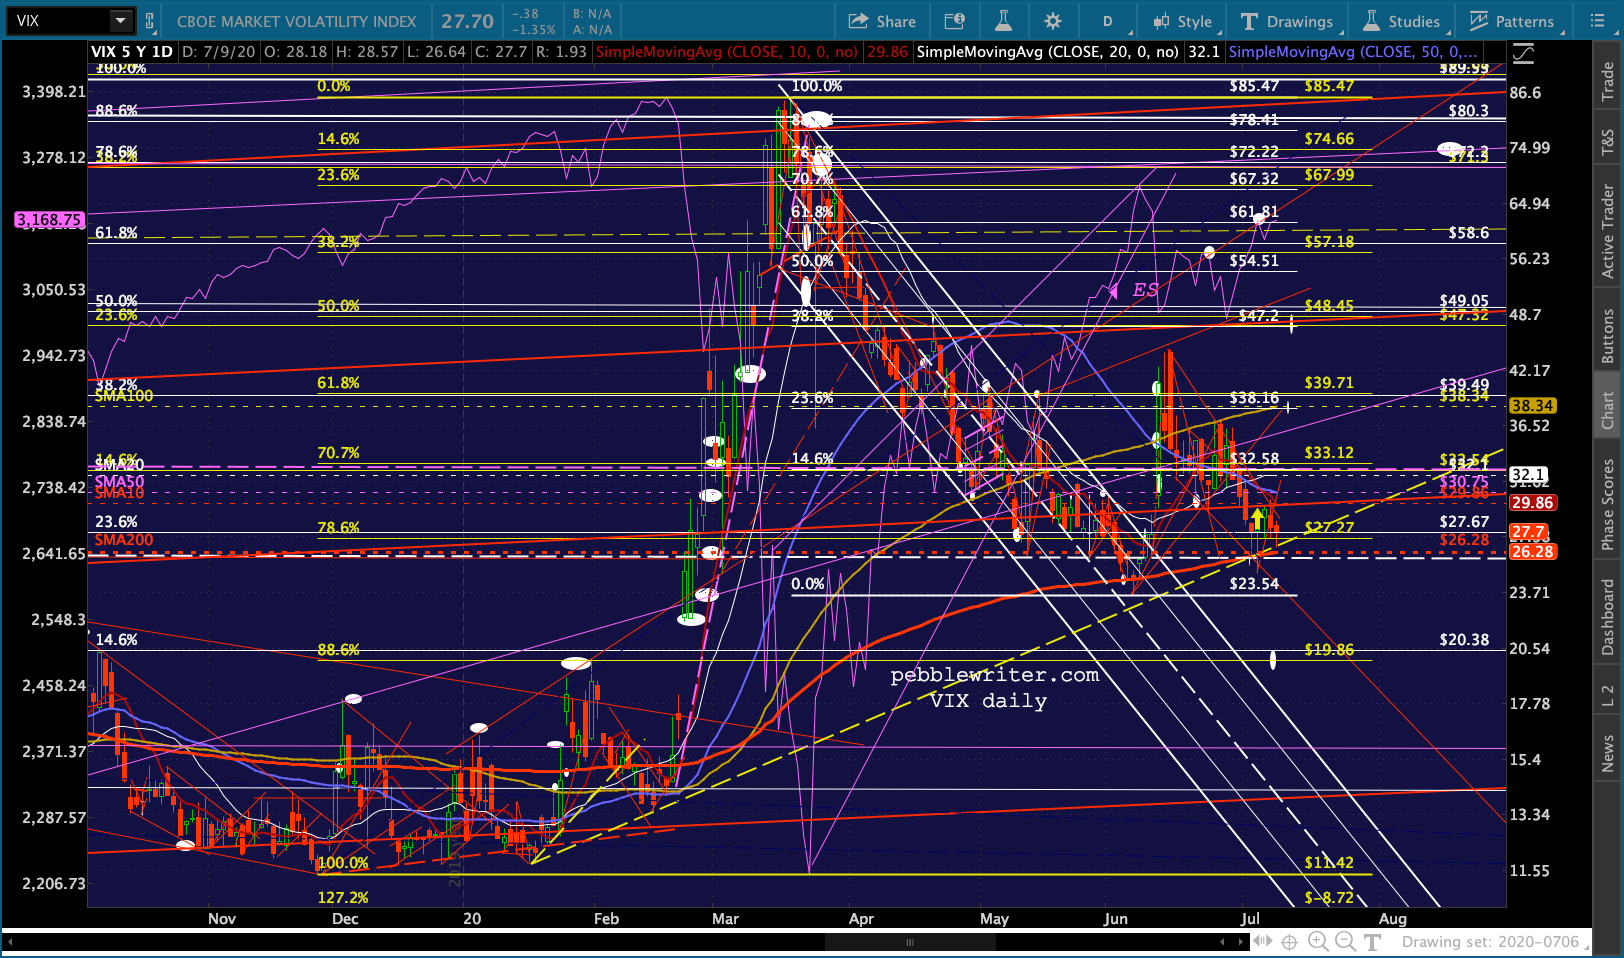
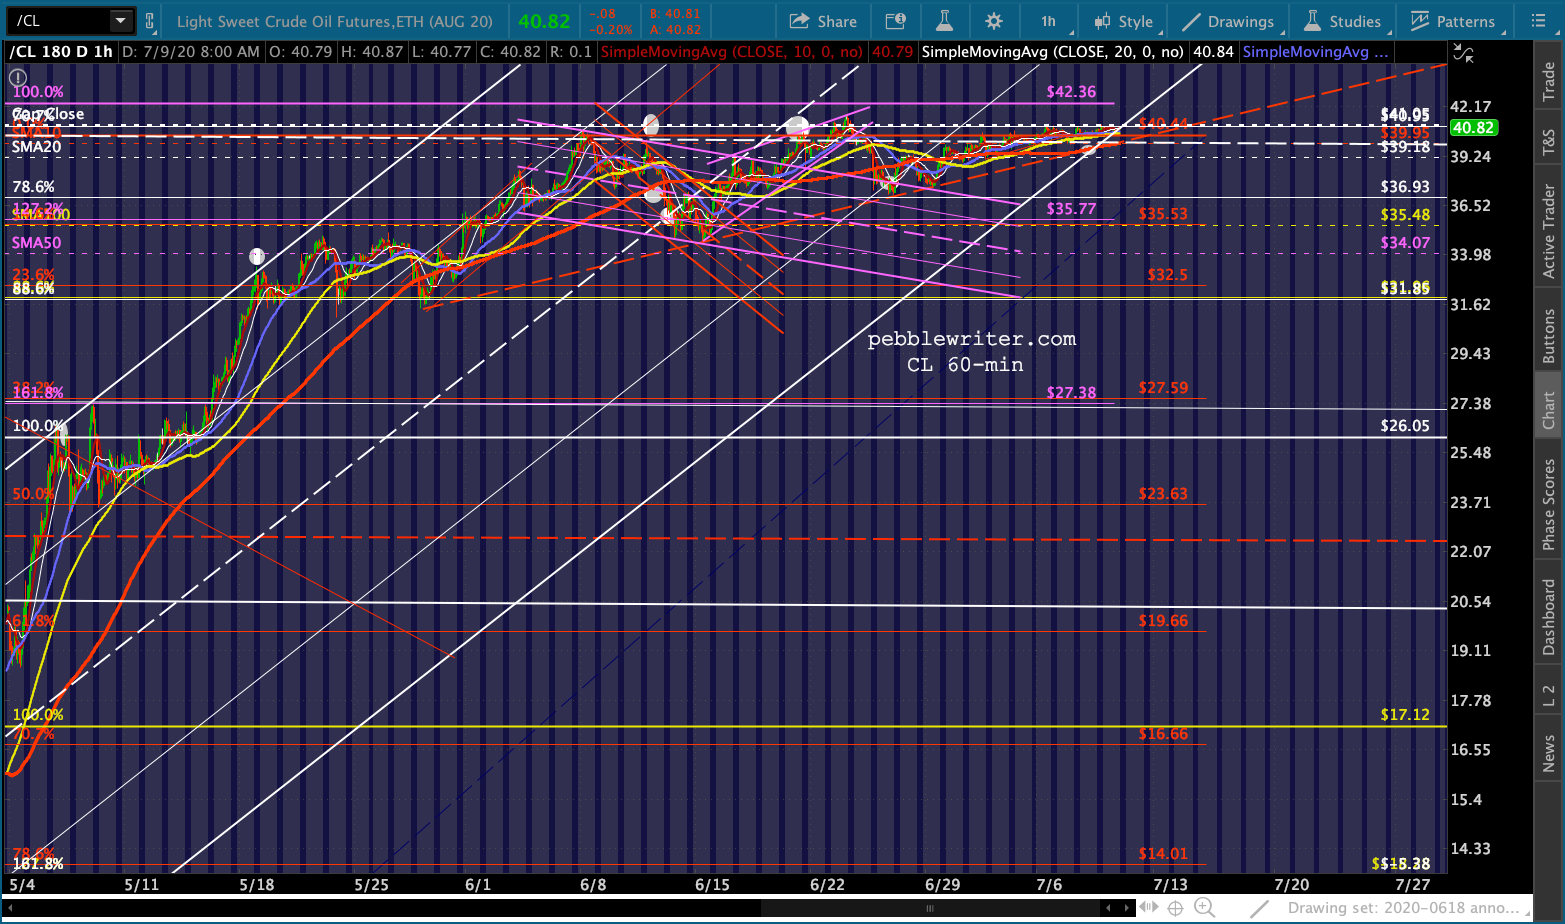
 CL has run out of room to go sideways. It must either break out or break down.
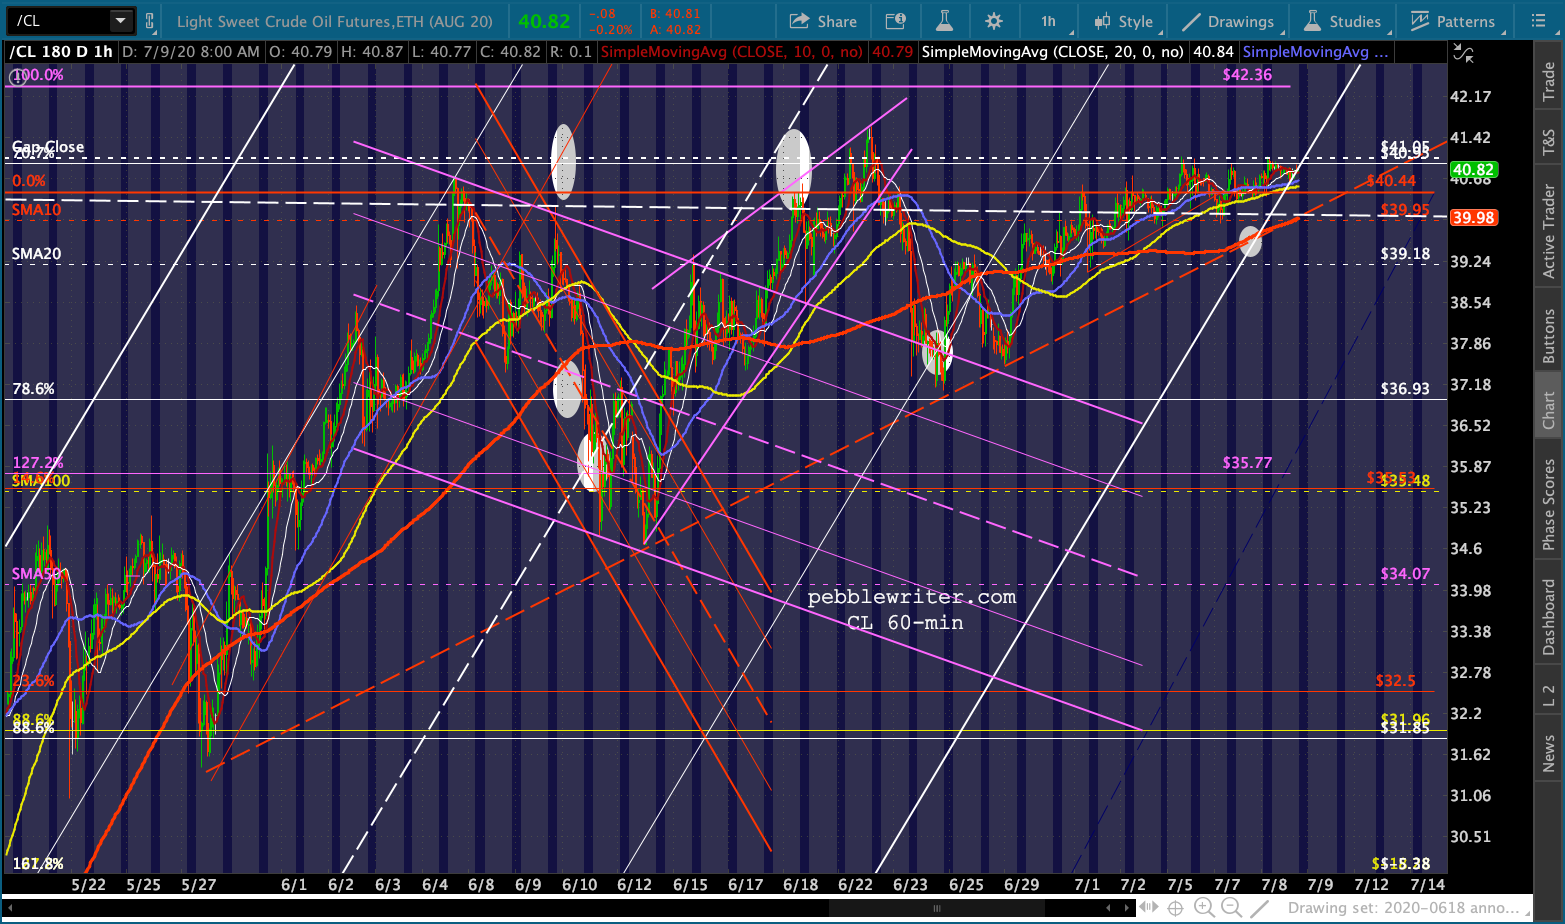
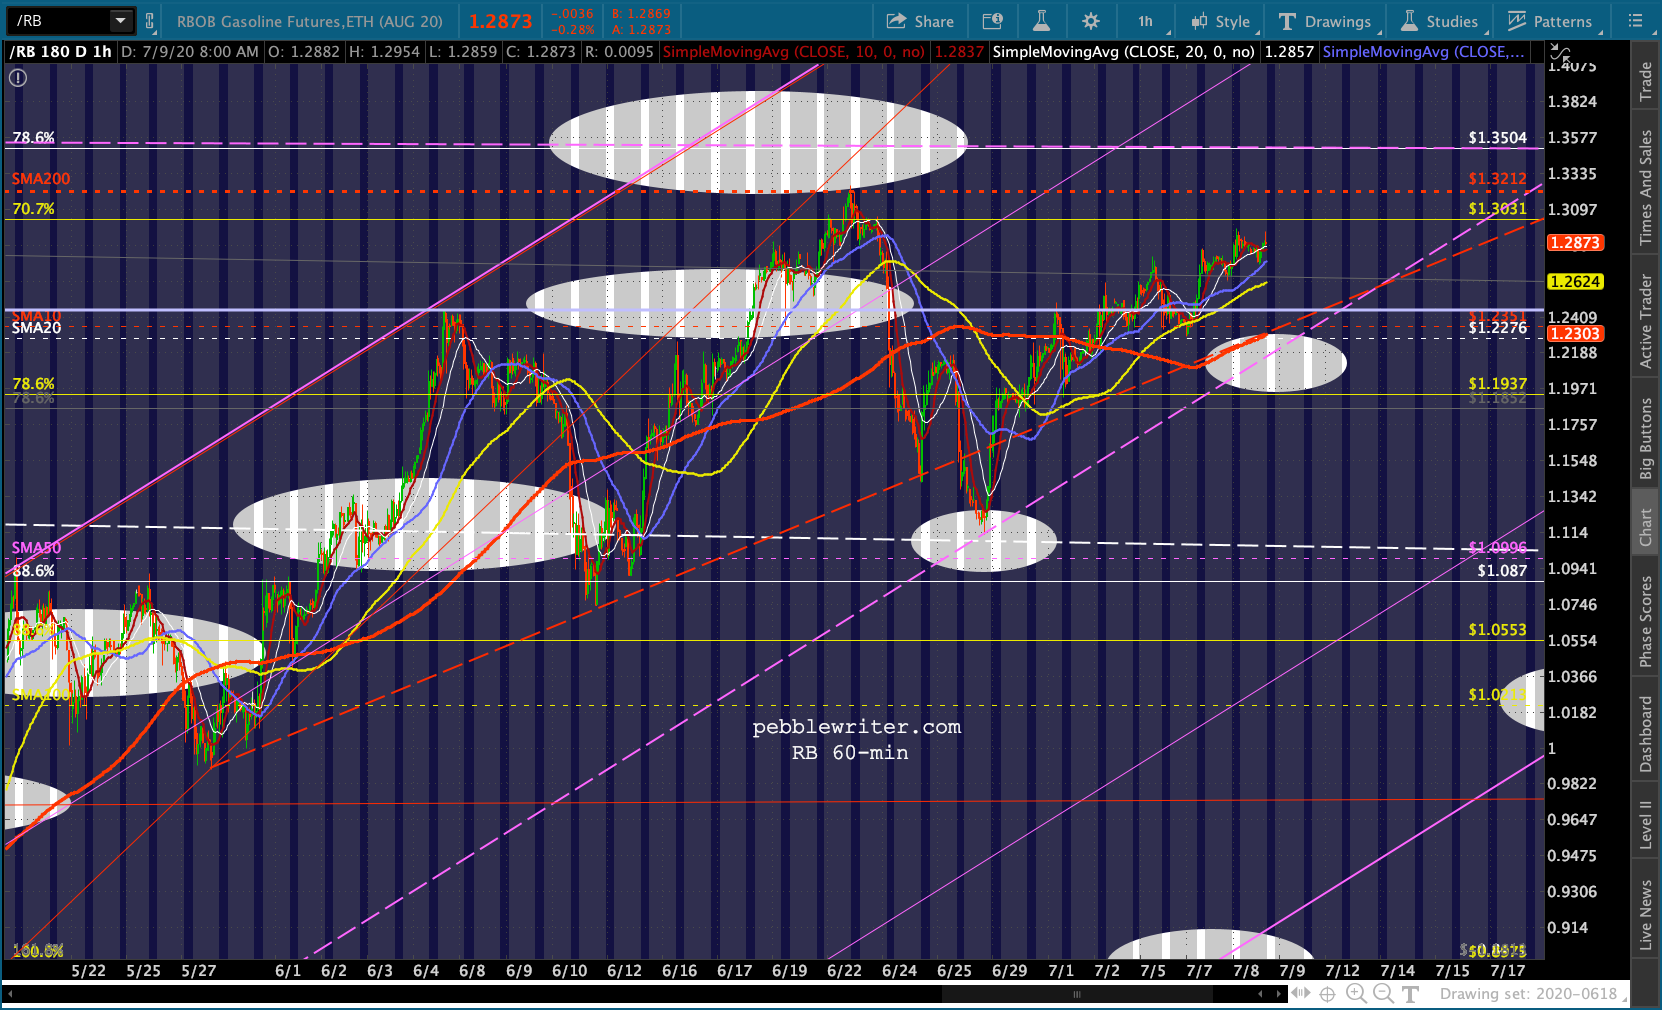
 While RB has a small amount of additional upside to its SMA200.
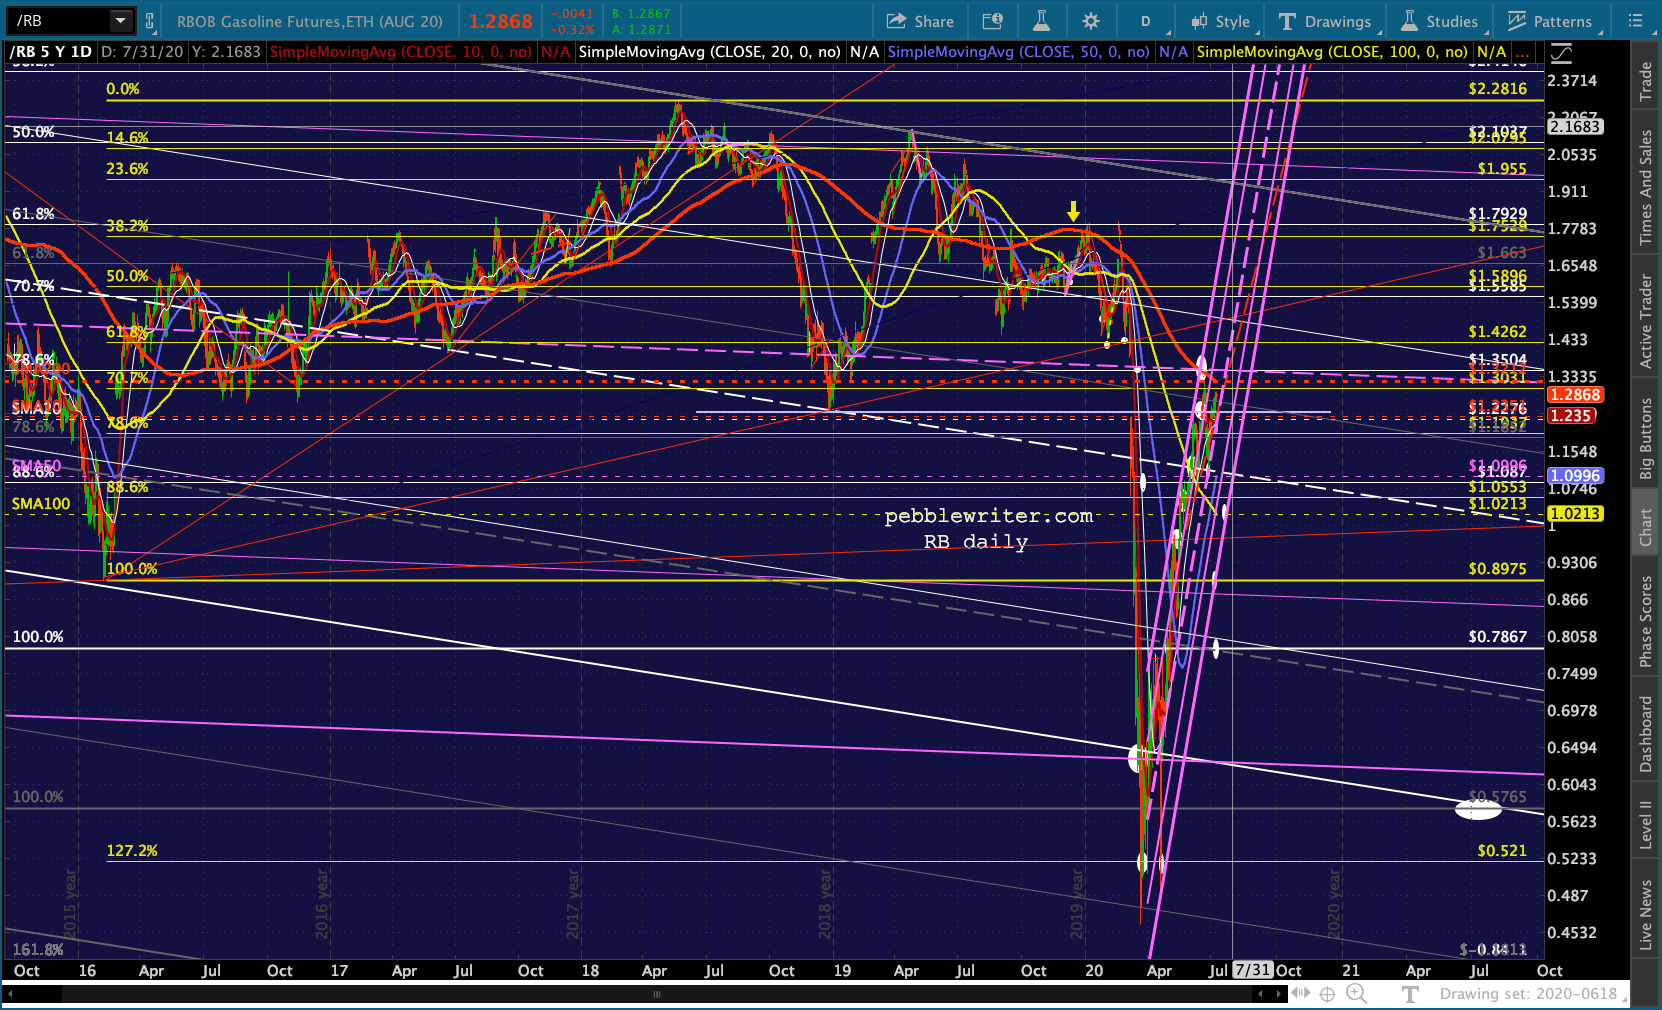
 USDJPY has nearly reached its yellow fan line from its May lows.
  Note that it broke down in late June, but recovered. The falling white channel is still the primary trend and still suggests additional downside.
 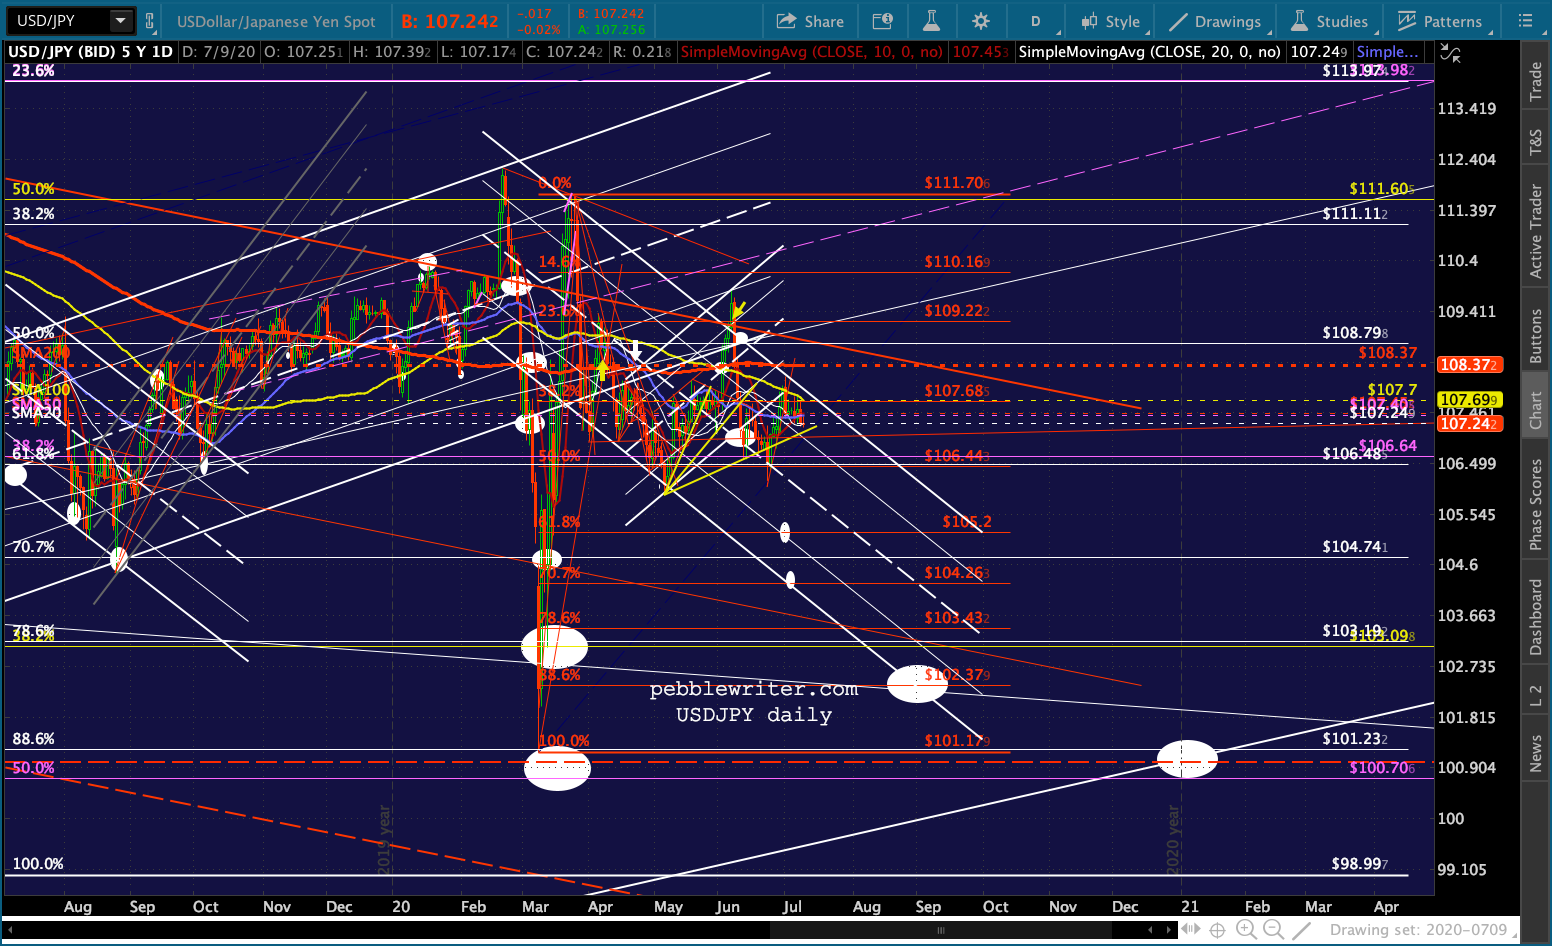 Perhaps the most interesting development in the last 24 hours is gold, which has finally reached our 1823 target.
 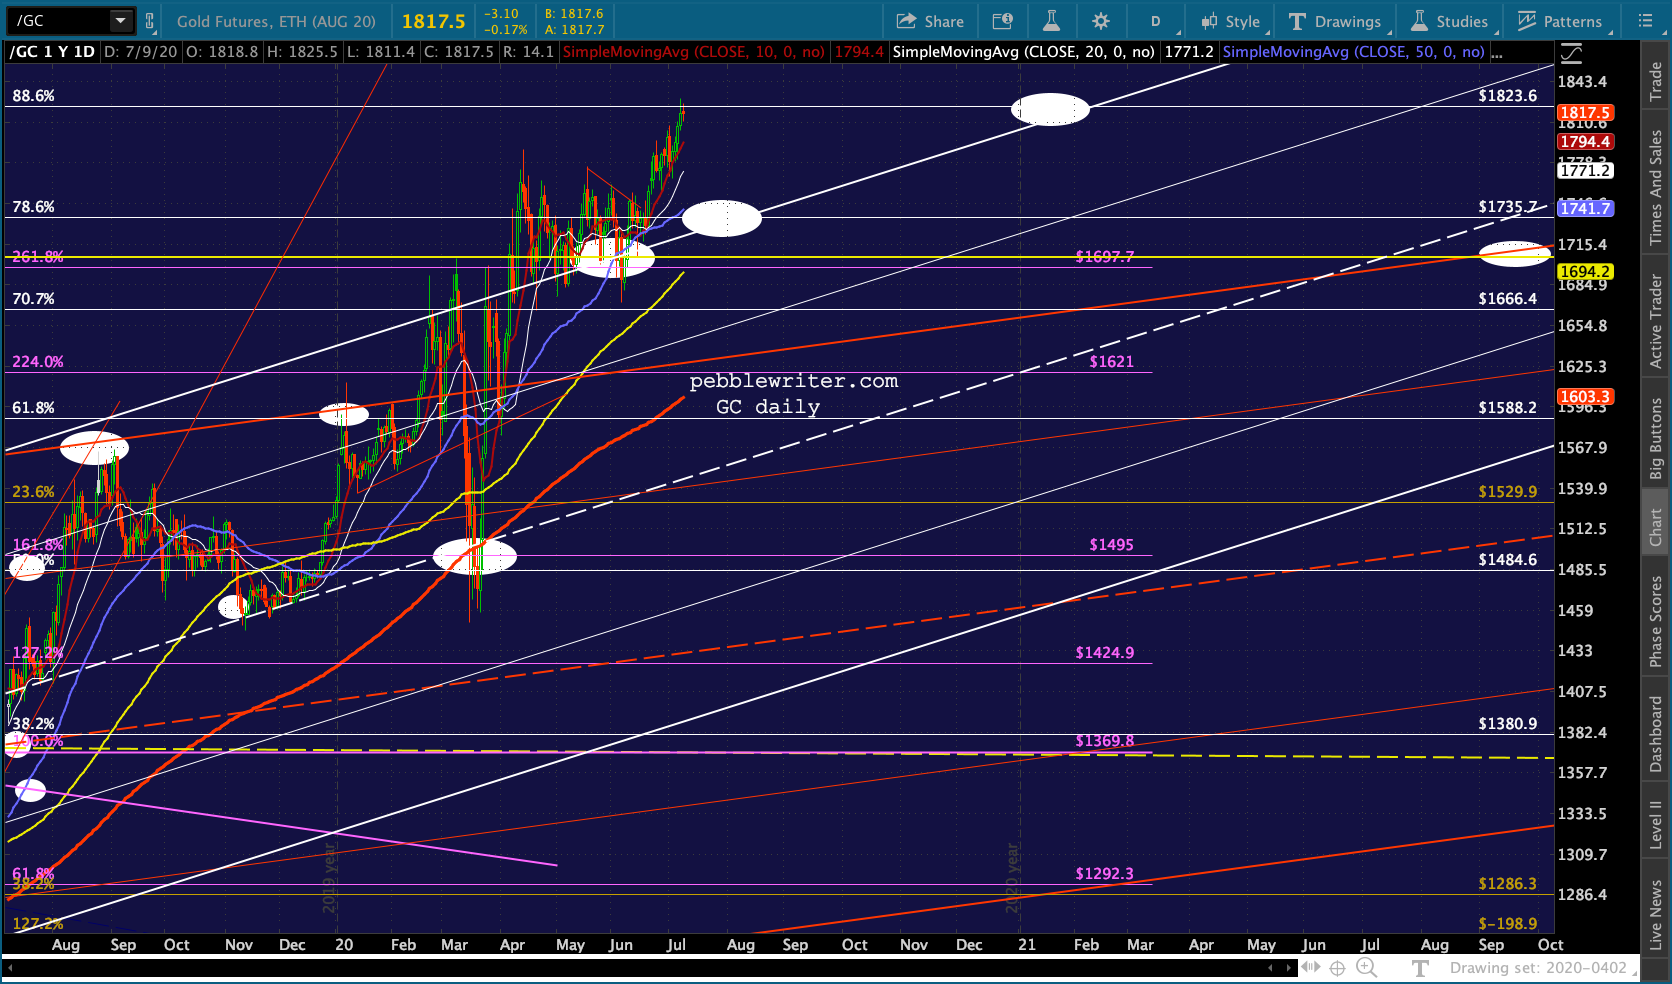 From a charting standpoint, it should reverse here at its .886.
 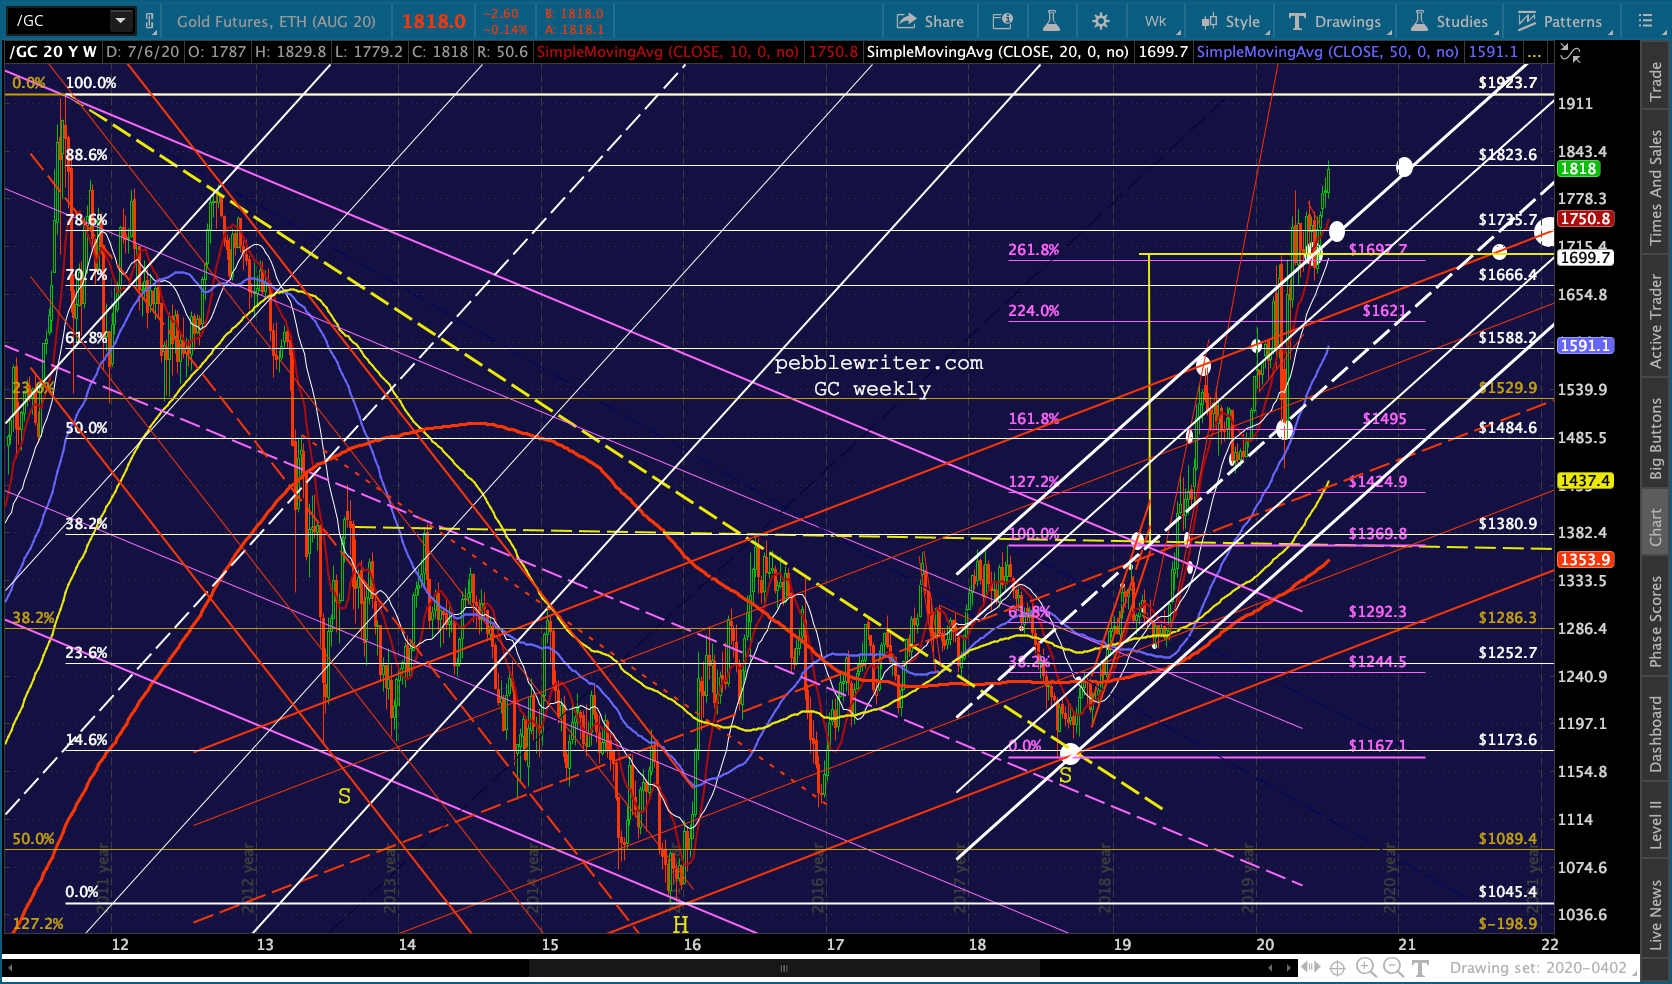 From a fundamental standpoint, of course, the fiscal picture suggests plenty of additional upside. Remember, it broke out of two different rising channels in order to reach this price level well ahead of schedule.
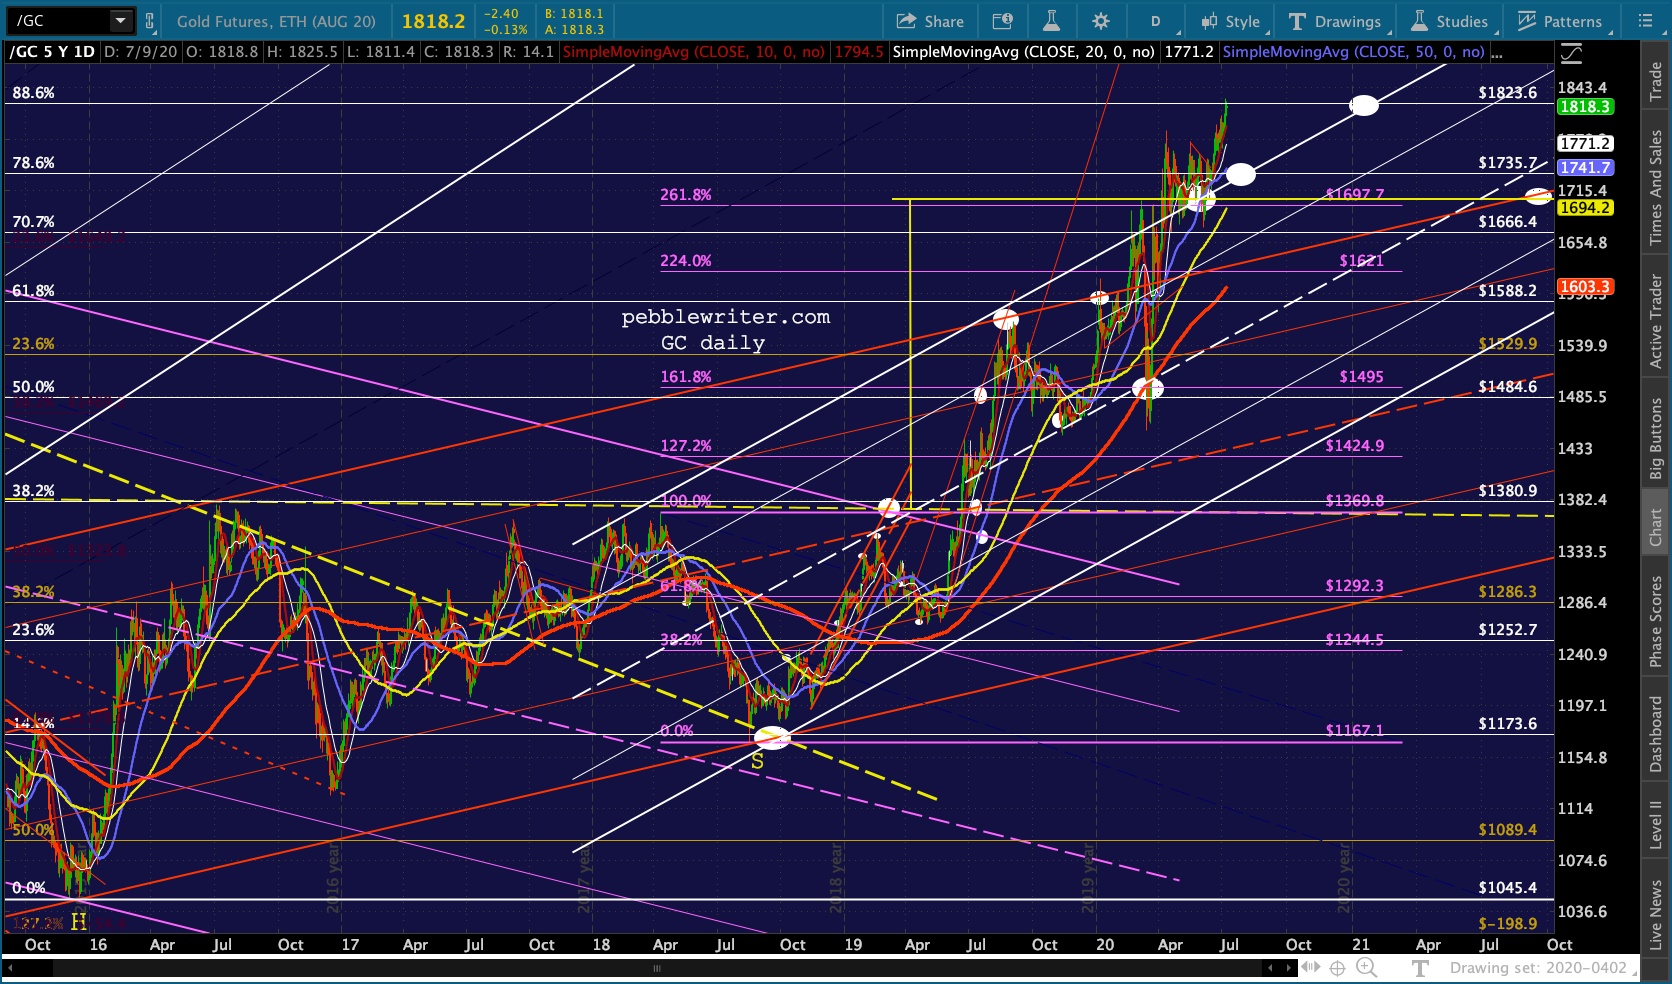 We have to wonder whether a reversal in GC would, as would normally be the case, result in a rally in the long-suffering DXY.
 At this point, dollar bulls would settle for a backtest of the SMA200.
 The euro’s relative strength hasn’t permitted even that – with the recent breakout suggesting it simply won’t happen any time soon.
 The last time stocks sunk, in March, DXY soared and EURUSD plunged. The levitating EURUSD and slumping DXY are positive for equity algos as they represent the opposite scenario.
But, as we discussed in the recent Big Picture post (to be completed shortly), rising gas prices and a slumping USD are problematic from an inflation/interest rate standpoint. Even though the eurozone is doing much better than the US in terms of its COVID-19 response, I don’t see DXY remaining at these levels – whether or not GC retreats.
More on that in the Big Picture post later.
The bond market continues to suggest more downside. The TNX has obviously broken down…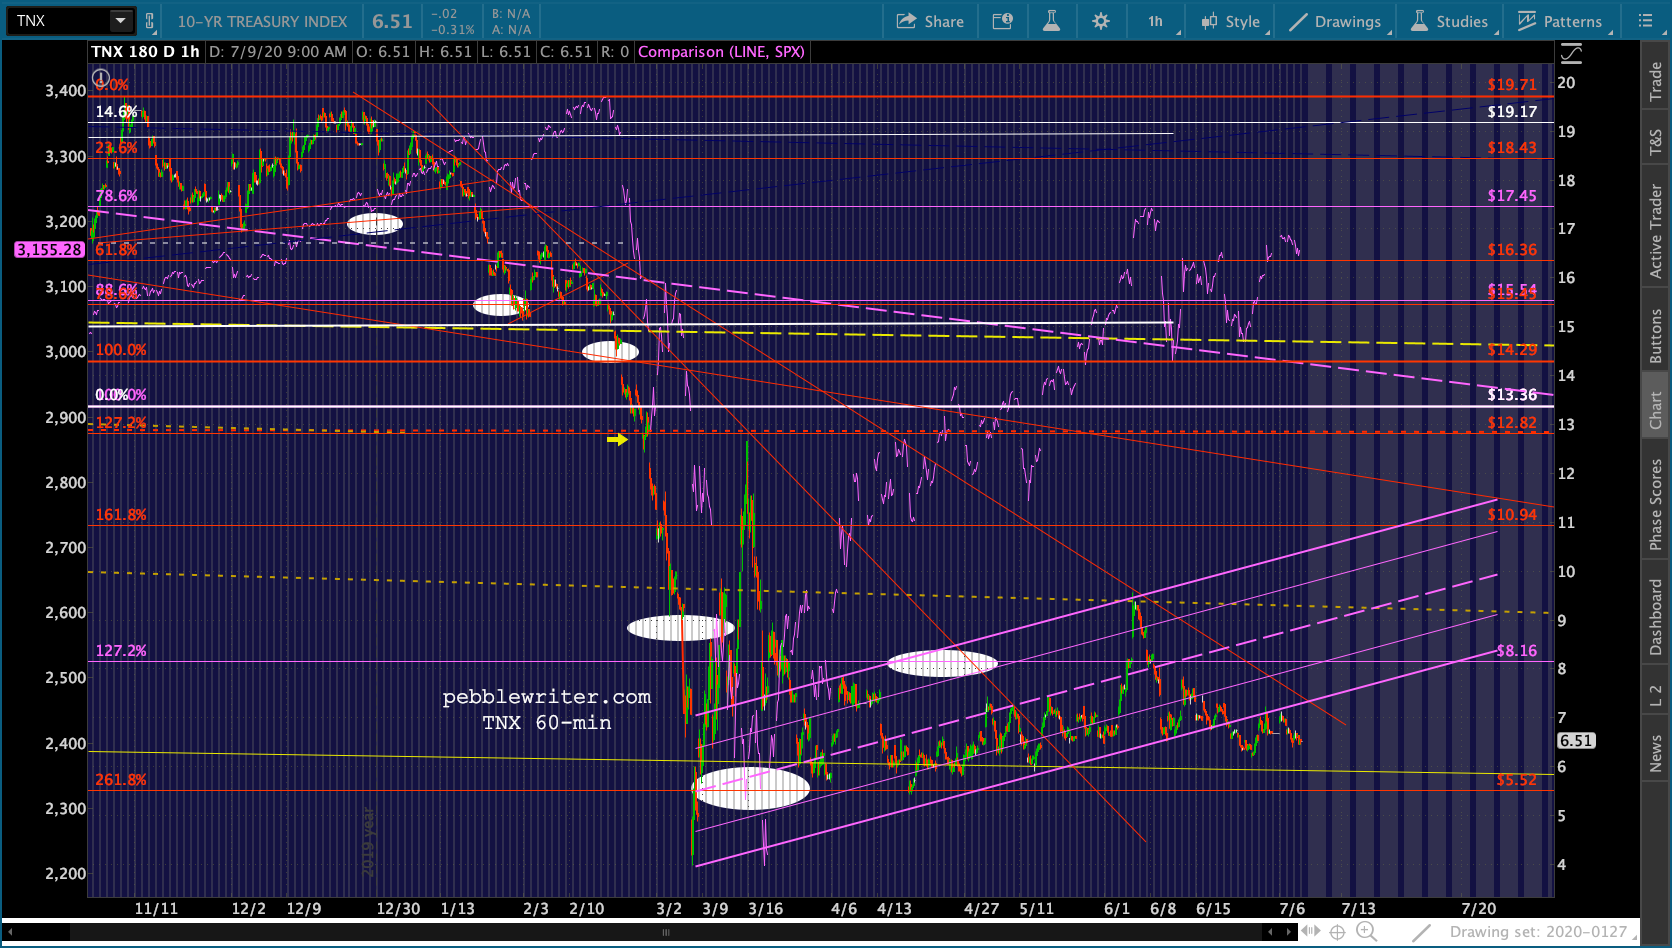
 …as confirmed by ZN’s continued push back above its 1.272.
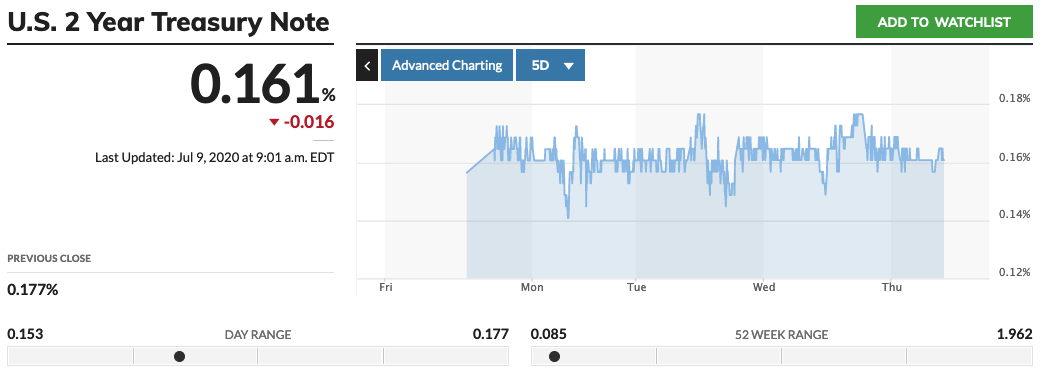
  Since the 2Y needs to remain above support at 16-17 bps…
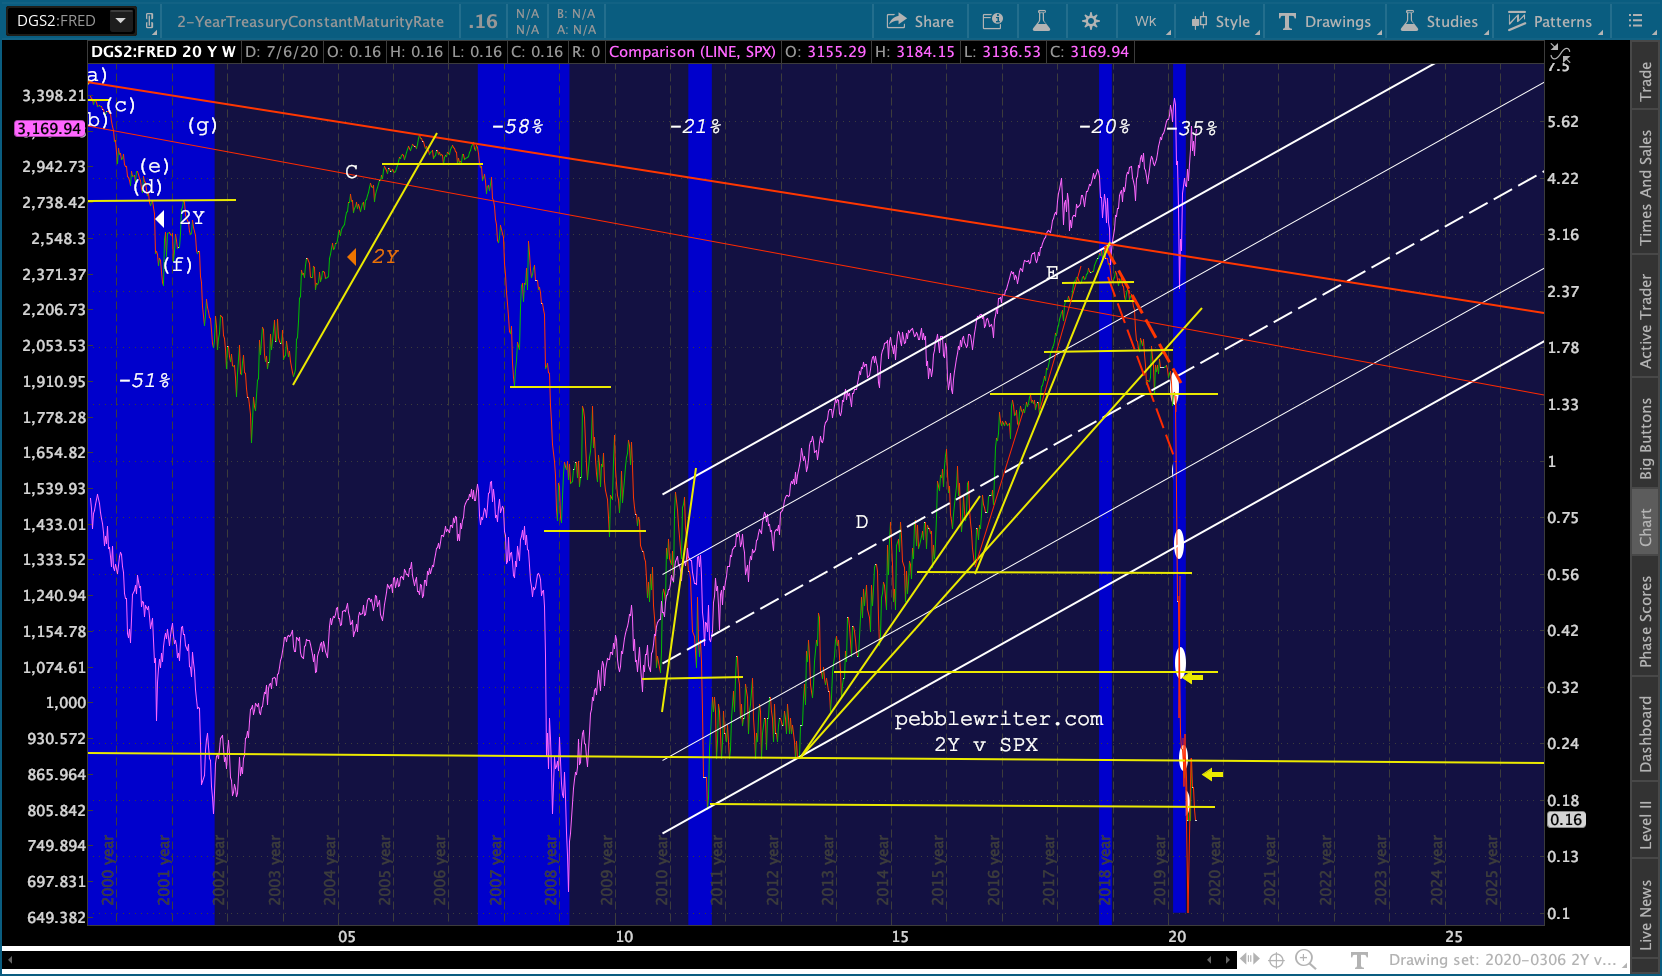
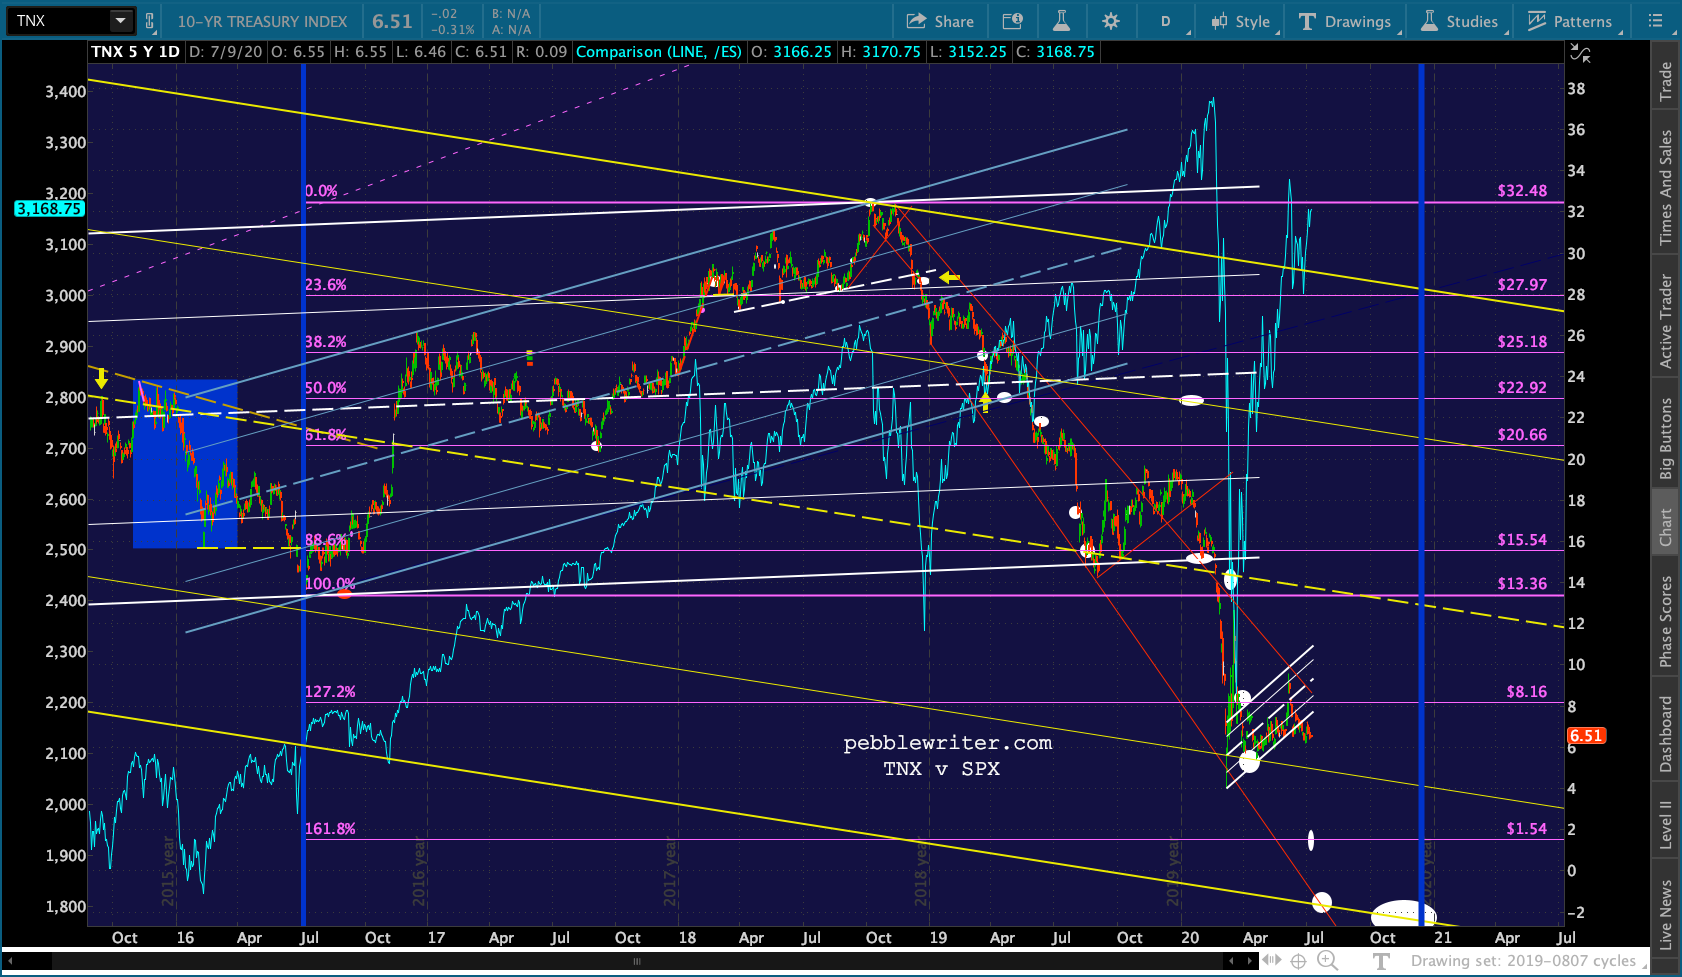
 …this will continue to squeeze the 2s10s, which according to our yield curve model is bearish for stocks.
 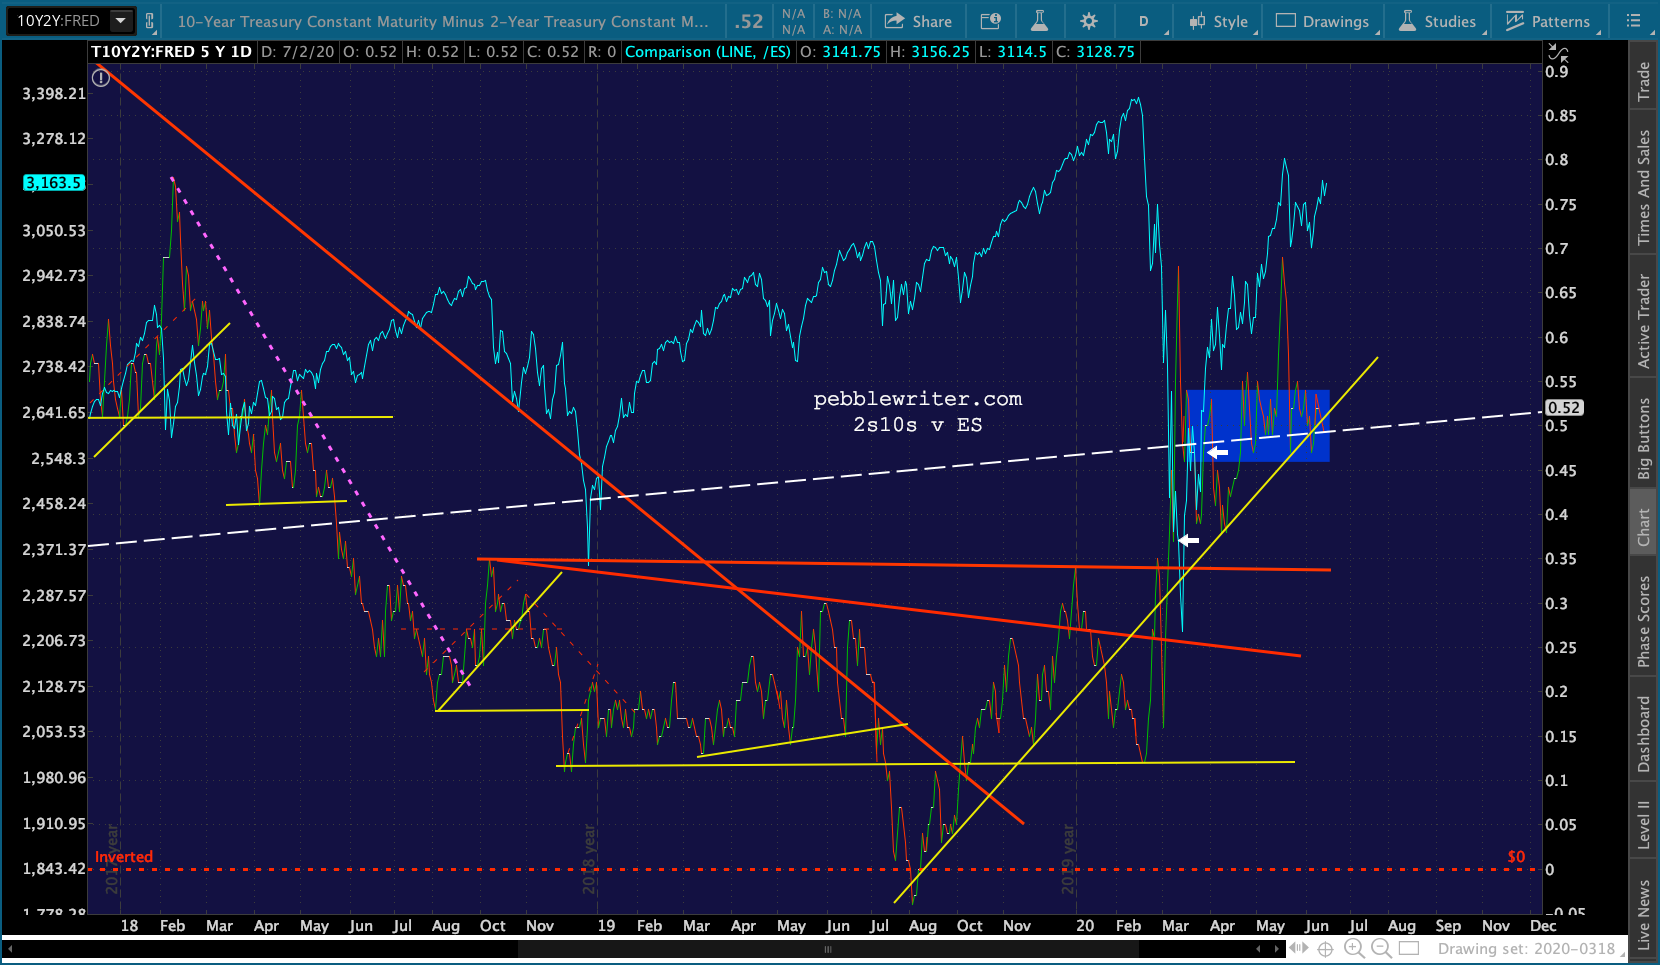 The relationship between the 2s10s has been very positively correlated lately. So, a squeeze in the 2s10s – which might have already begun – won’t go unnoticed by stocks.
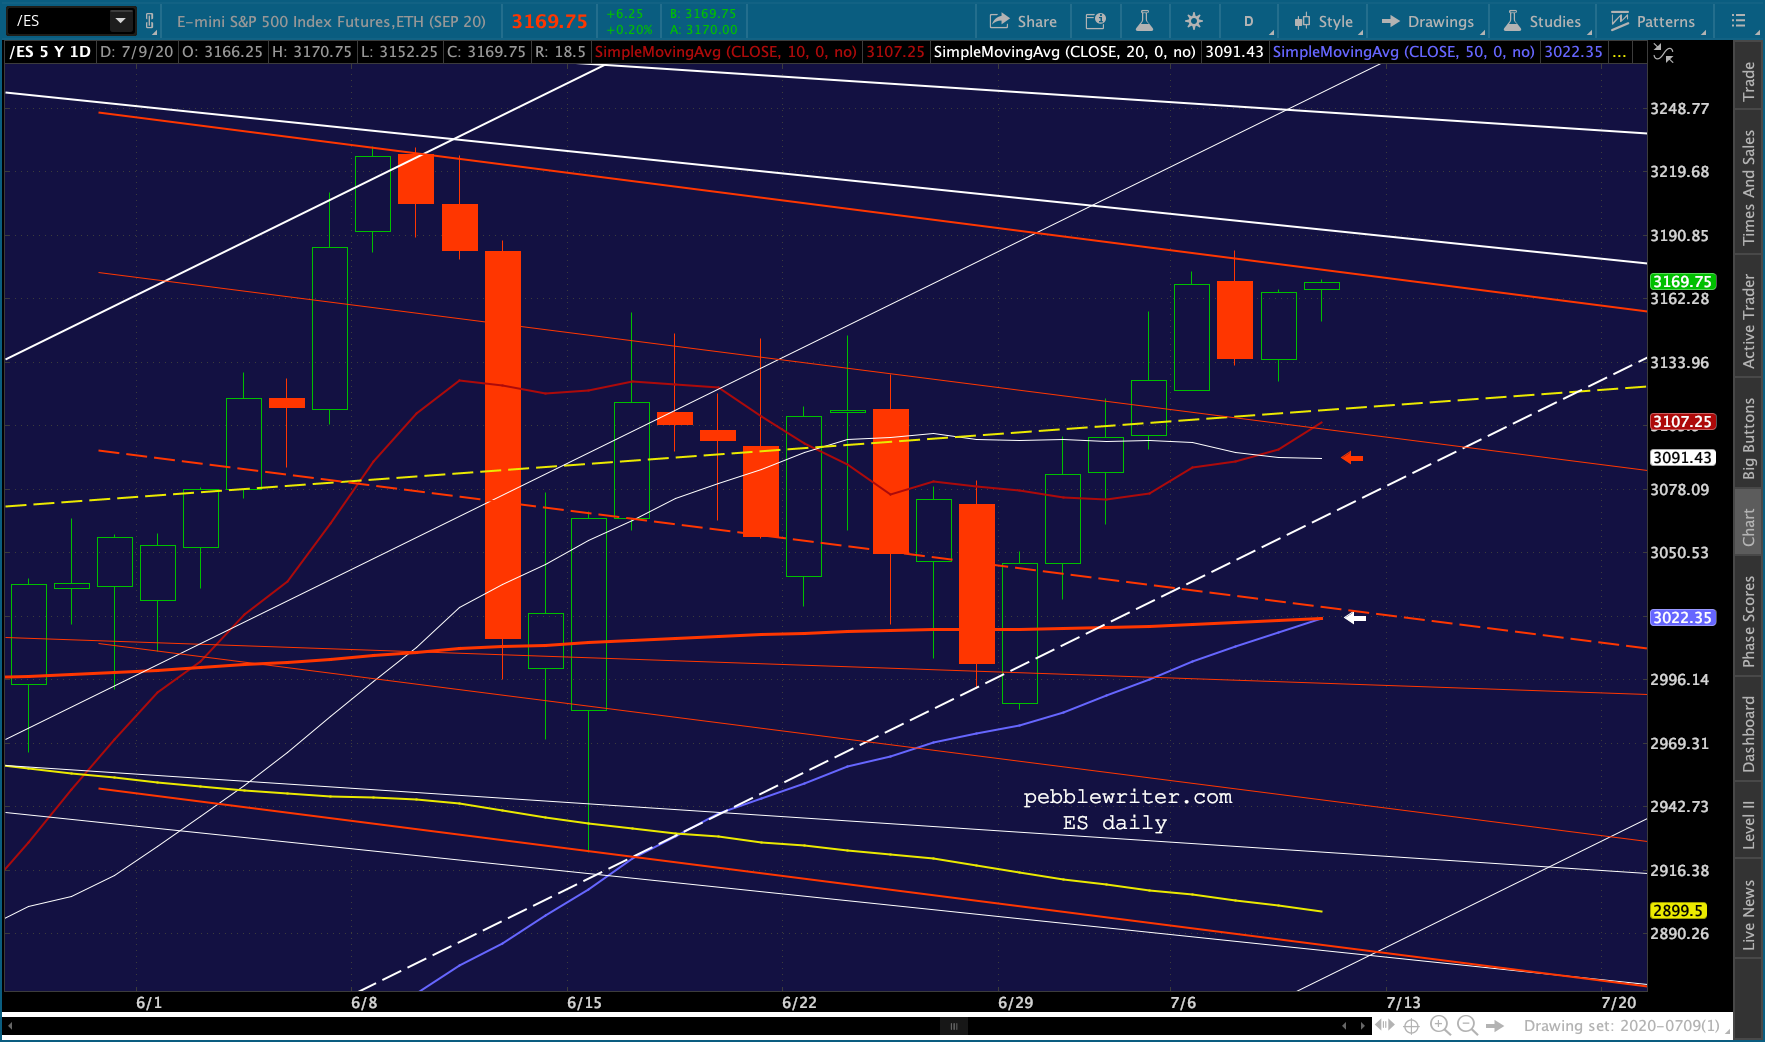
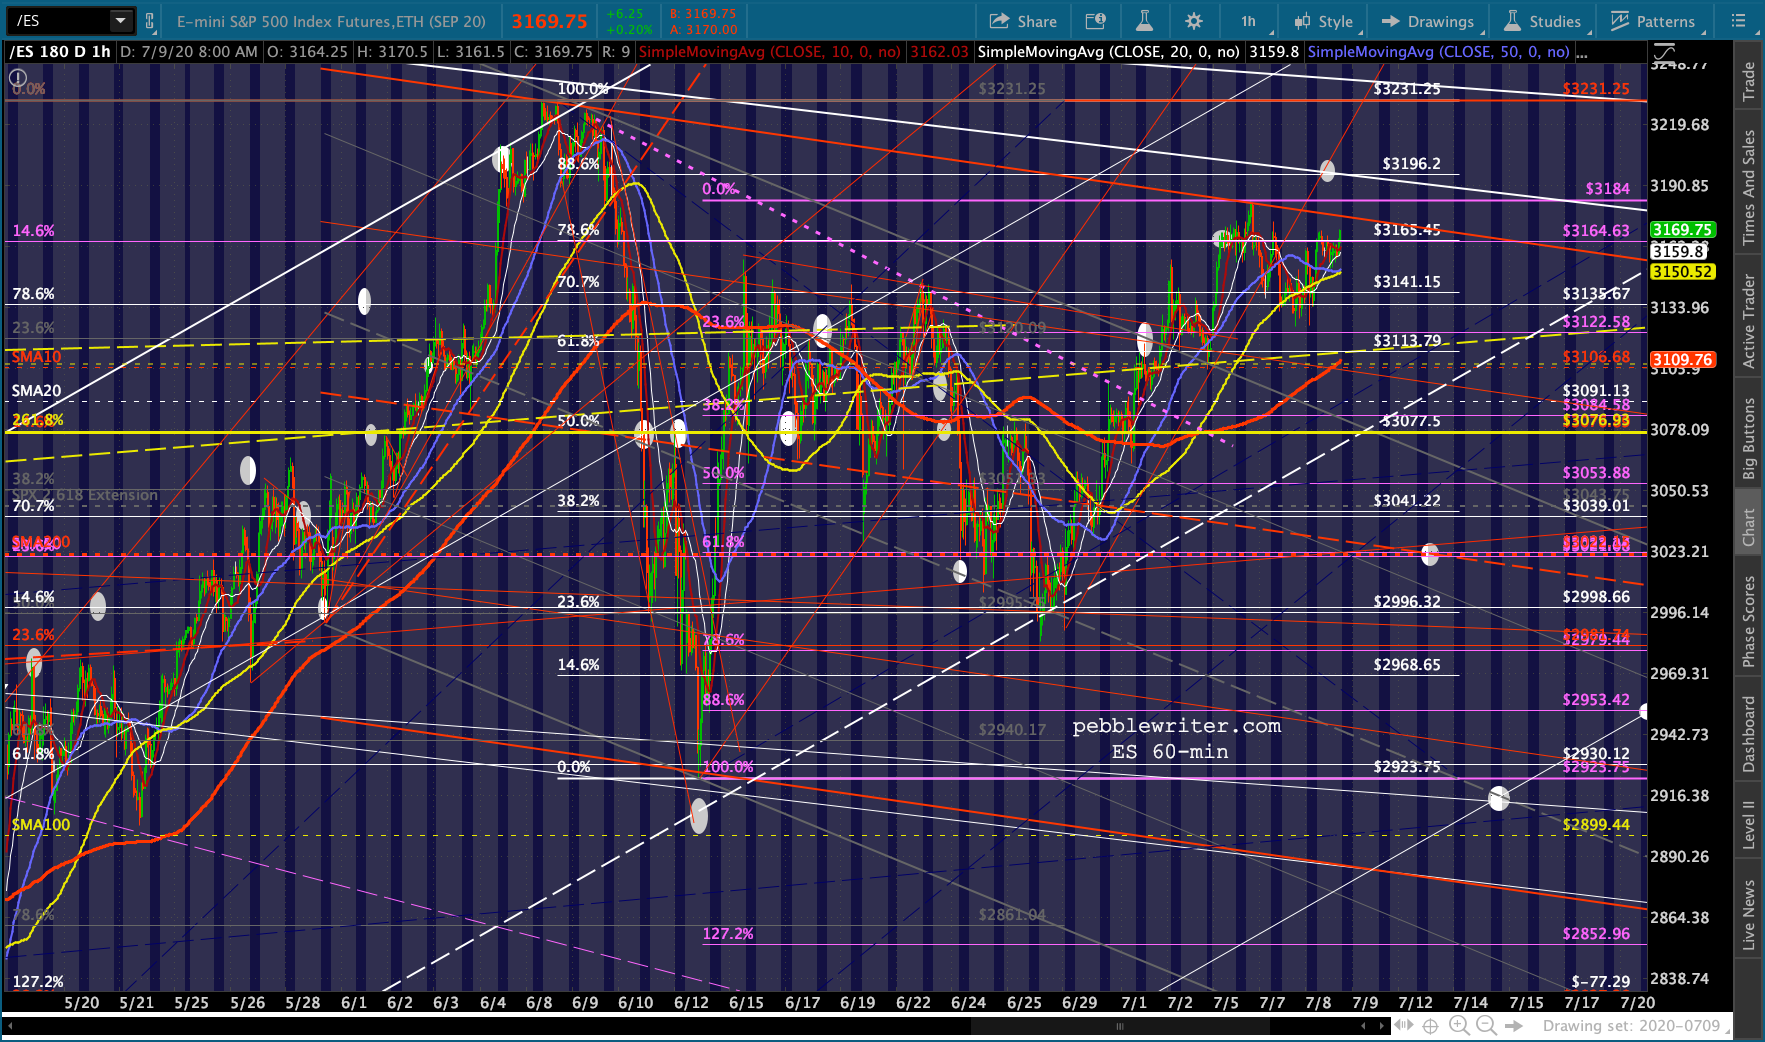
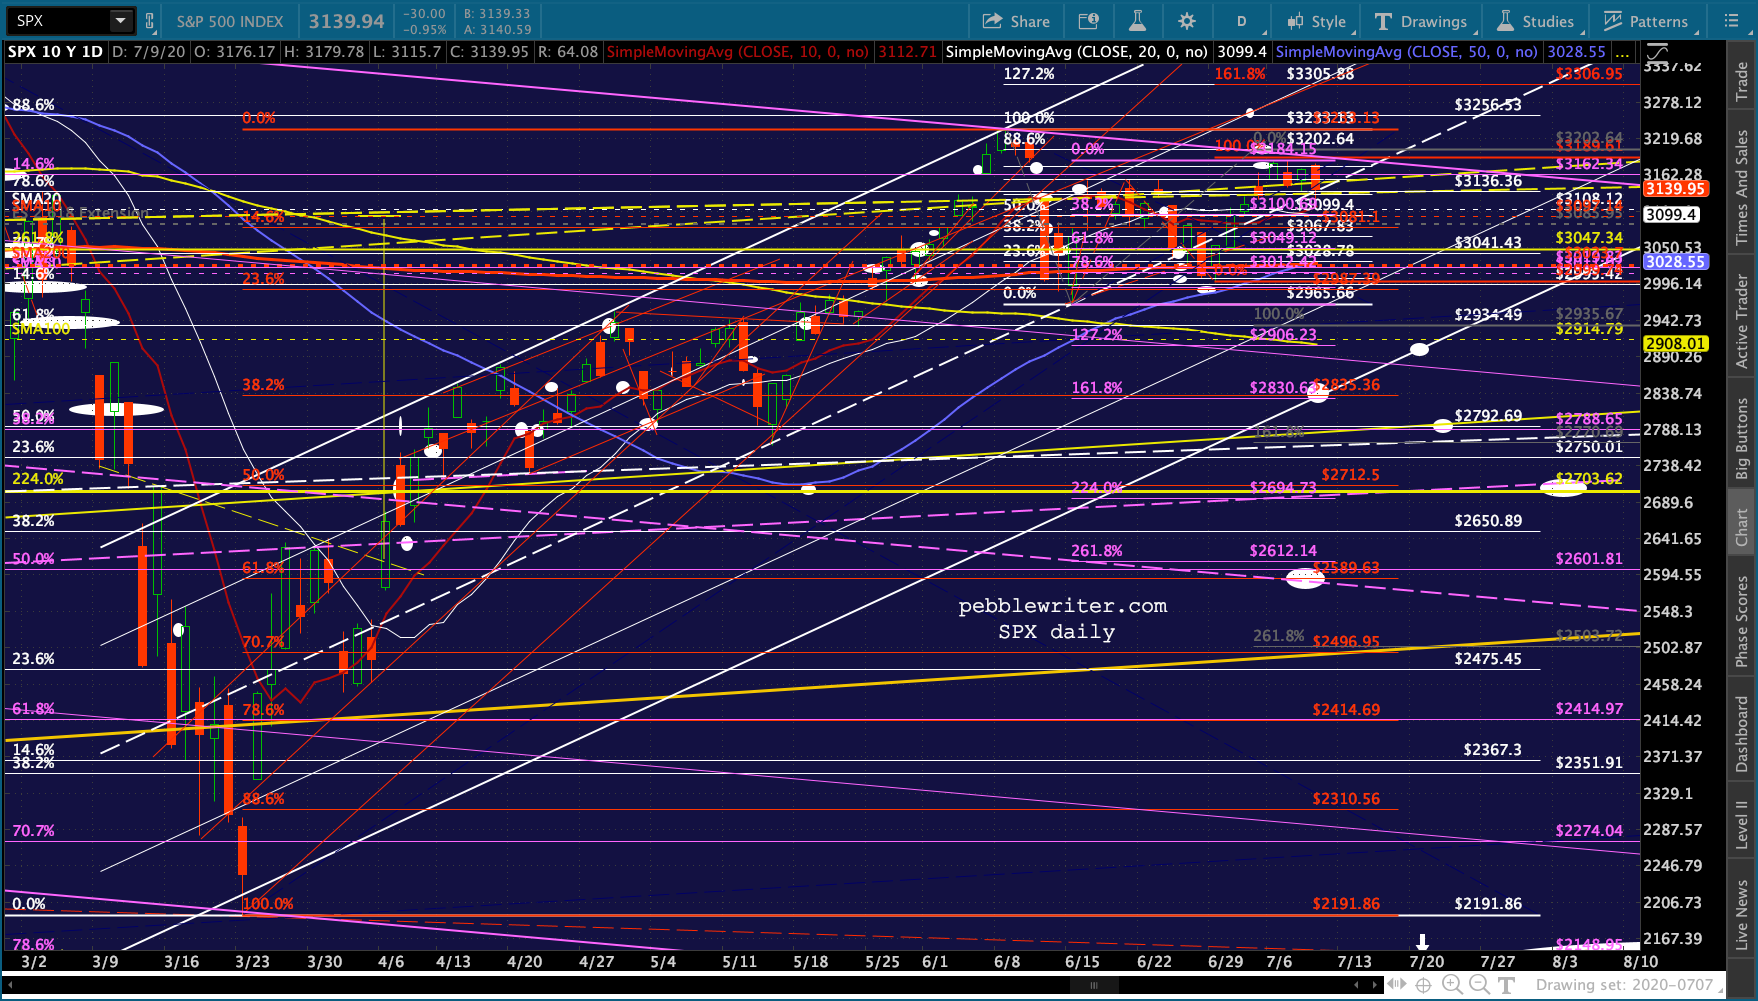
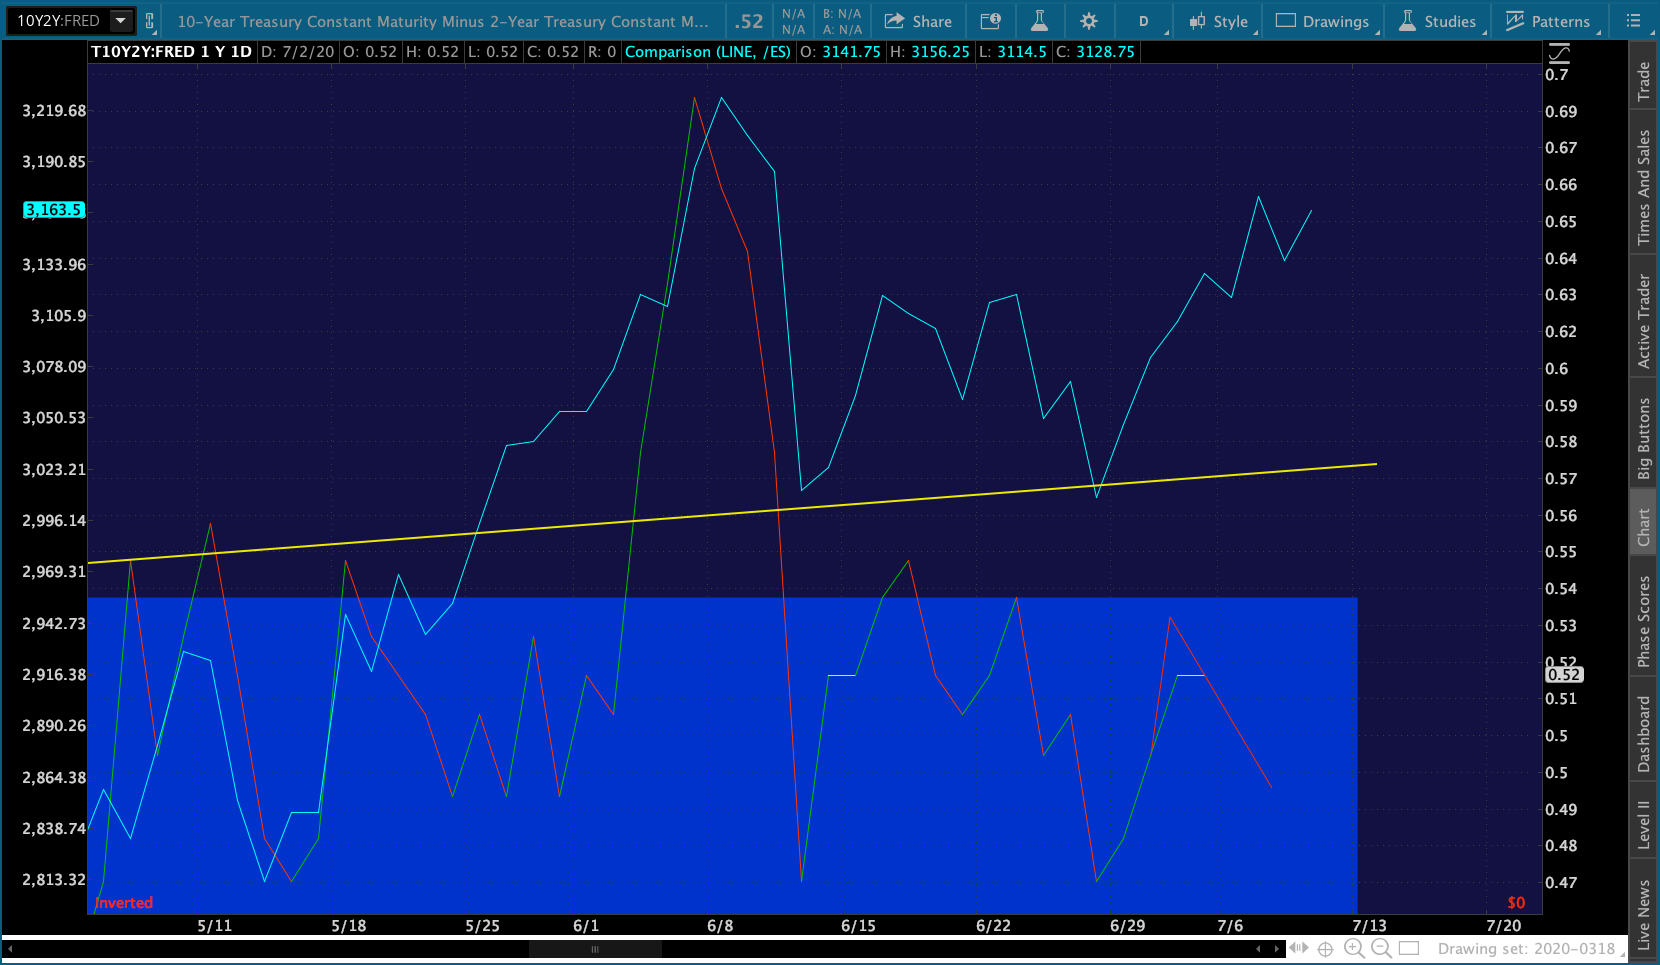 FWIW, the 50/200 cross has happened and cannot be avoided today unless SPX falls to or below 2824.51. Note that the .382 retrace of the rise from 2191 on Mar 23 to 3233 on Jun 8 is at 2835.36, very close to where the rising white channel bottom and the purple 1.618 (2830.63) currently reside. The ES equivalent of SPX 2835.36 is currently 2825.36.
If SPX were to arrive there tomorrow – a 10.83% drop from this morning’s highs – the golden cross would be unwound. No harm, no foul. Obviously a lot of support to break down: the yellow TL and channel midline at 3136, the 2.618 at 3047, all those SMAs, the Jun 15 lows, etc. But, I’d give it at least 50% odds.
more later…