

It’s a big day for economic data. The GDP second estimate came in on target at 33.1%, as did the GDP deflator at 3.6%. Durable orders beat at 1.3% versus 0.8% forecast. But, it was Initial Claims at 778K versus consensus of 735K that necessitated a quick dip to yesterday’s lows in VIX.
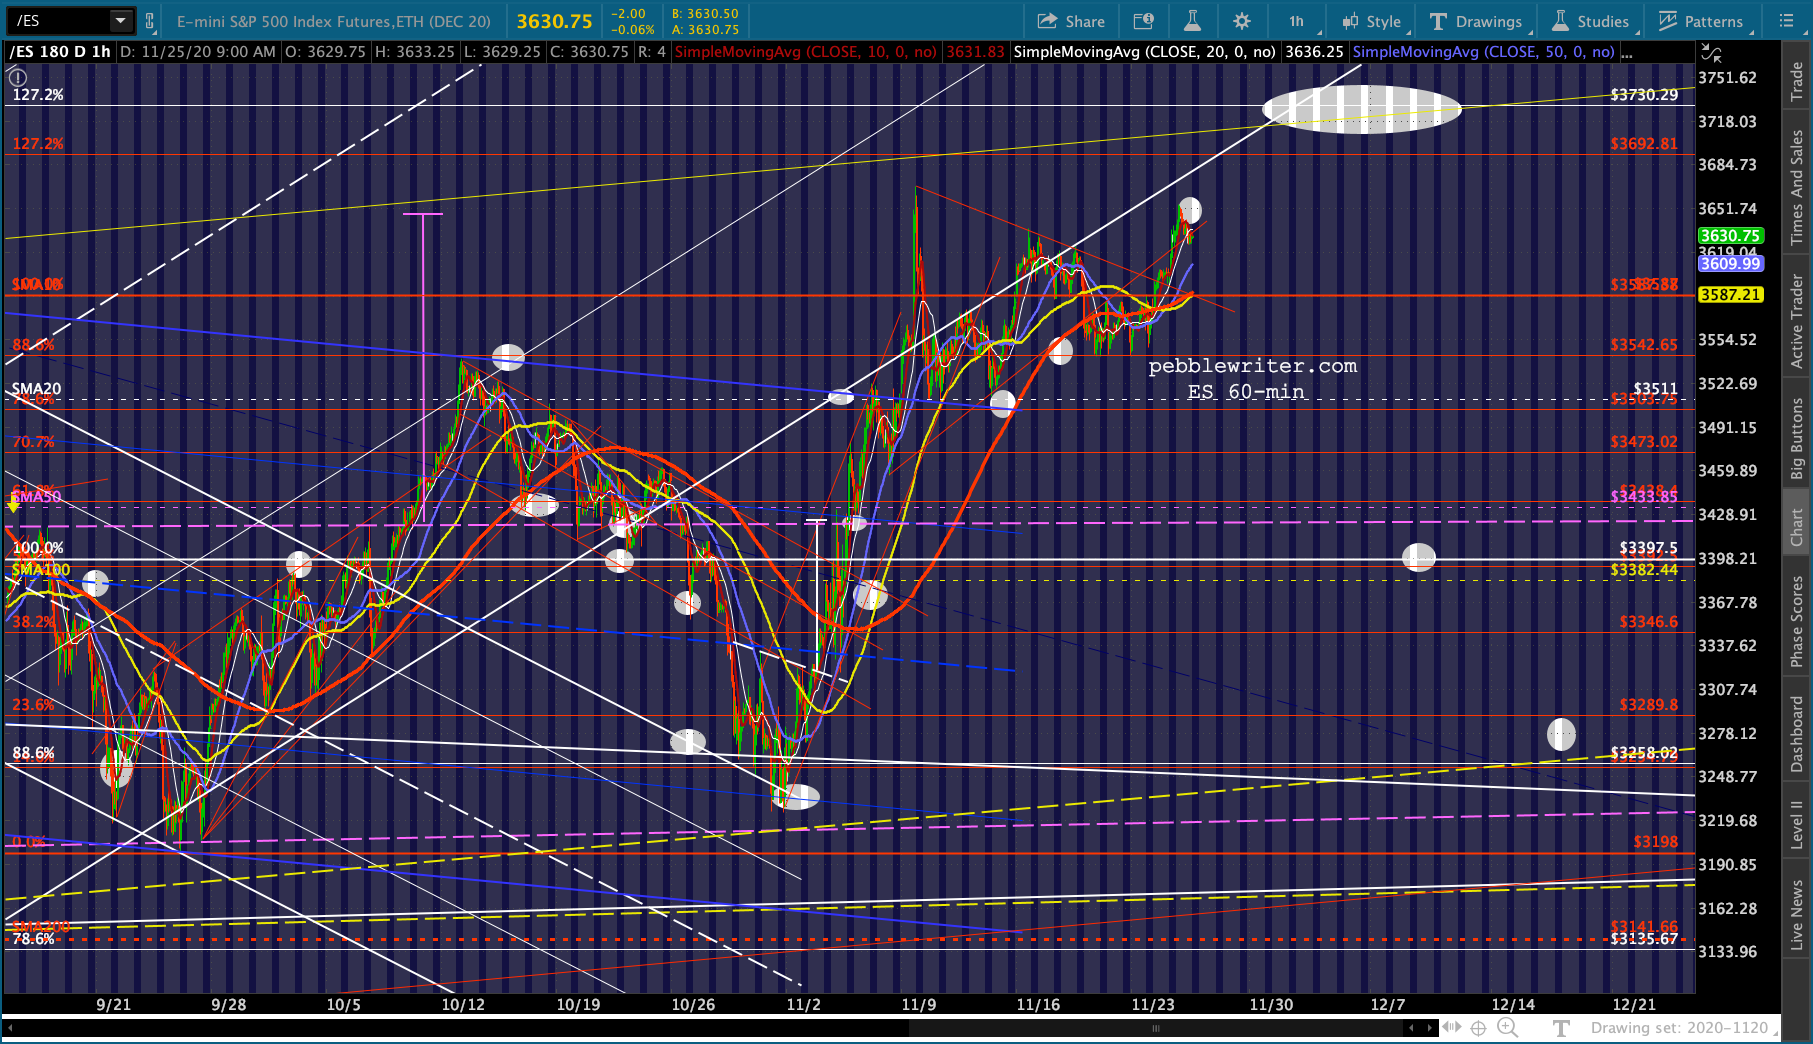
 As a result, ES is back to flat after backtesting its broken channel overnight.
  continued for members…The bigger picture:
Note that SPX has reached a TL connecting the Jan 2018 and Feb 2020 highs – shown below in purple.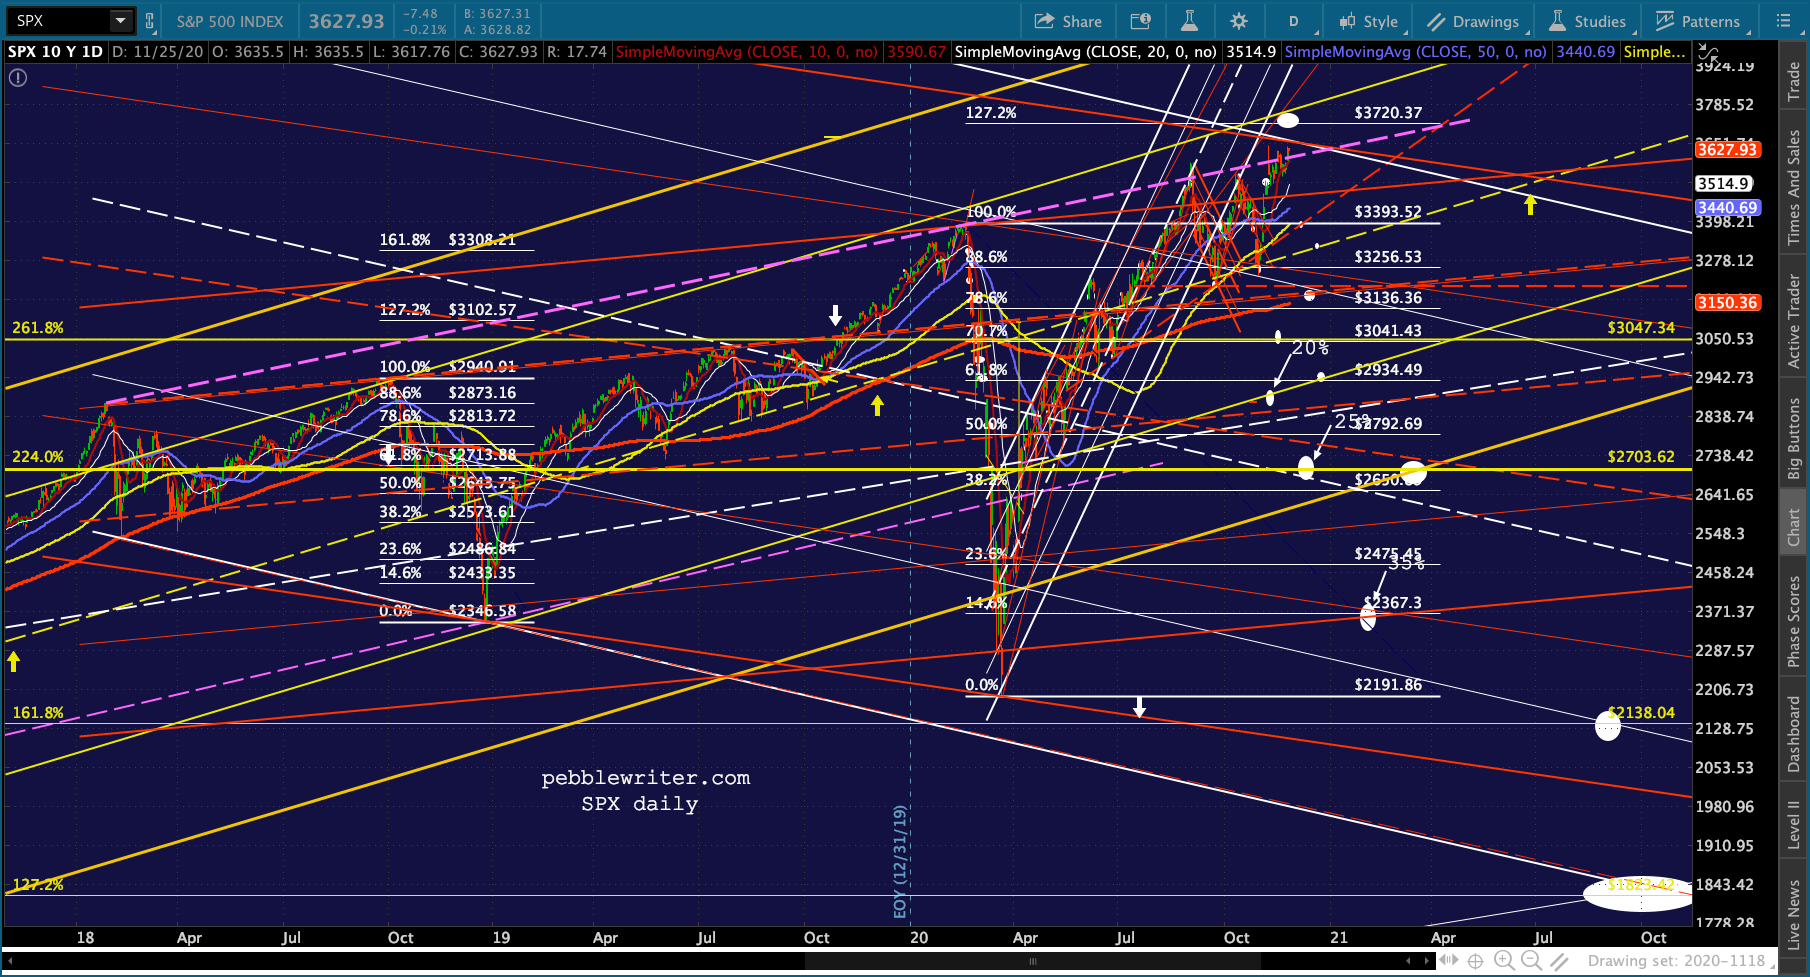 While ES continues backtesting its broken channel.
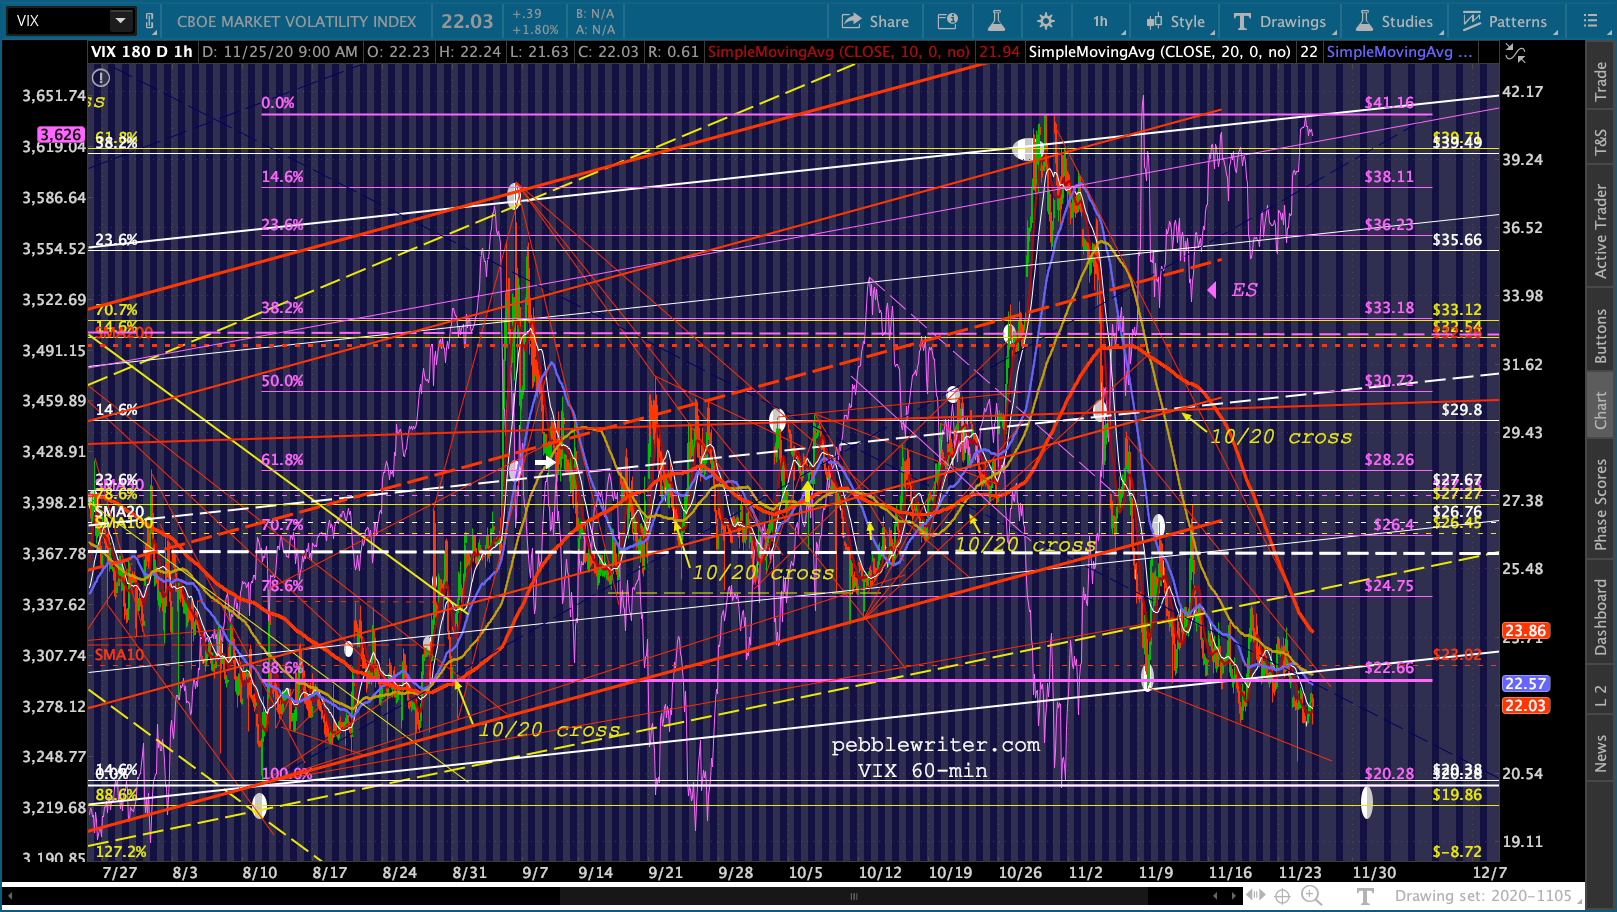
 Remember, VIX never quite reached its .886 at 19.86. I assume that’s a live target for the current breakdown (the red channel) that started at 26 on Sunday Nov 8 – which enabled ES (then 3505) to break out from a falling channel.
 Can it fall below the .886? Absolutely. Remember the tail end of 2019, when it broke below that red channel bottom (twin yellow arrows) from the Nov 24 2017 lows at 8.56. By continually inching lower and remaining broken down…
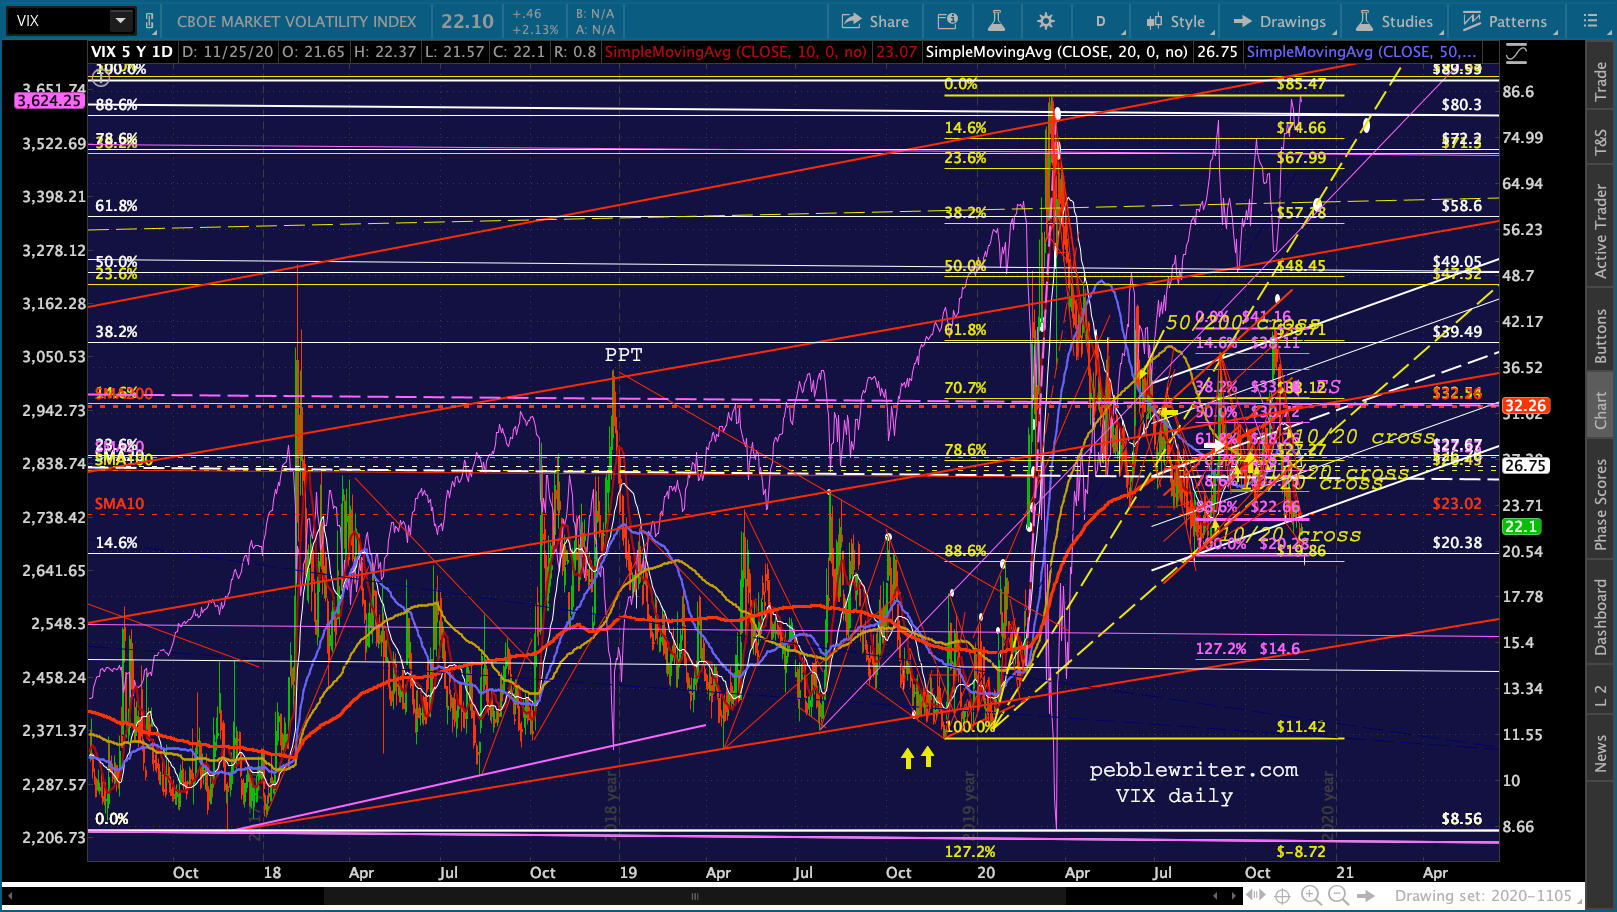 …it enabled ES’ breakout from the rising white channel and above the 2.618 Fib extension at 3076. It’s as clear as can be in retrospect. But, of course, it didn’t hold. Neither did the rising yellow channel’s bottom – though TPTB have more than made up for that breakdown.
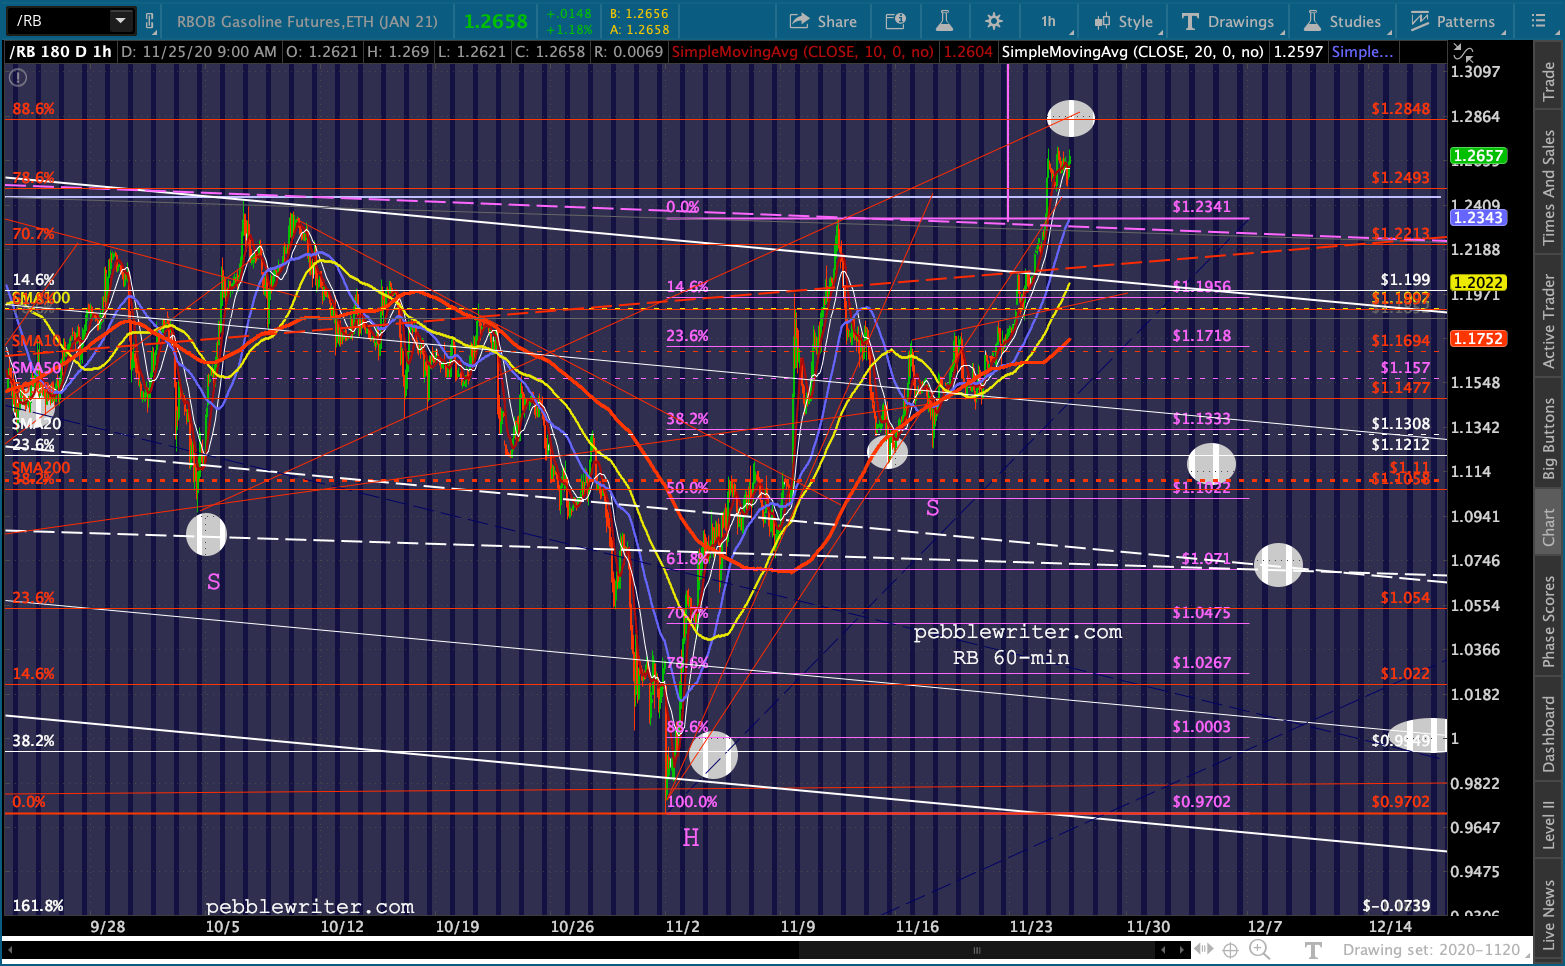
 CL and RB continued their meltup.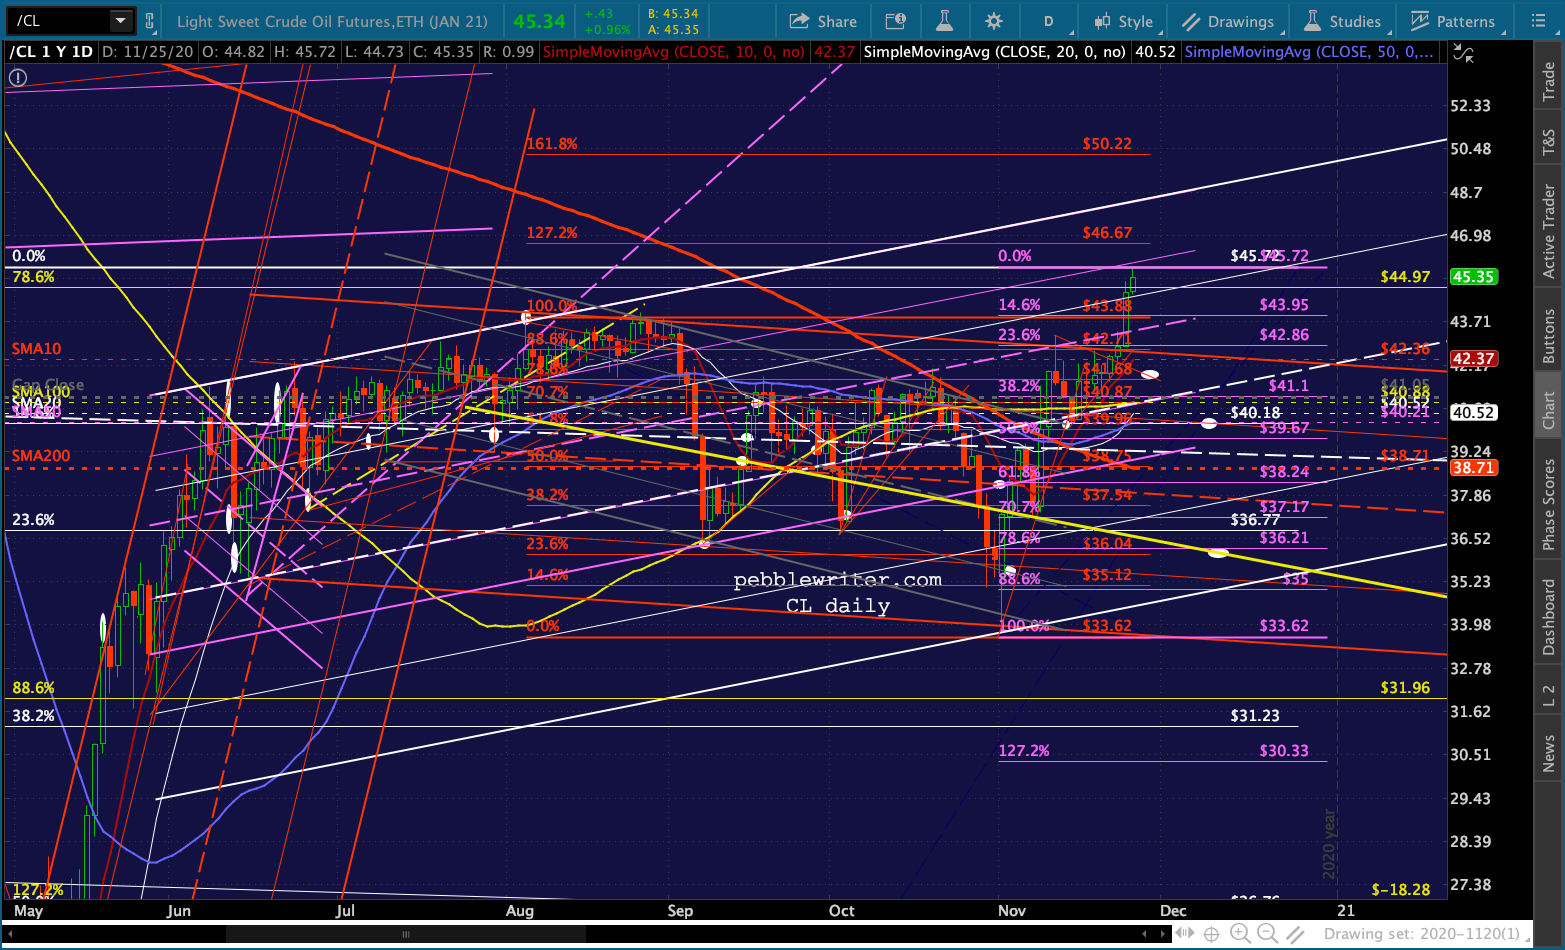
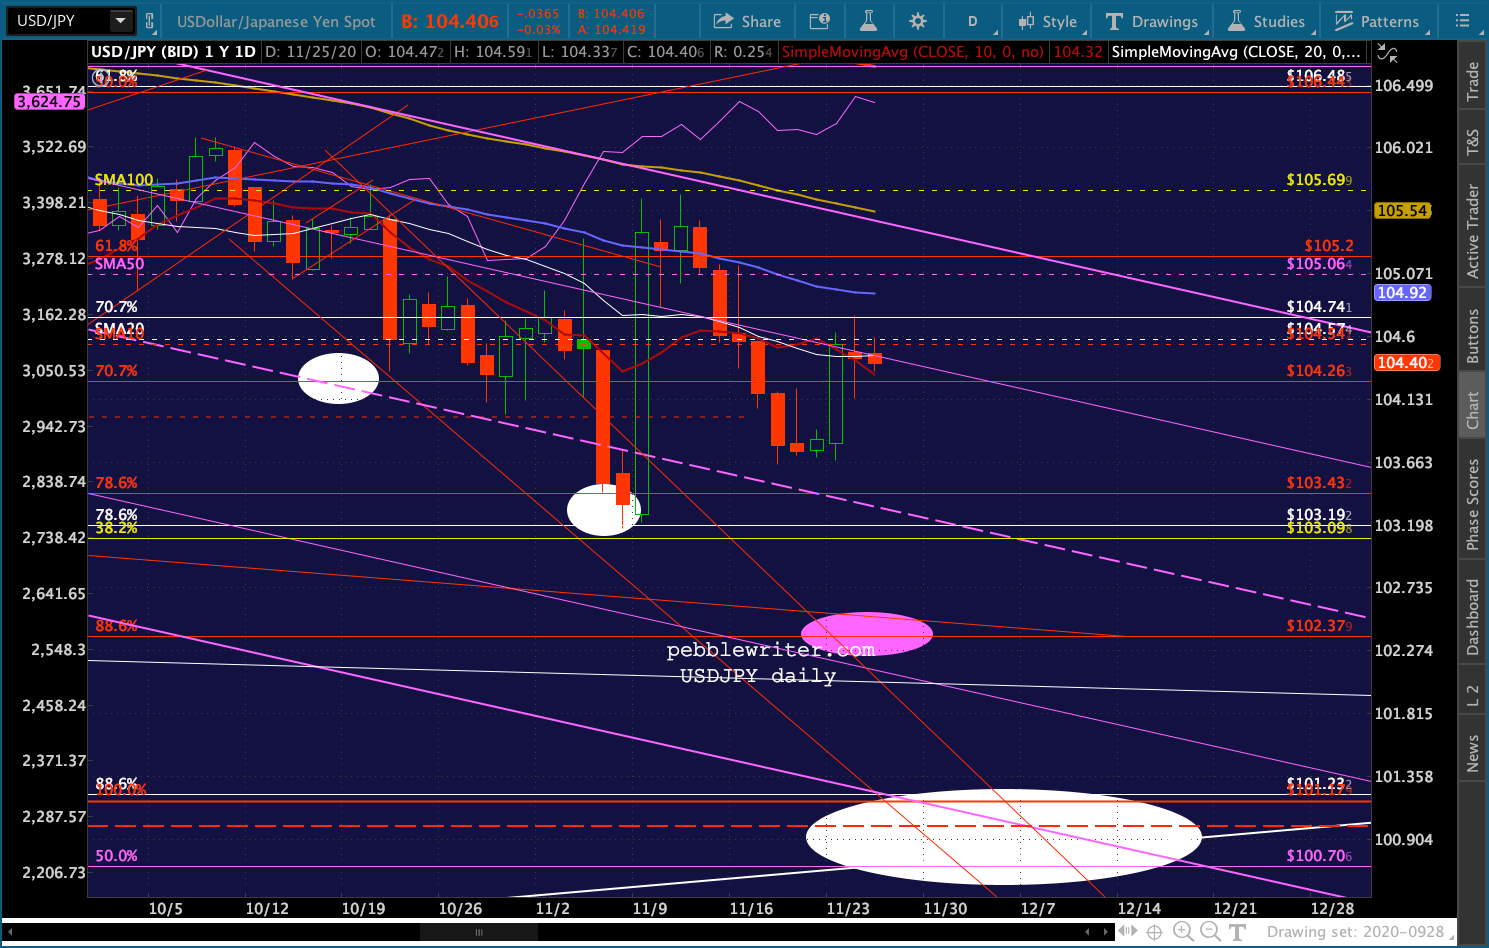
 While USDJPY (though still in a bearish 10/20 cross) managed another day without a breakdown…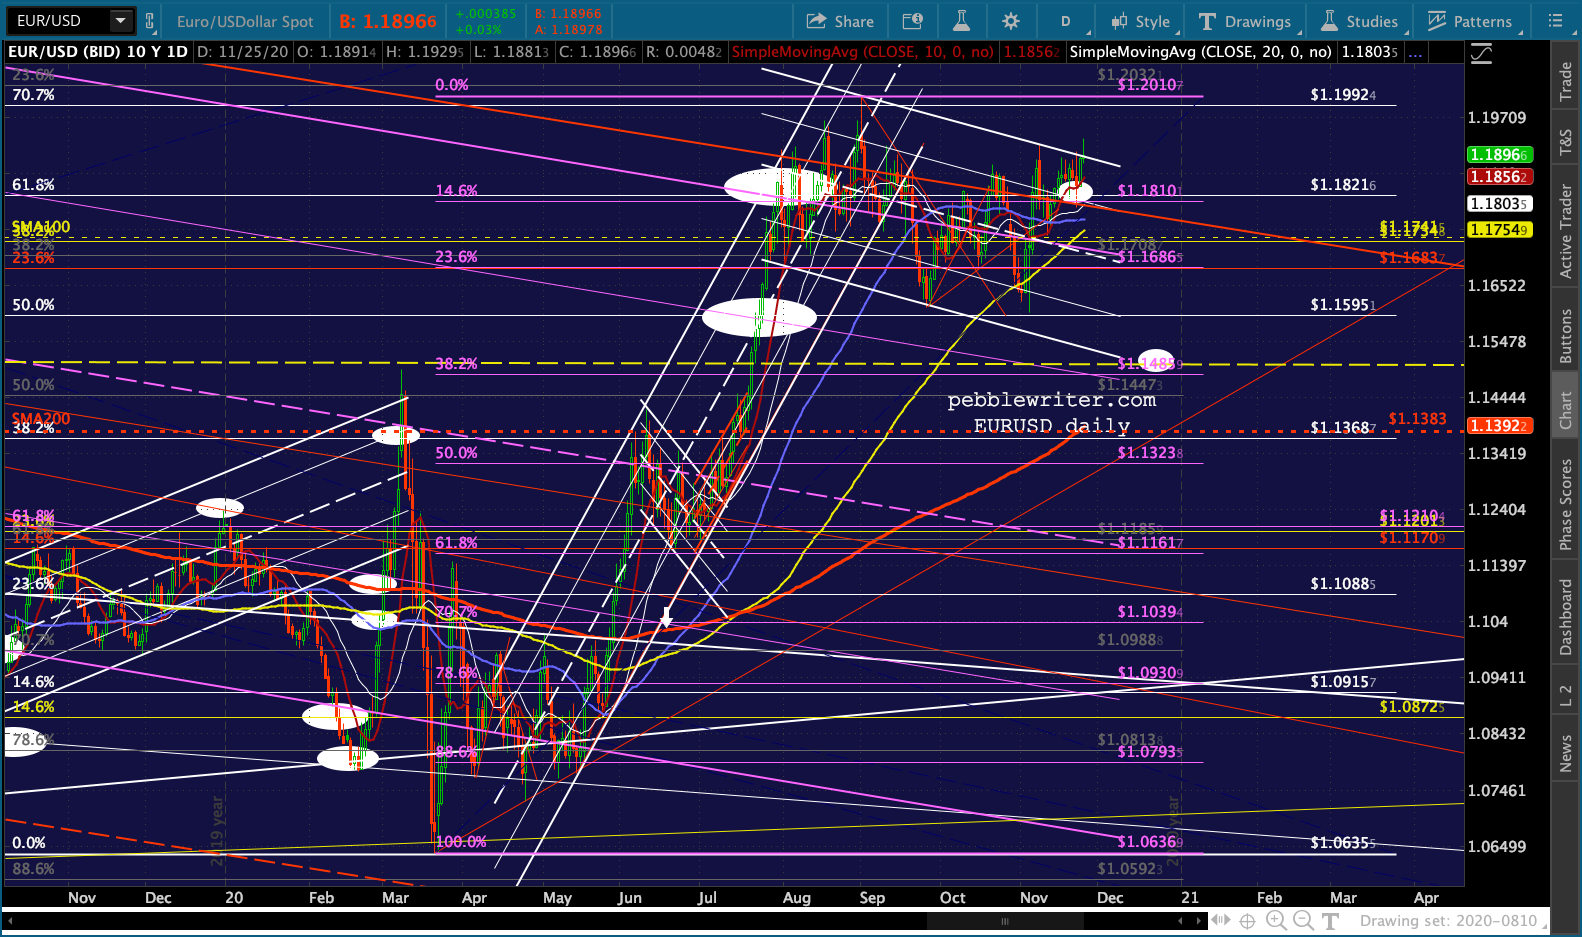
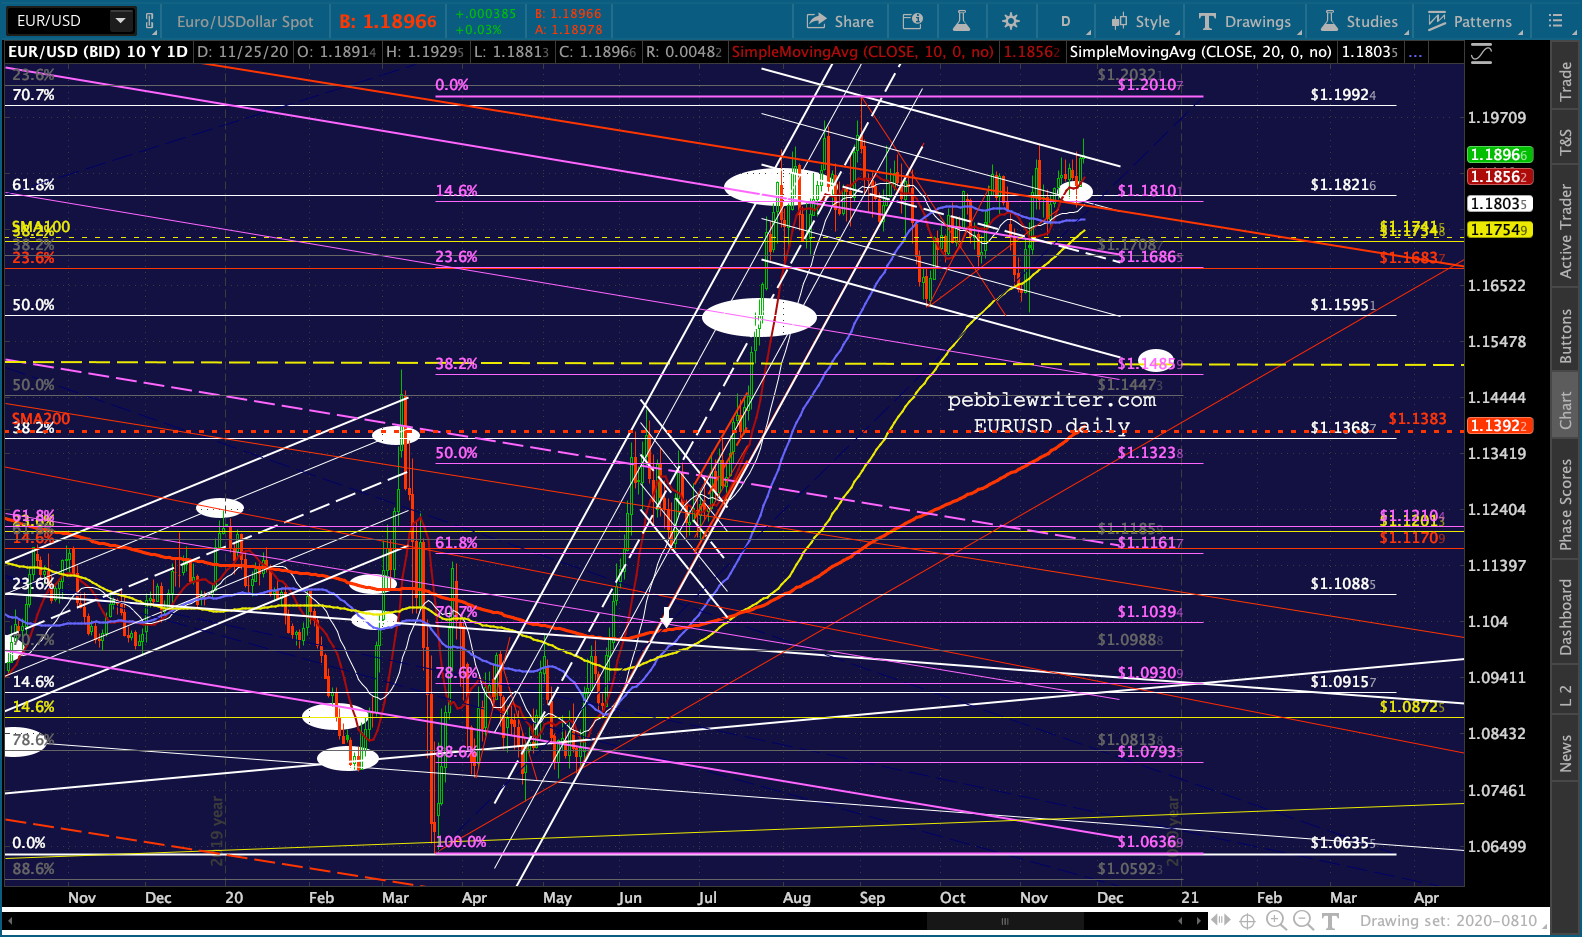
 EURUSD’s brief flirtation with a breakout…
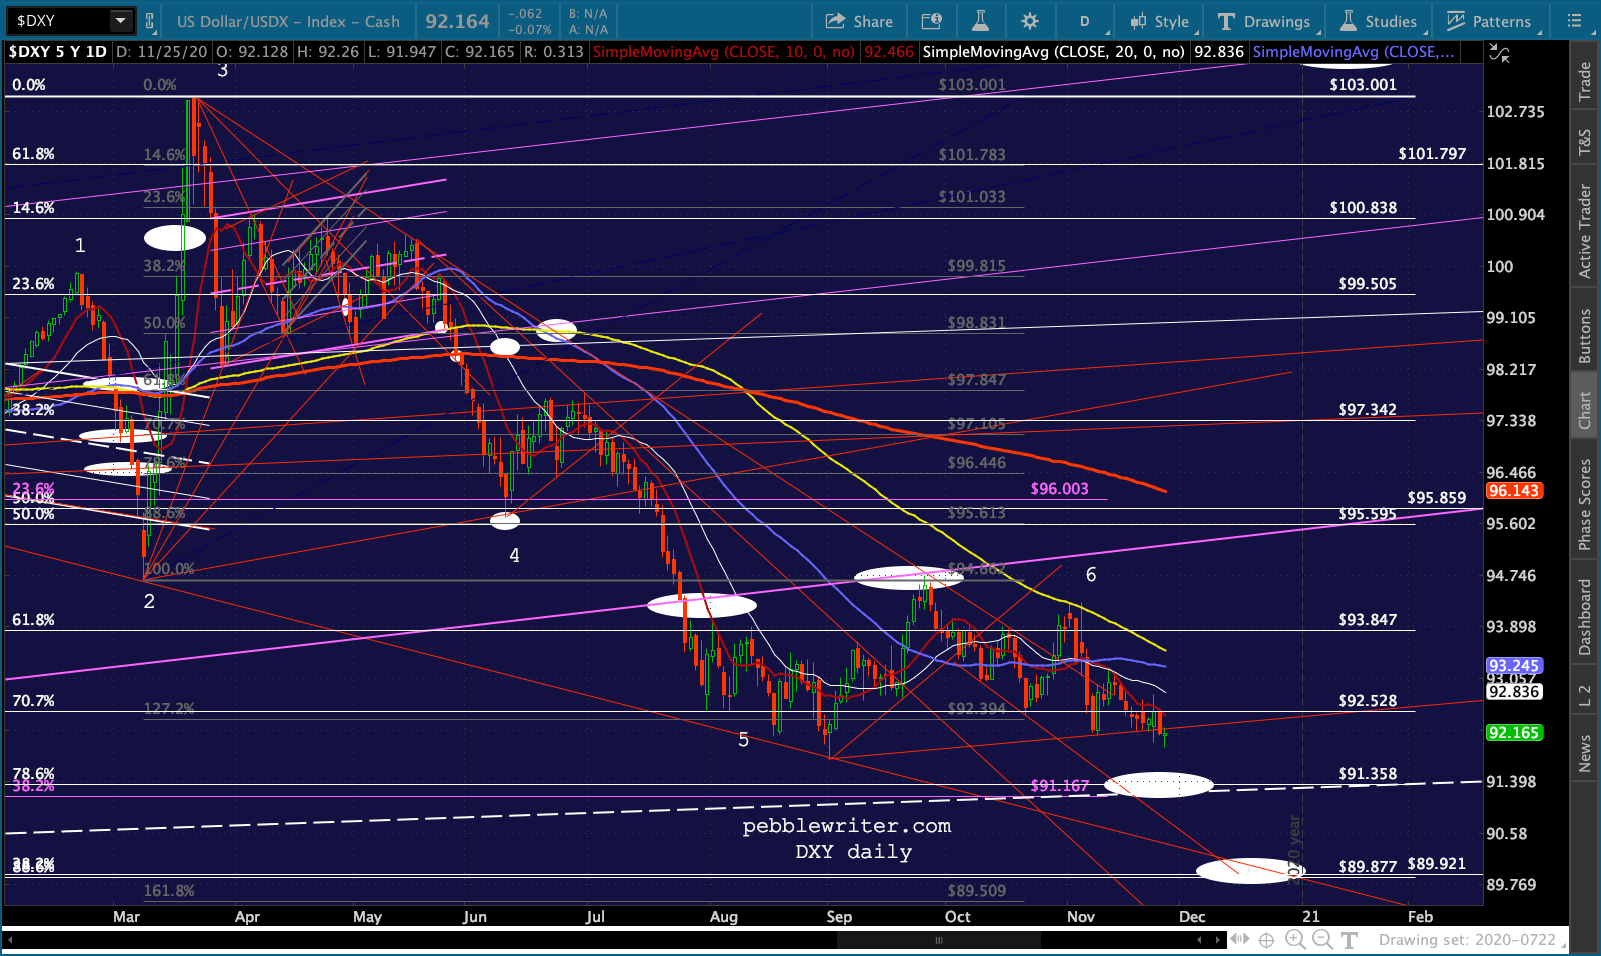
 …is enabling DXY’s slow motion decline.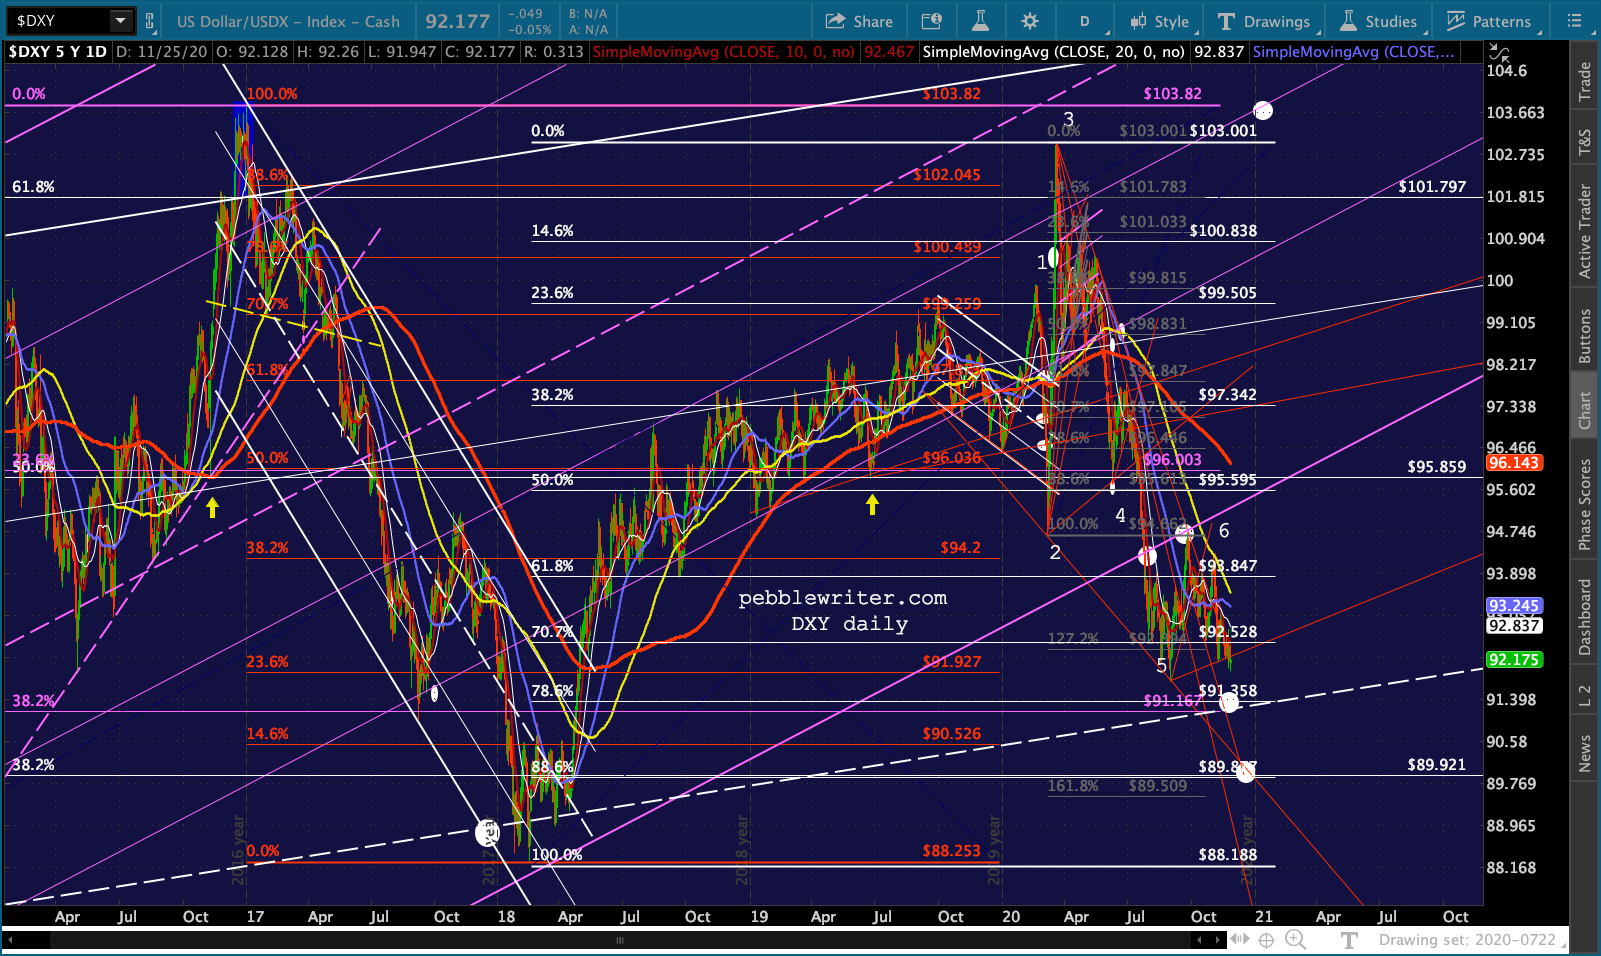
 more later...