

We noted back on July 9 [see: Moment of Truth] that GC had reached our long-held 1823.60 target well ahead of schedule.
From a charting standpoint, it should reverse here at its .886 Fib retracement. From a fundamental standpoint, of course, the fiscal picture suggests plenty of additional upside. Remember, it broke out of two different rising channels in order to reach this price level well ahead of schedule. We have to wonder whether a reversal in GC would, as would normally be the case, result in a rally in the long-suffering DXY.
We were still bearish on DXY, so the potential for a reversal in GC seemed limited.
As it turned out, the fundamental picture won out. Though it took it about 9 sessions, it finally pushed above its .886 retracement, and then its former all-time highs – breaking out of rising channels in an explosion up to 2089.20.
 We got a (quite violent) backtest of 1823 as expected, followed by six weeks of sideways consolidation while pretty much everybody waited for Congress to approve another round of stimulus. Unfortunately for GC, the stimulus never came.
Since then, GC has been settling lower in a falling channel which pointed to a rendezvous with the 200-DMA – which was breached on Friday. This is a significant breakdown which implies a troubled path forward. But, there are other factors at work.
continued for members…First, the big picture for stocks:
ES has backtested its SMA10 – a nice start, but only a start until we see it break below it and, ultimately, a bearish 10/20 cross.
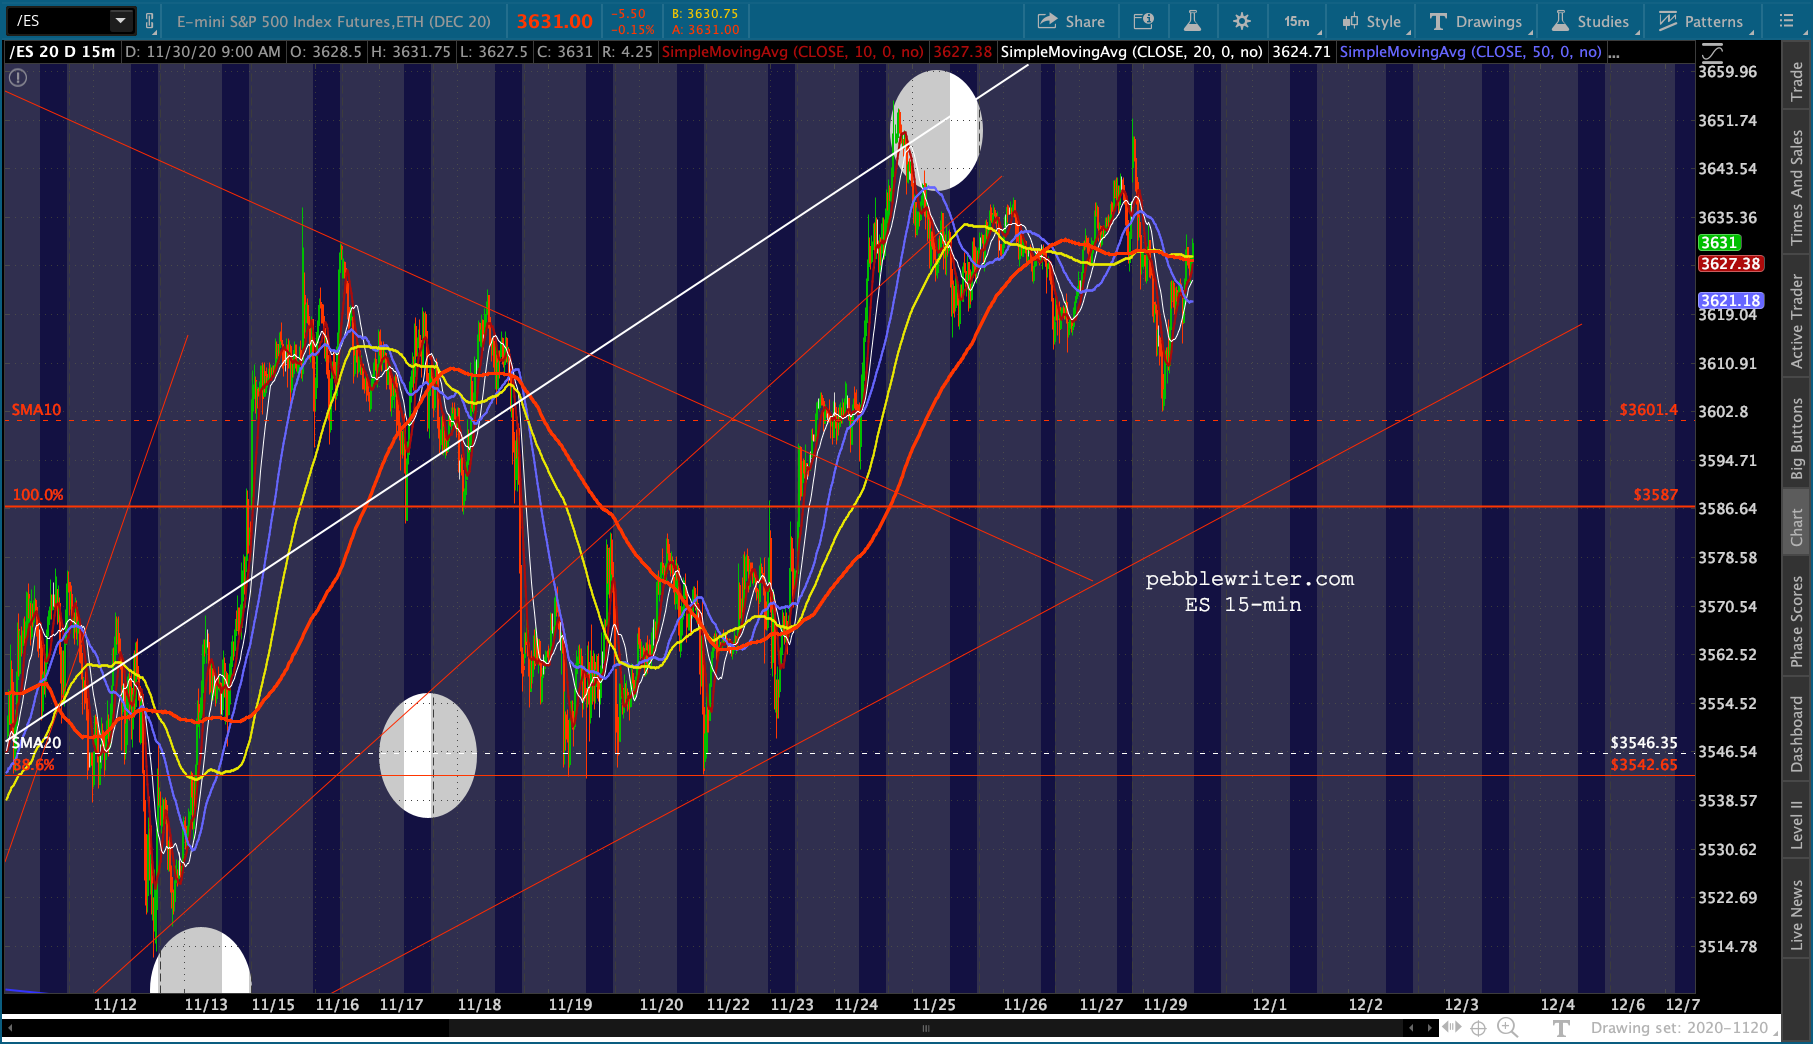 As we’ve been discussing for the past two weeks, ES’ rising white channel has broken down but it keeps backtesting higher.
 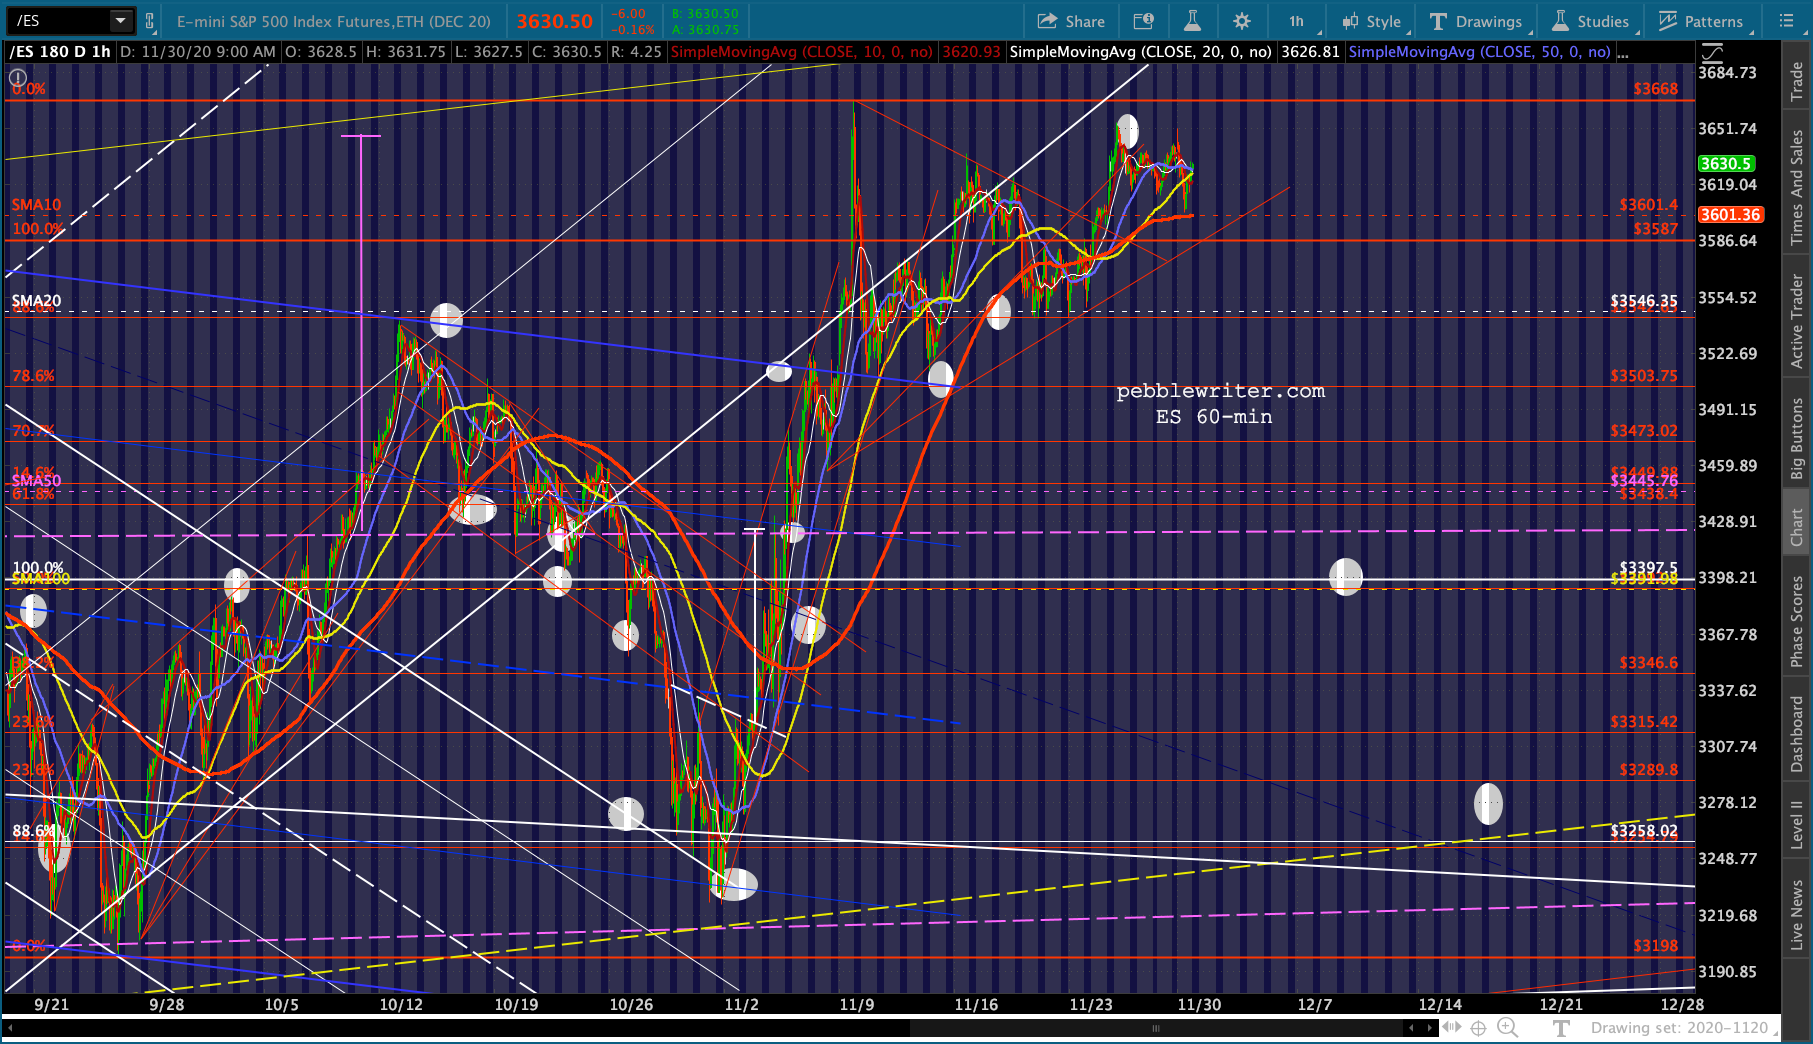 …with the potential to keep doing so to the white 1.272 at 3730 in the next few sessions.
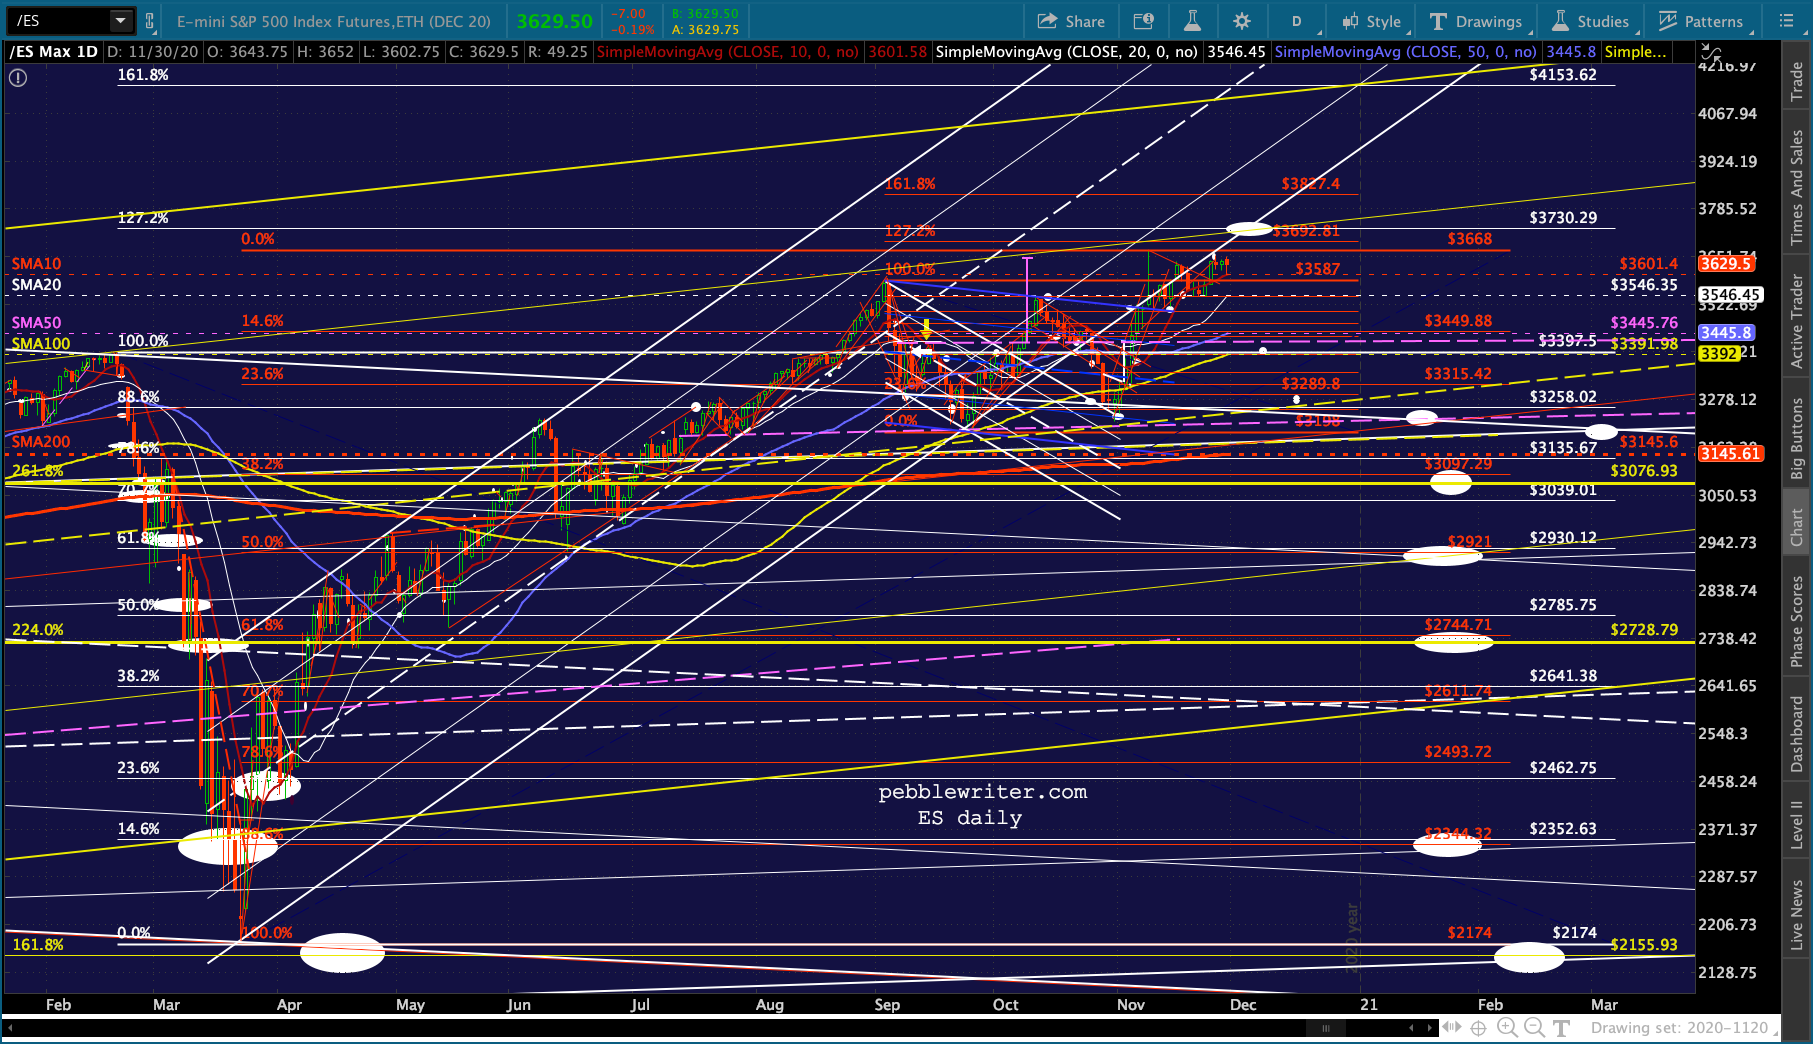
 SPX’s breakdown is a little more obvious.
 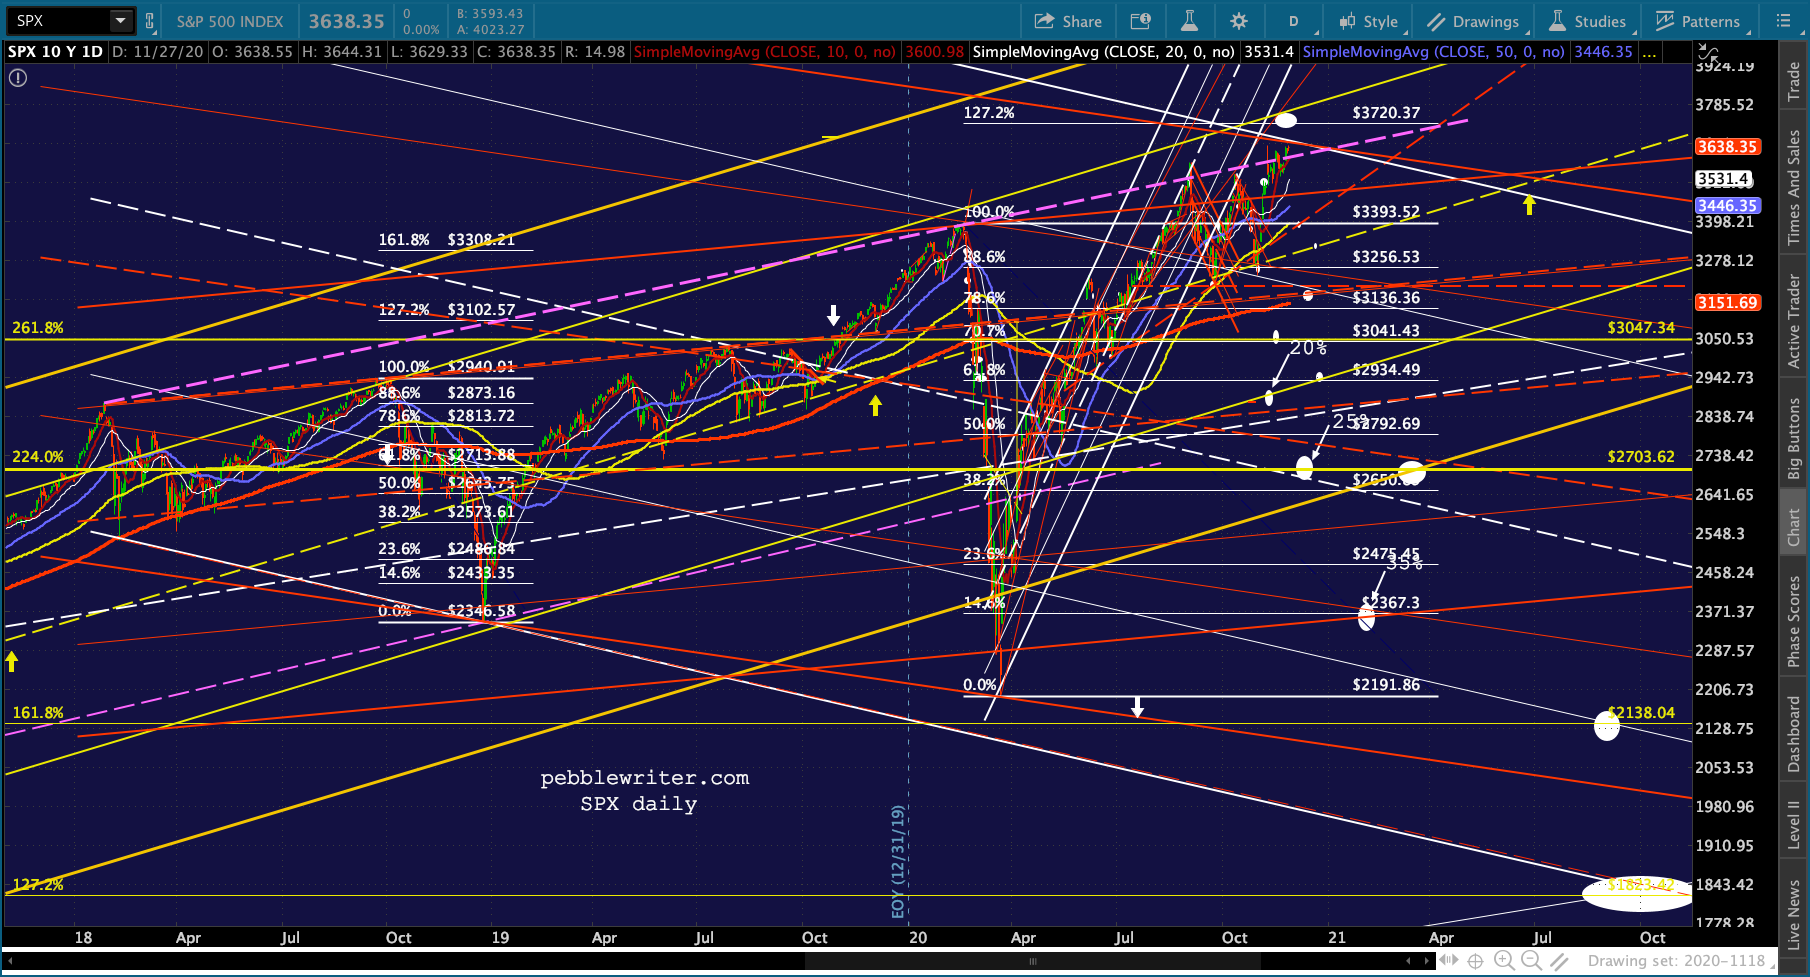 Importantly, VIX has finally reached the .886 retracement (19.86) of its rise from 11.42 to 85.47 that began in November 2019 and bounced up to backtest its SMA10. Like ES’ SMA10, VIX’s SMA10 represents an important test.
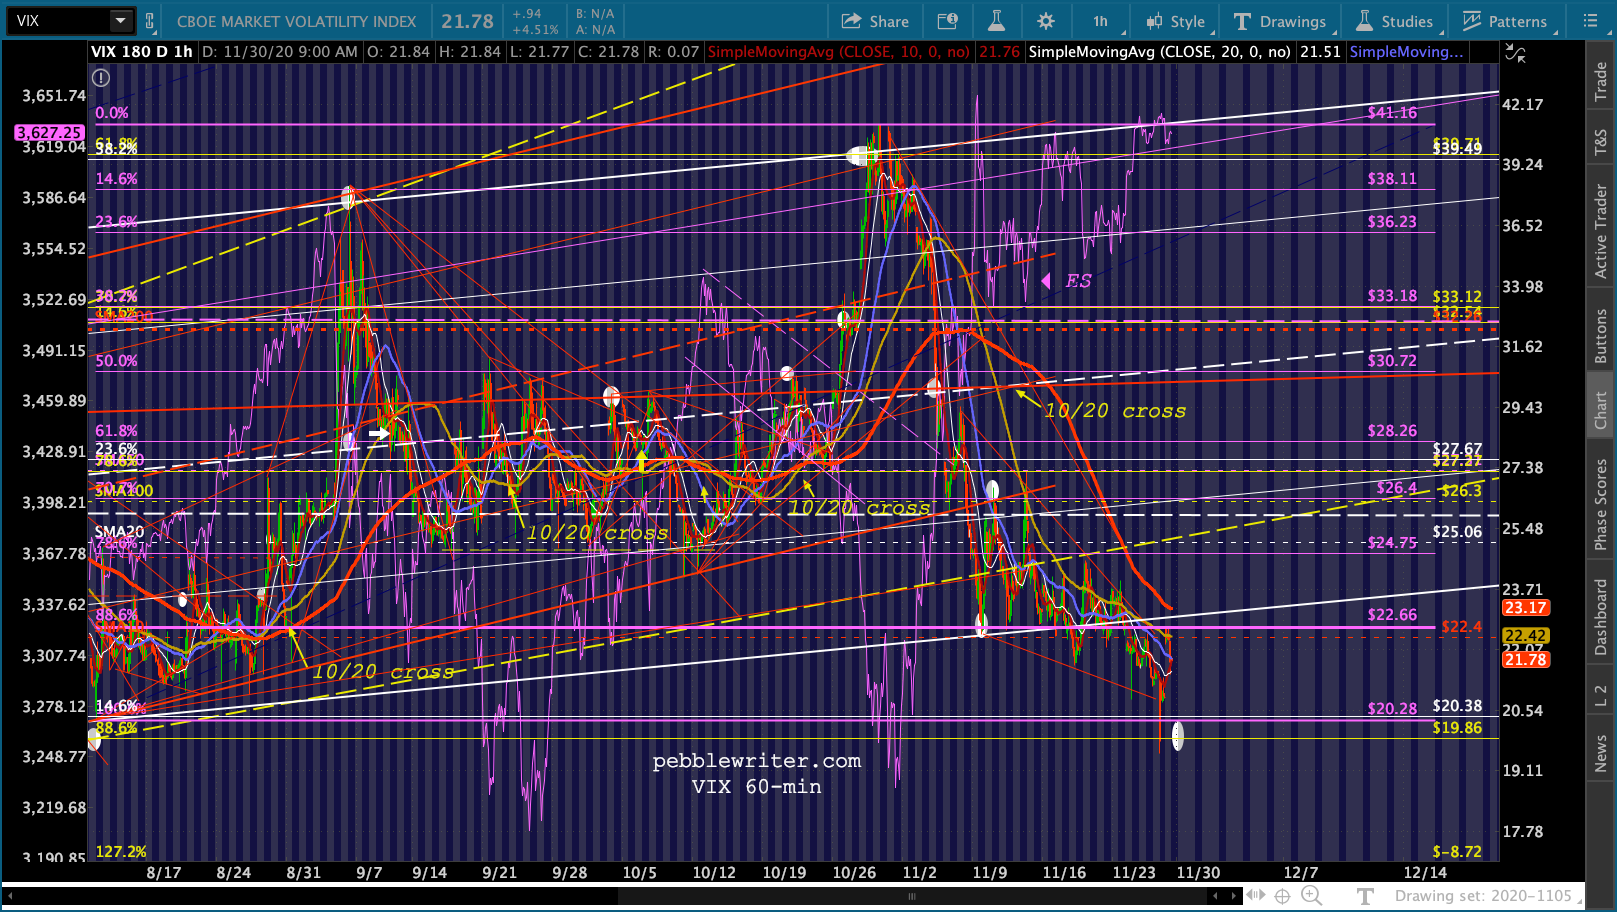 It just missed the .886 in August 2020, and went on another bounce up to 41.16.
 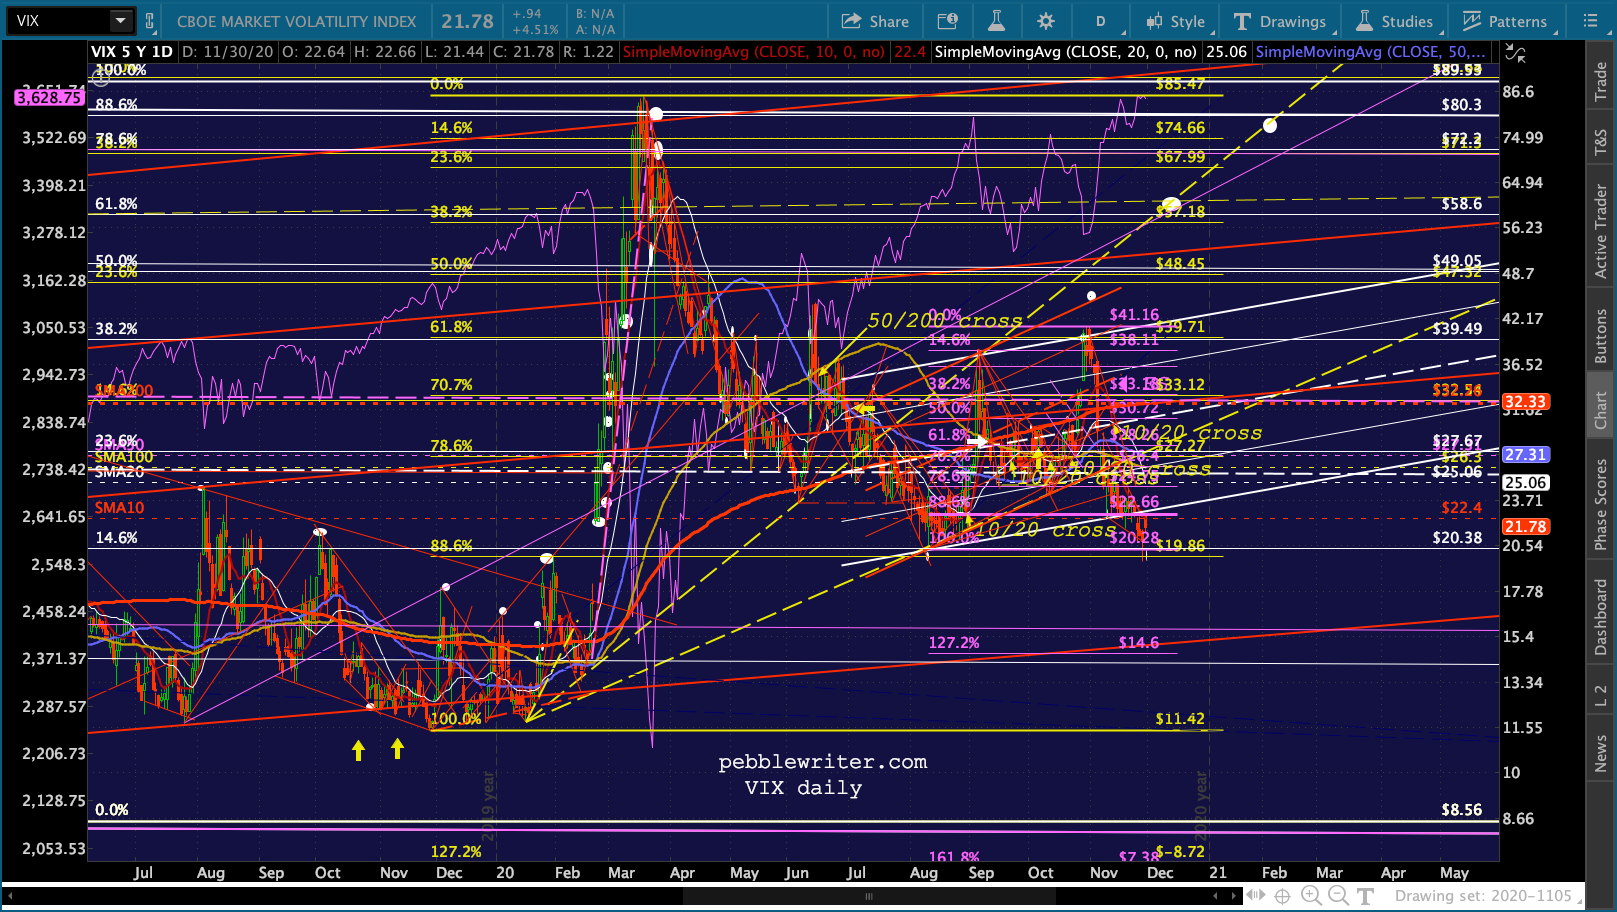 To the extent that stocks could be manipulated higher via the same mechanism in 2019 – a breakdown of trend lines and channel bottoms – hammering VIX a little lower every day, this is a critical moment for stocks.
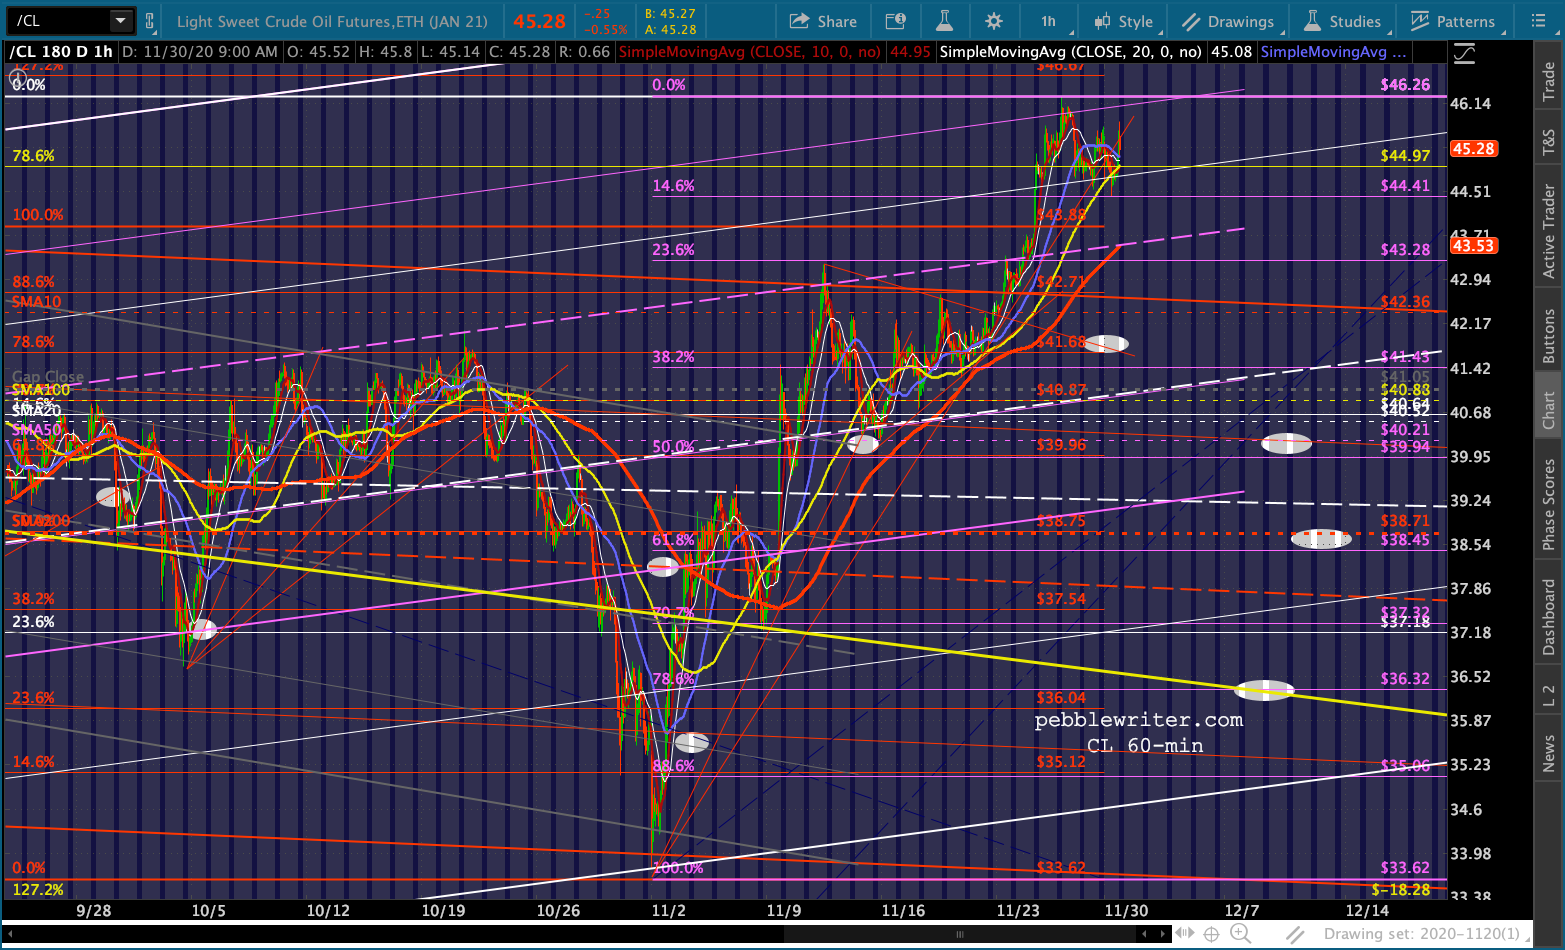
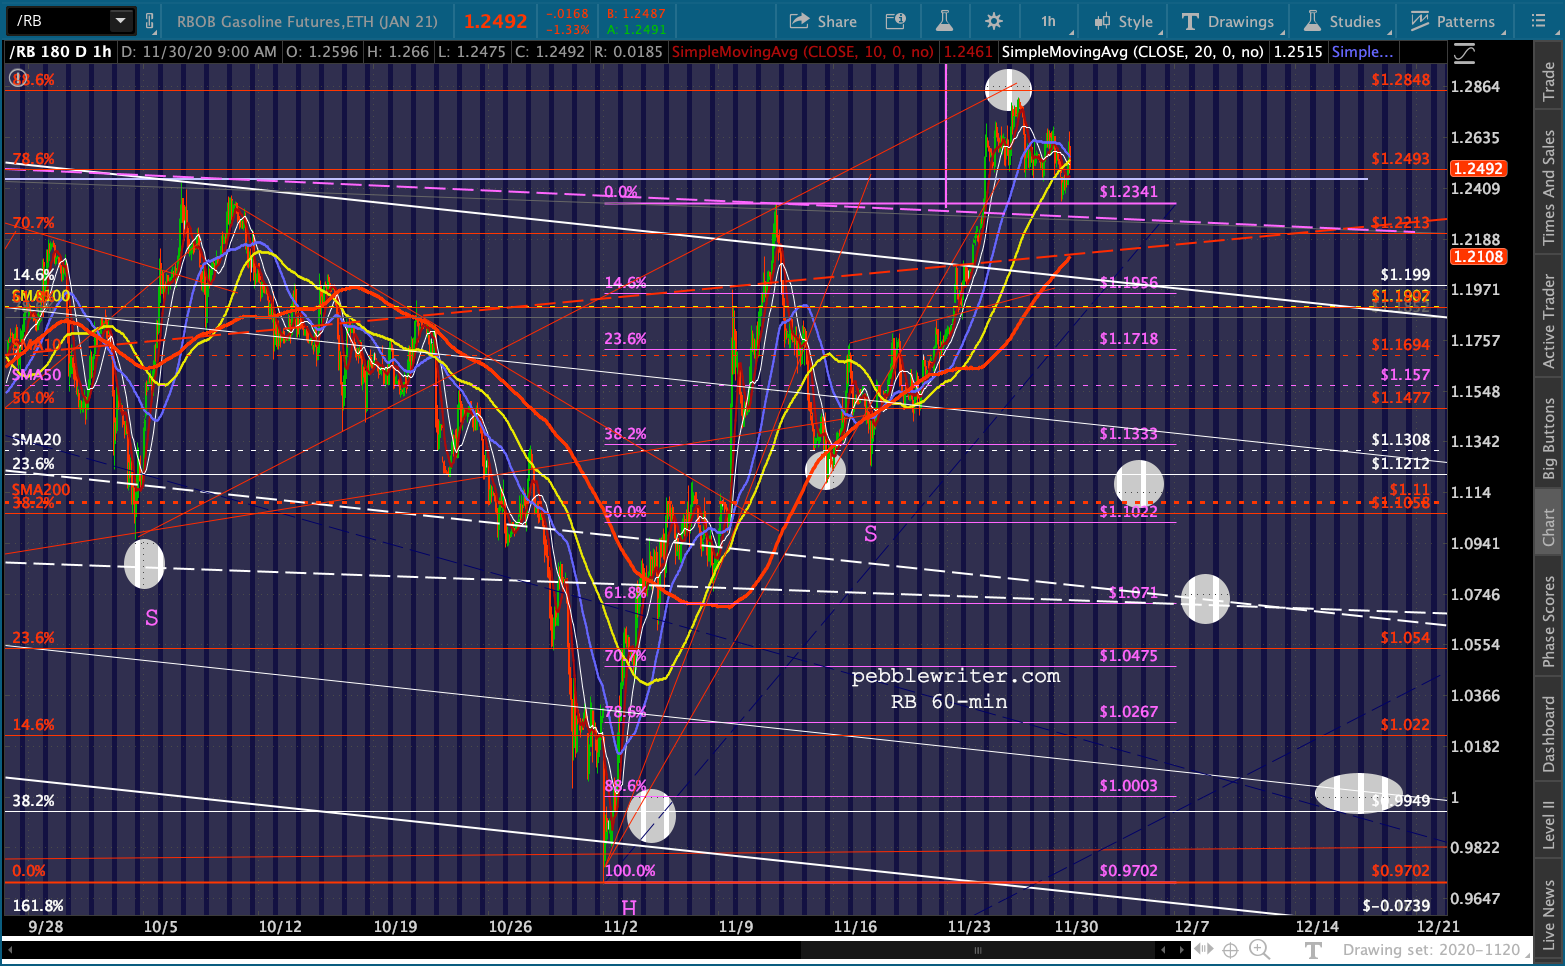
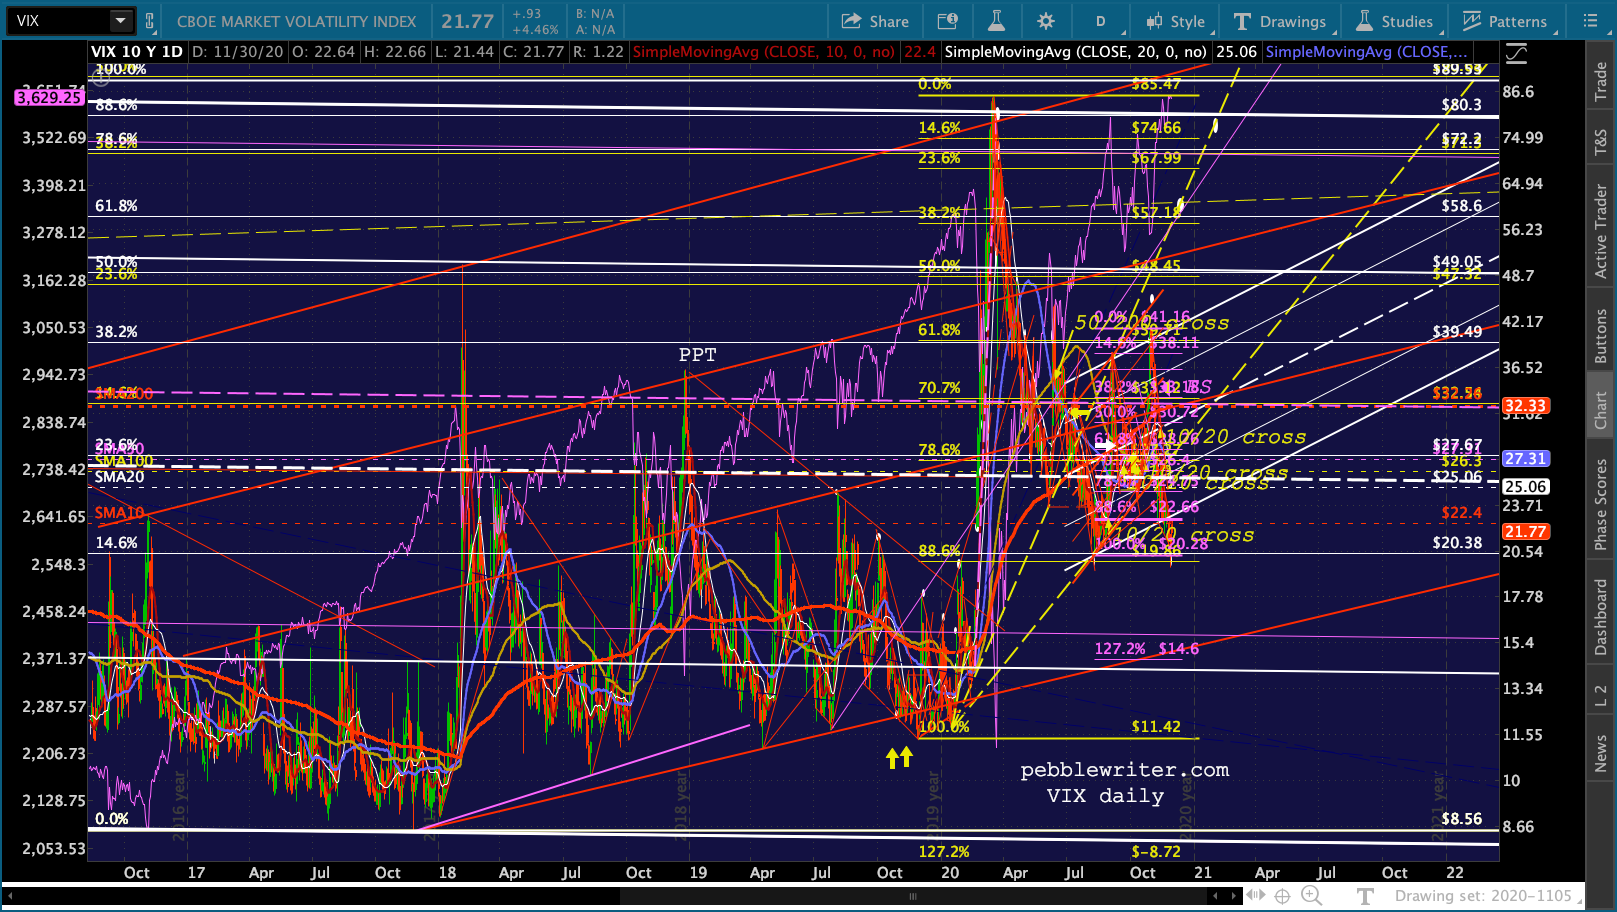 CL and RB might or might not help stocks out, depending on whether OPEC+ extends its production cuts and the current administration implicitly accepts a tax on the American people in order to preserve stock prices. They have been extremely supportive during the month of November.
 The currency picture has also been supportive. The breakdown we’ve been expecting in DXY…
 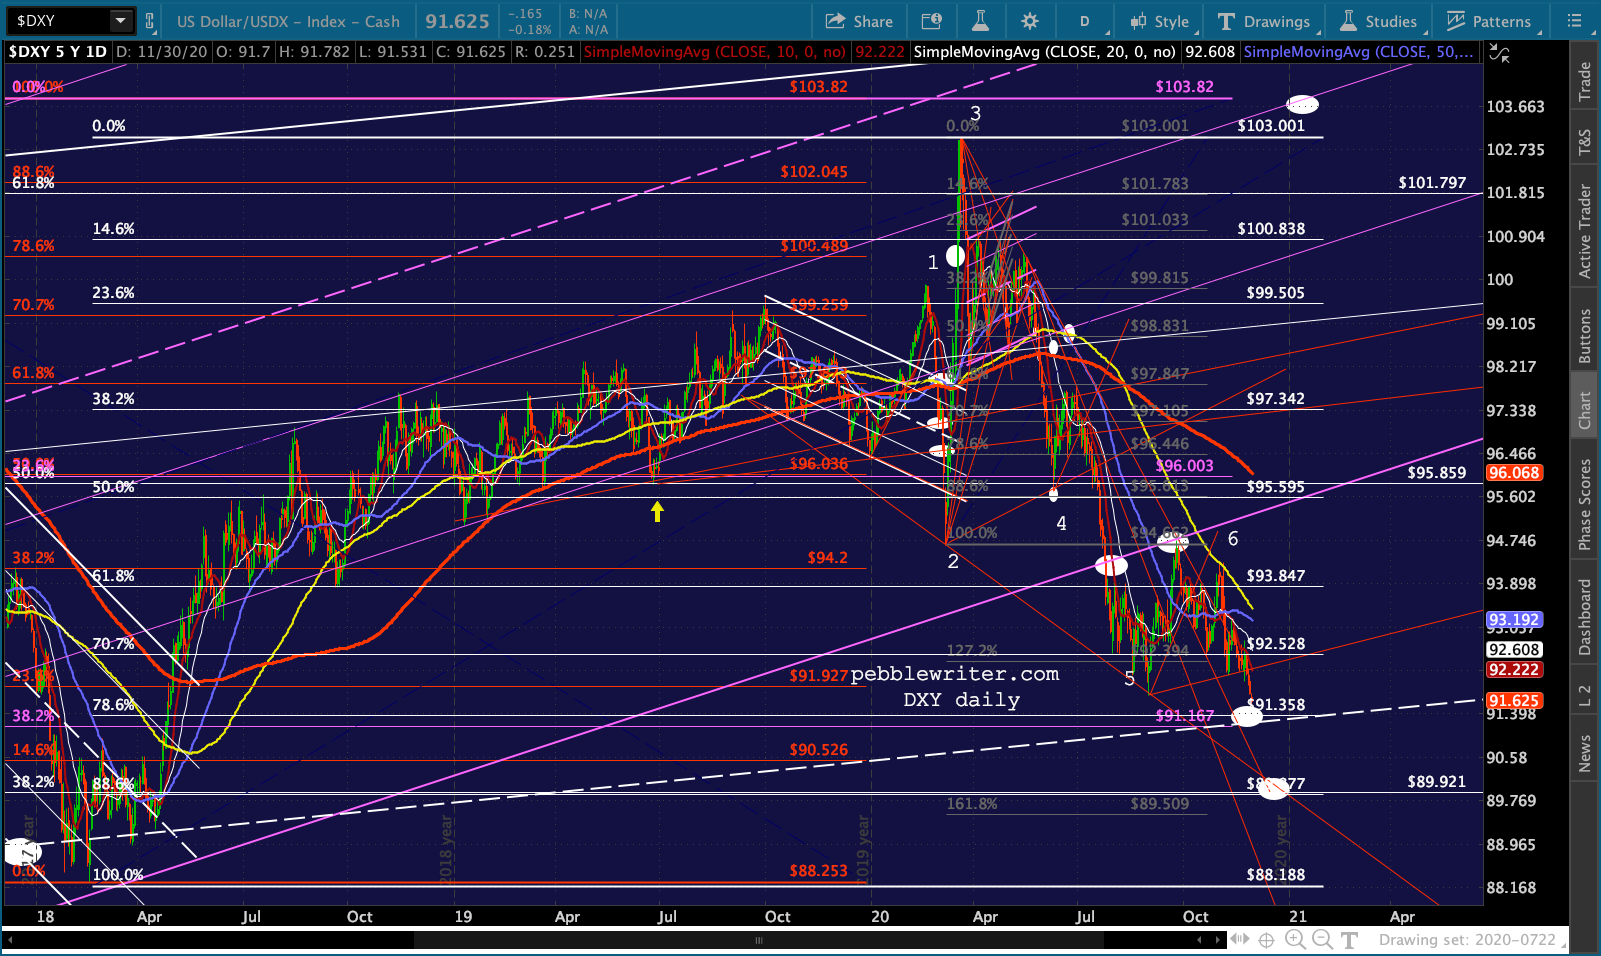 …would normally be powered by a breakdown in USDJPY. Though it still has plenty more downside potential, it keeps getting timely bounces.
 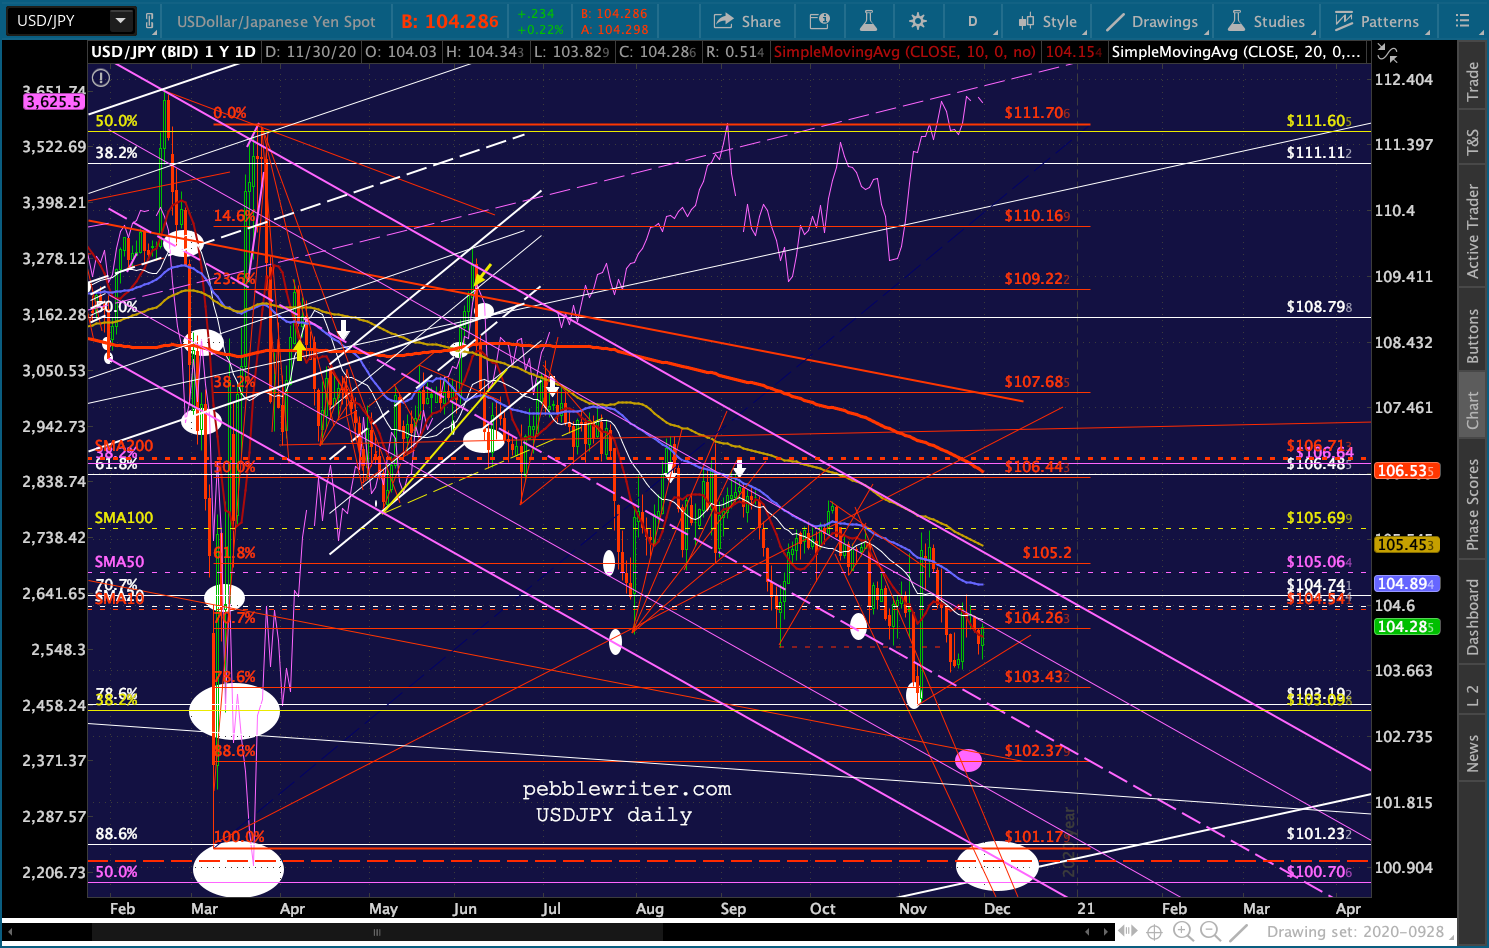 But, it’s been driven instead by a breakout in EURUSD – which has little effect on stocks. The flag pattern
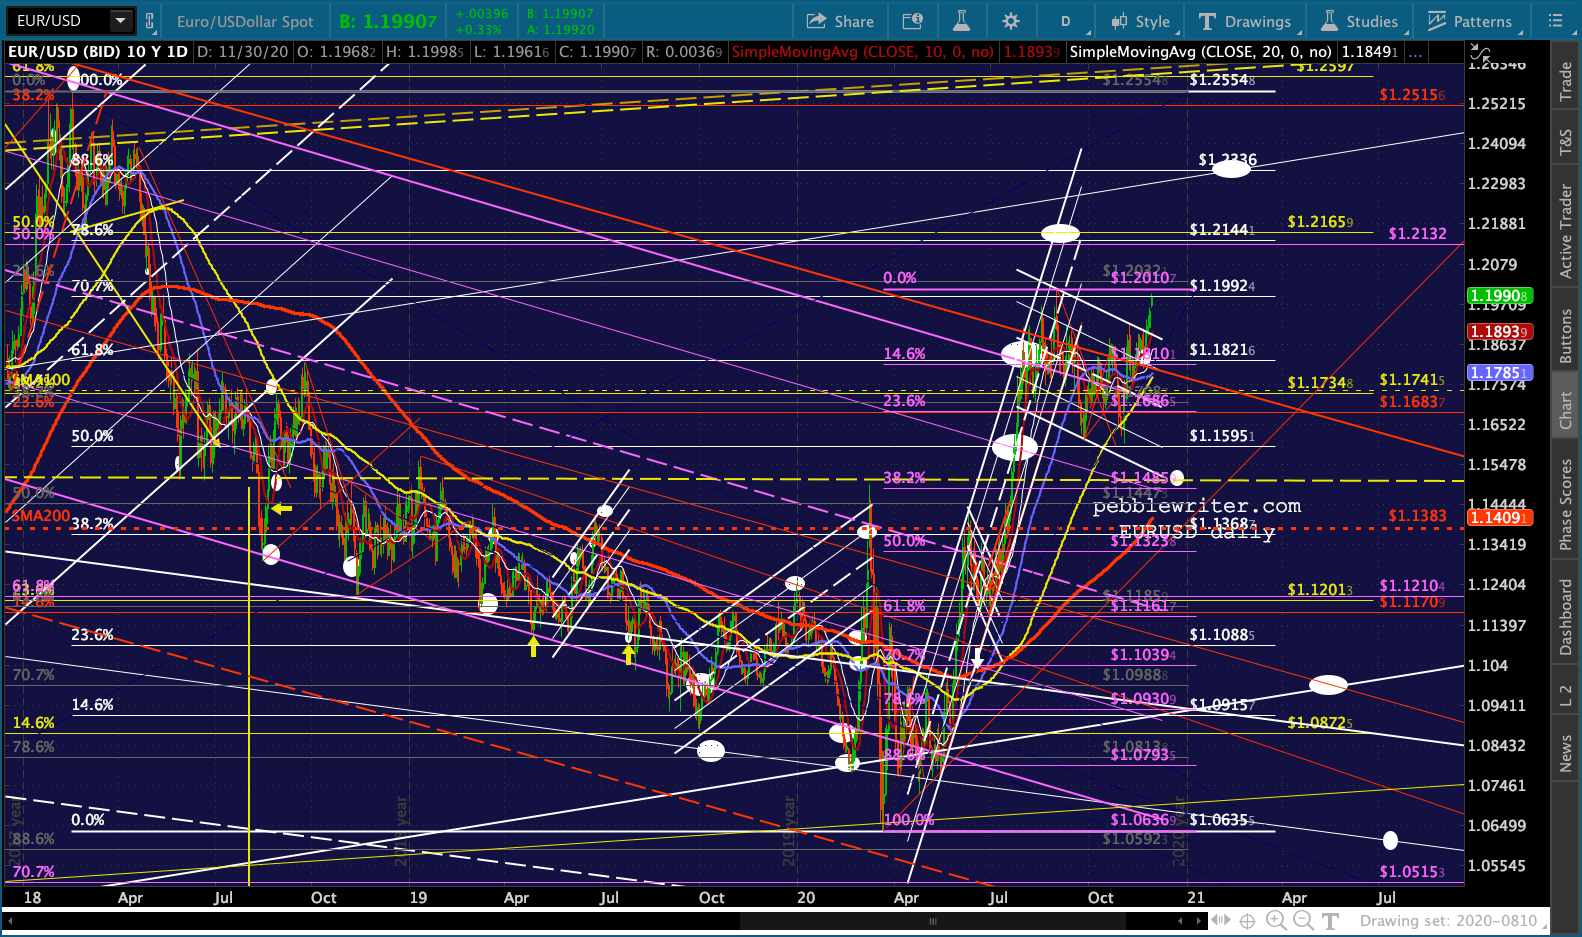 The flag pattern has broken out to the upside and the pair is testing its Sep 1 highs.
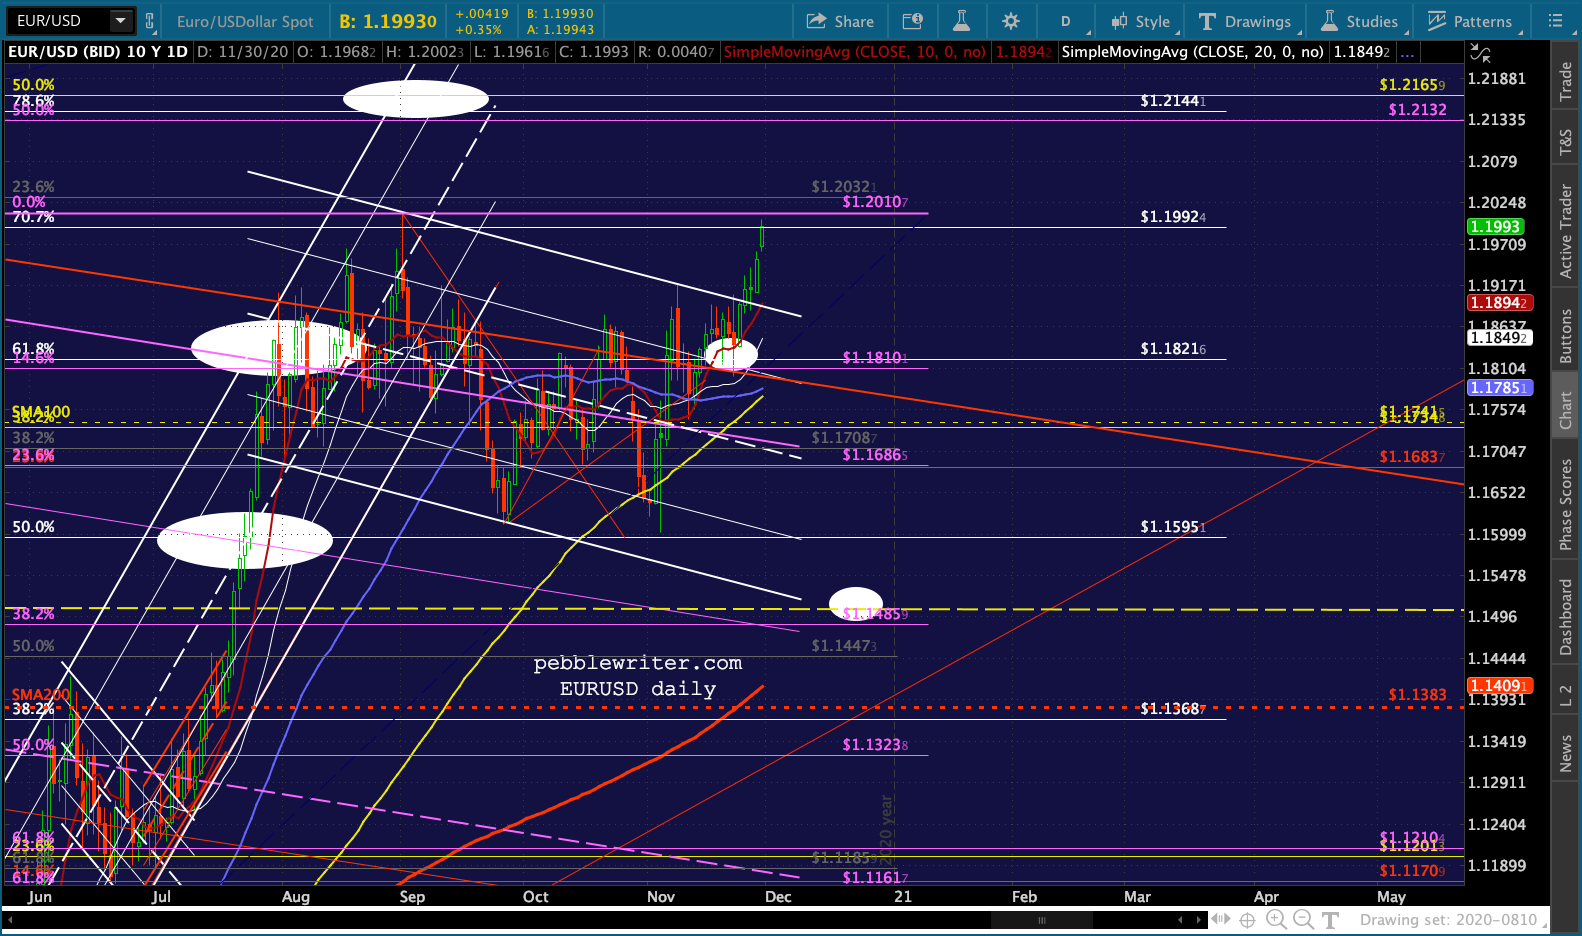 But, this is a post about gold and silver. Whether it’s the euro or the yen that gets DXY to our downside targets, it’s very likely going to get there. The appointment of Janet Yellen to Treasury Secretary only increases the likelihood of additional dollar weakness. Passing another stimulus package in the next month or two will add to the pressure.
Today’s low, so far, is 91.517 – very close to our long-held downside target of 91.358 – the .786 retracement of DXY’s rise from its 2018 lows to its 2020 highs.
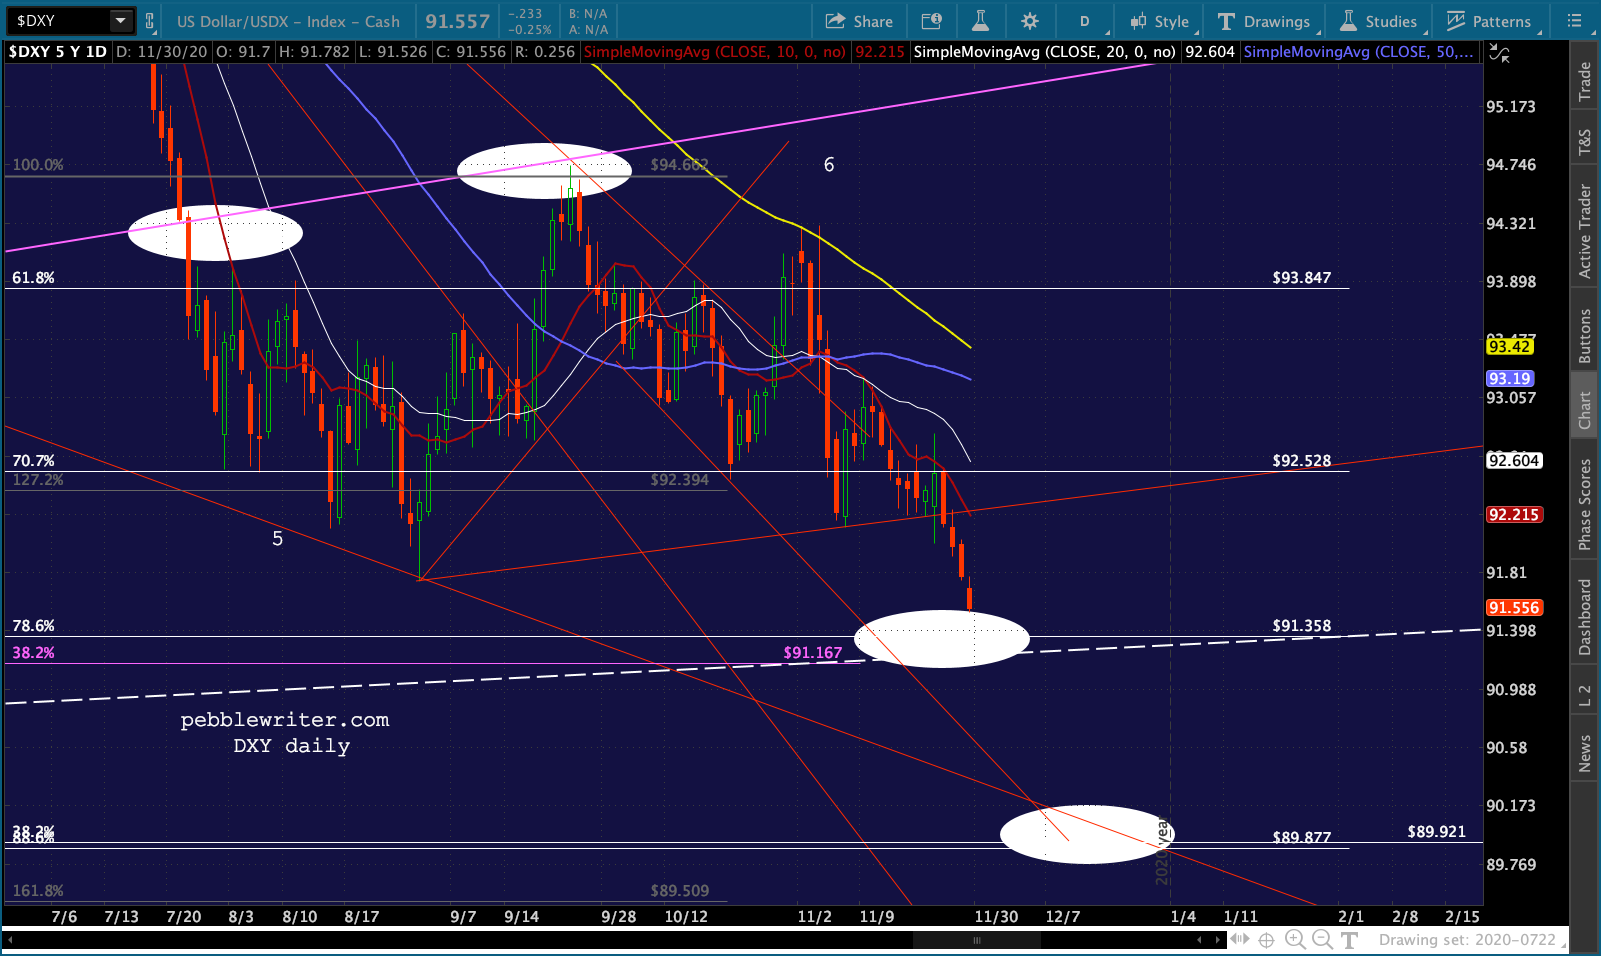 The dashed white line which runs through 91.358 is critically important, as it represents the midline of a very large channel from 2003. Recall that the rising purple channel broke down in late July and was backtested in late September. So, the midline is the next most significant support.
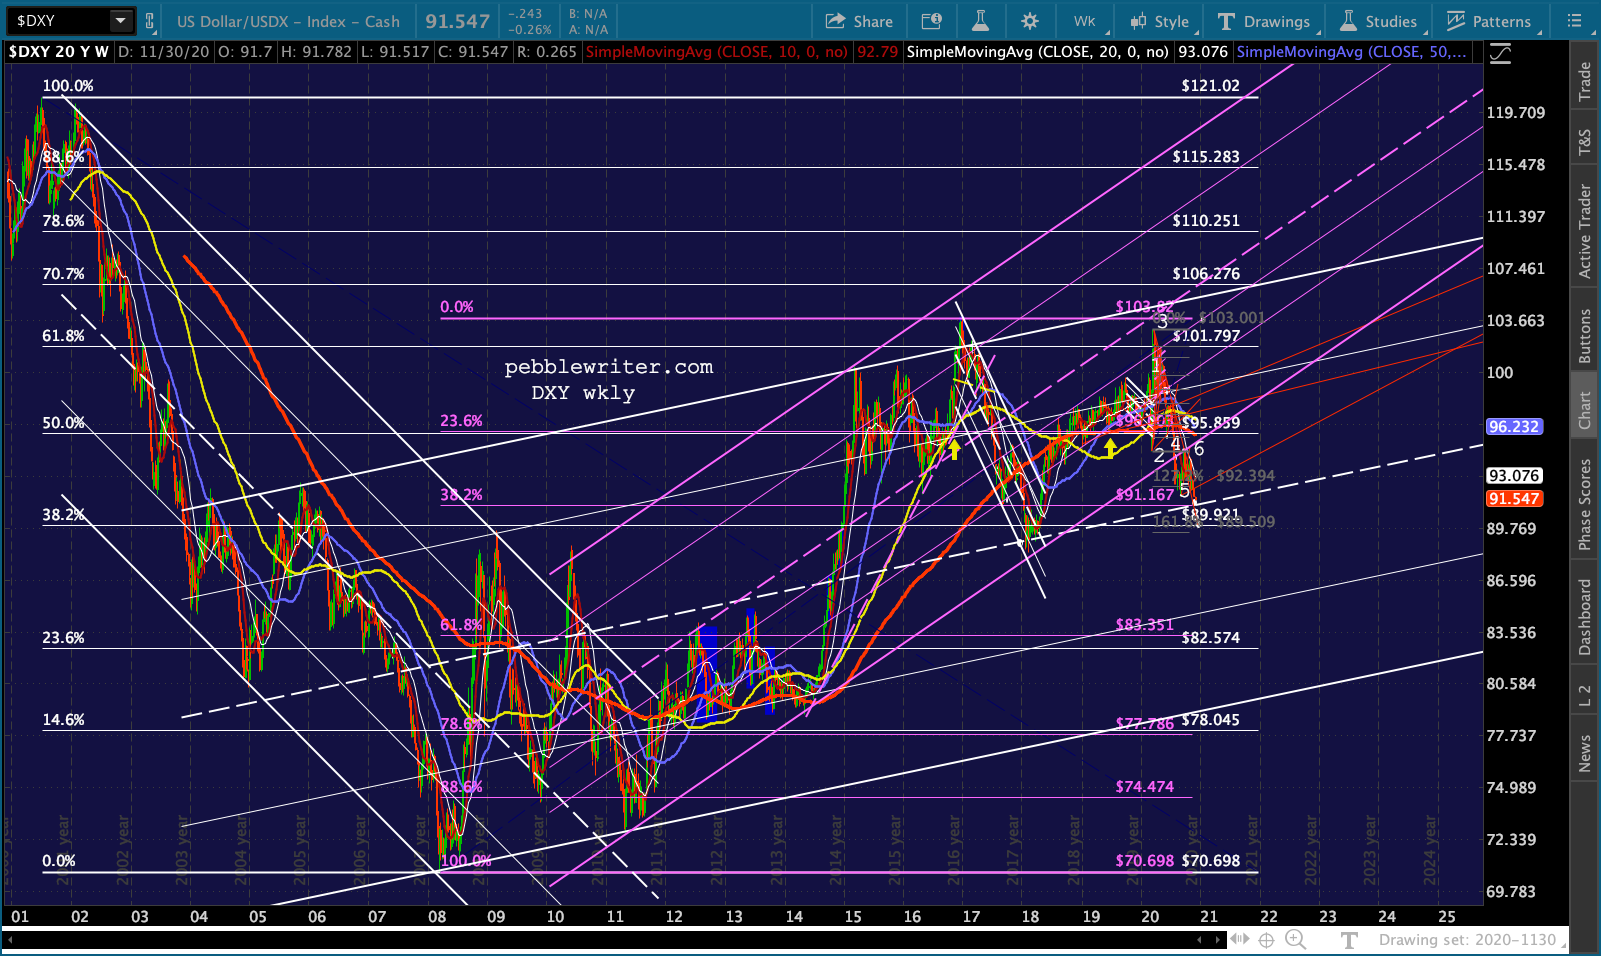 Were DXY to tag 91.358 and bounce sharply, GC would face additional downside pressure. Were DXY to overshoot 91.358 and go on to 89.877 or lower, GC could get a bid.
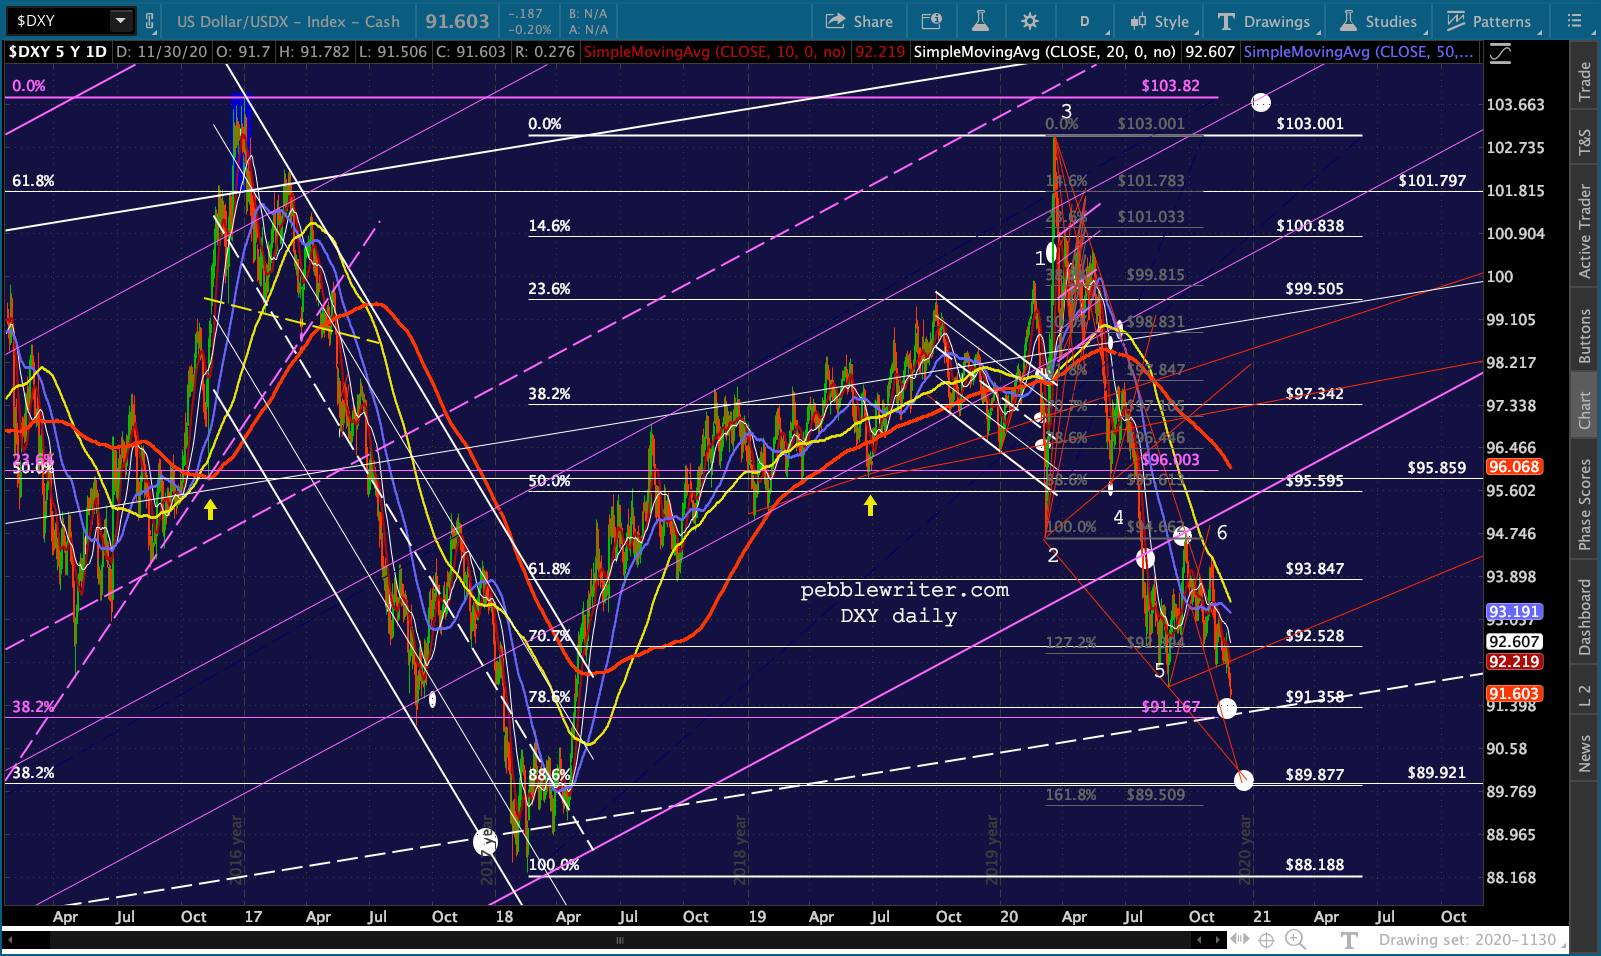 But, the negative correlation hasn’t been that consistent. From Sep 2018 to June 2020, they were positively correlated.
 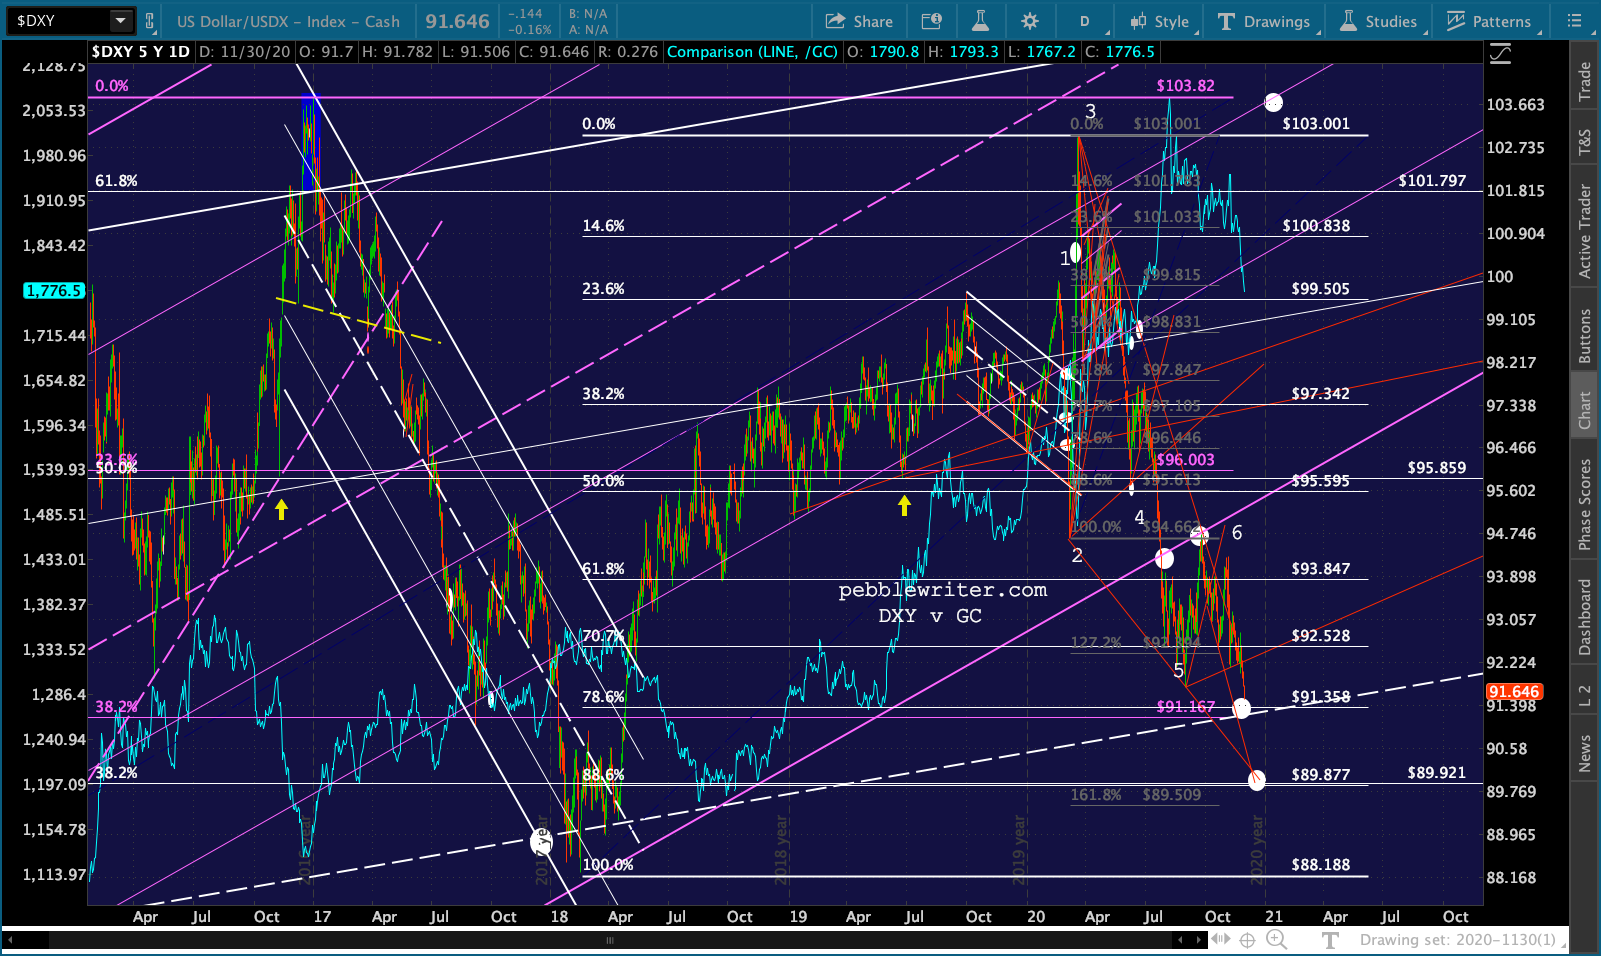 Beginning on June 30, however, the negative correlation reemerged – at least until Nov 9. Since then, they have fallen back into a positive correlation – both bouncing slightly and then tumbling lower.
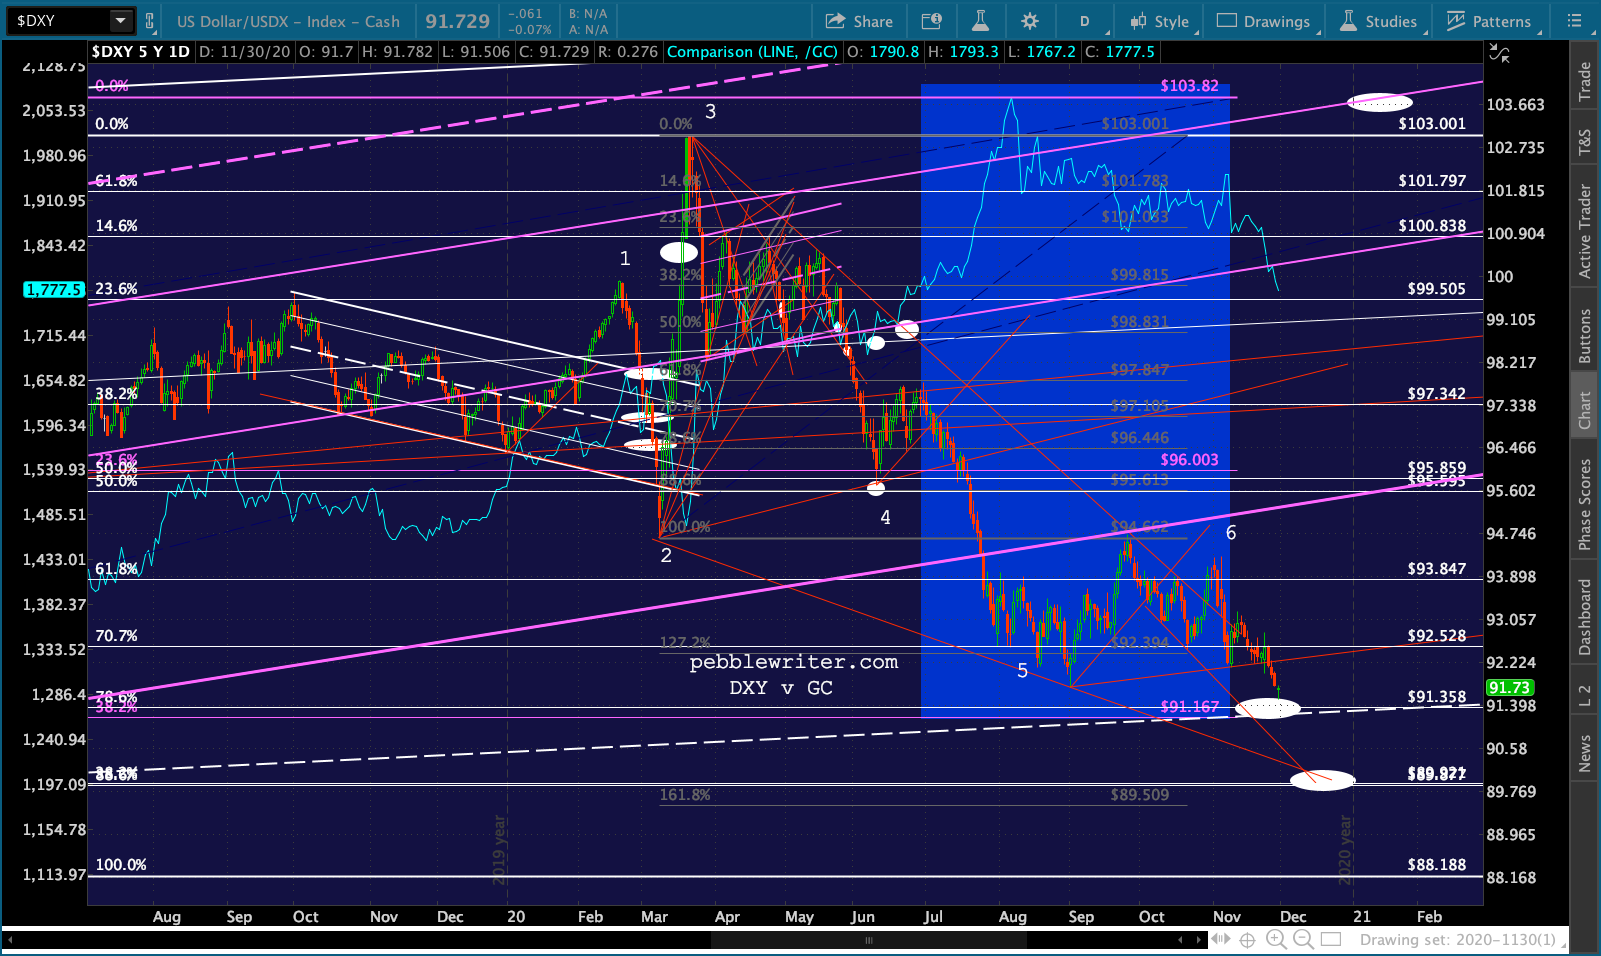 The more useful correlation from a charting standpoint has been ZN – the 10-yr Treasury Note futures.
 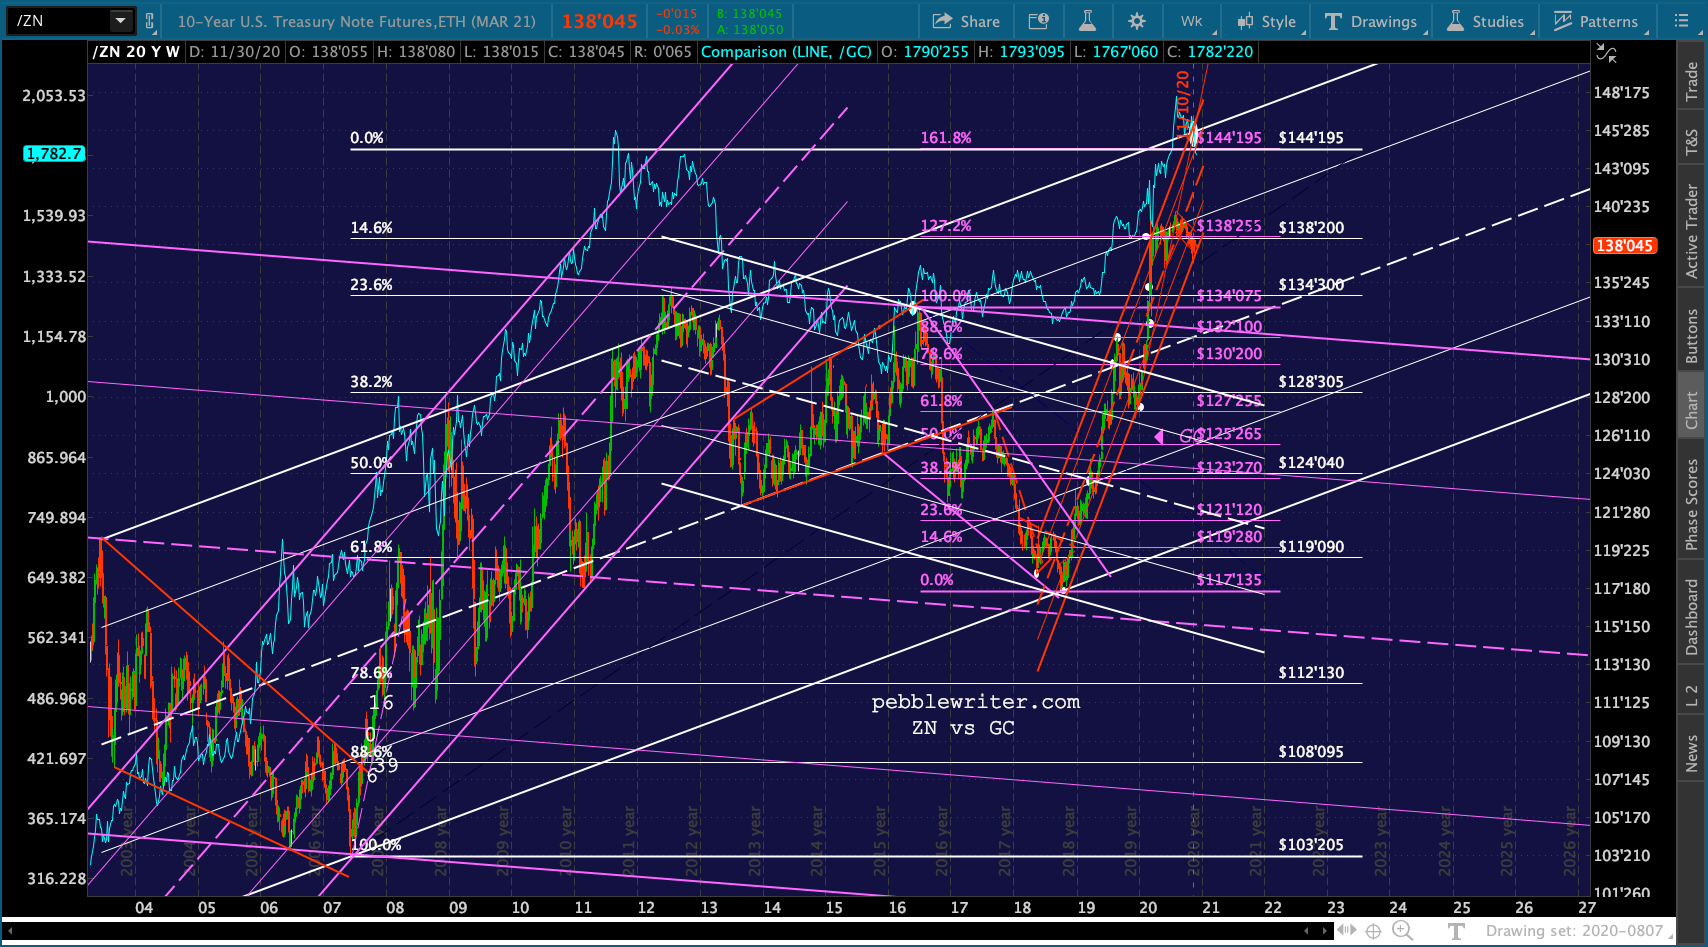 Note that ZN is essentially the inverse of TNX. Since its 2018 lows, ZN has been tracing out a well-formed rising channel (shown below in red) as 10Y yields have fallen. GC’s moves have been very positively correlated.
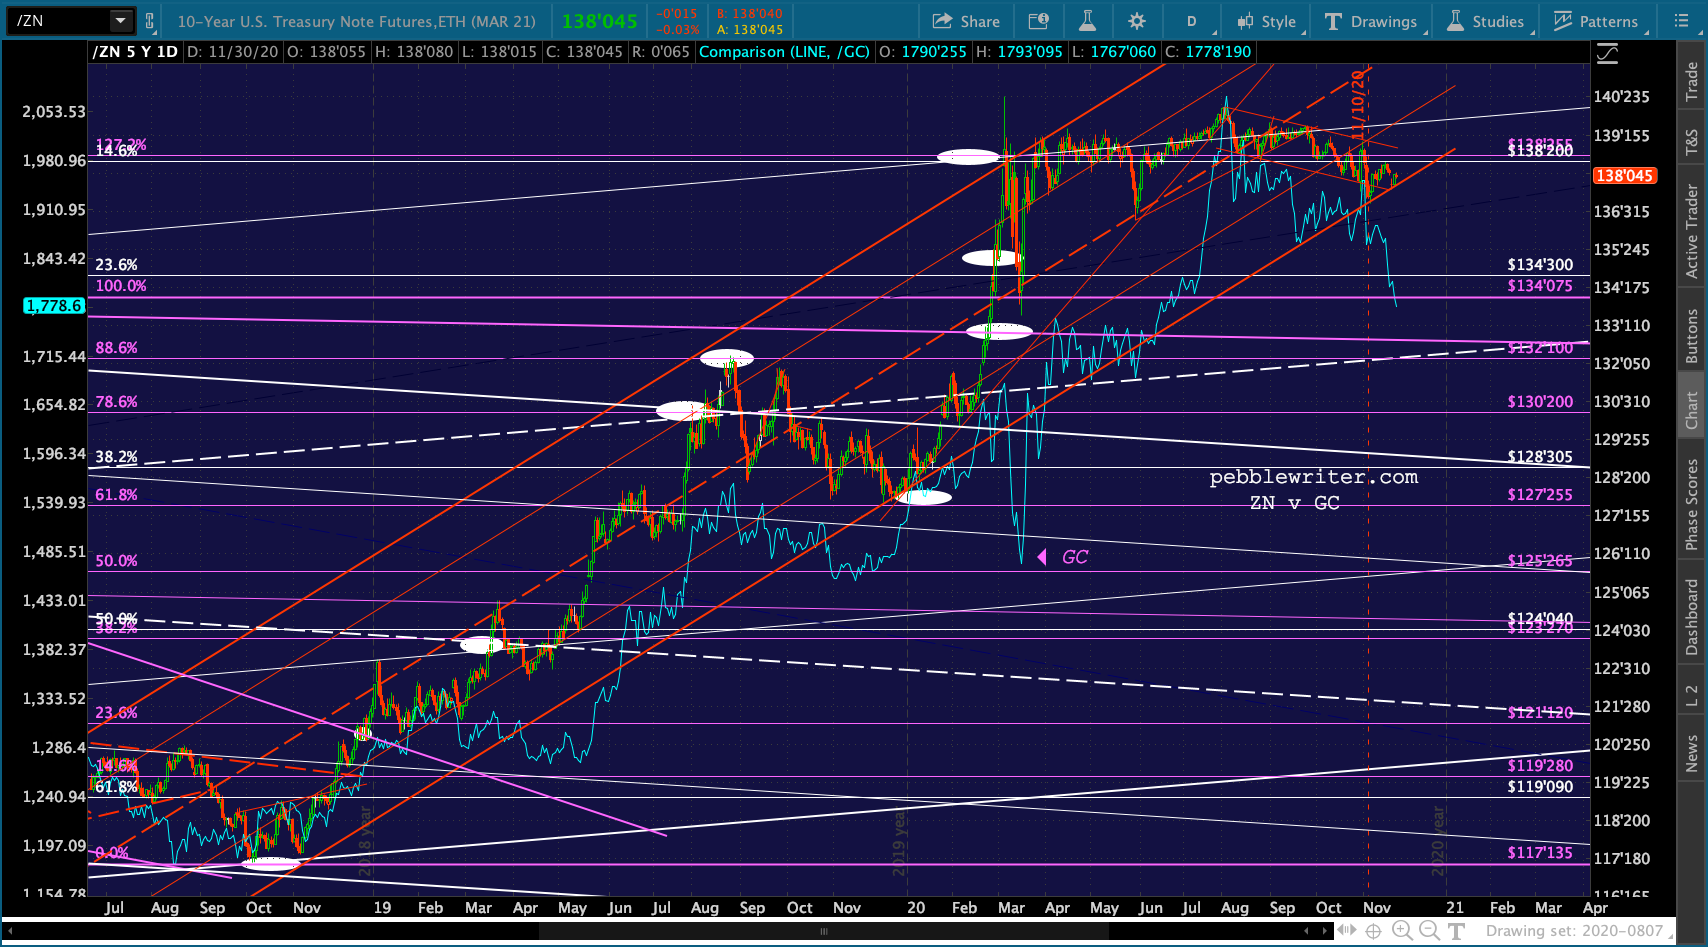 My expectation has been that TNX would break down and ZN would shoot up and tag the target at the intersection of the rising red channel and the rising white channel – now around 145’190.
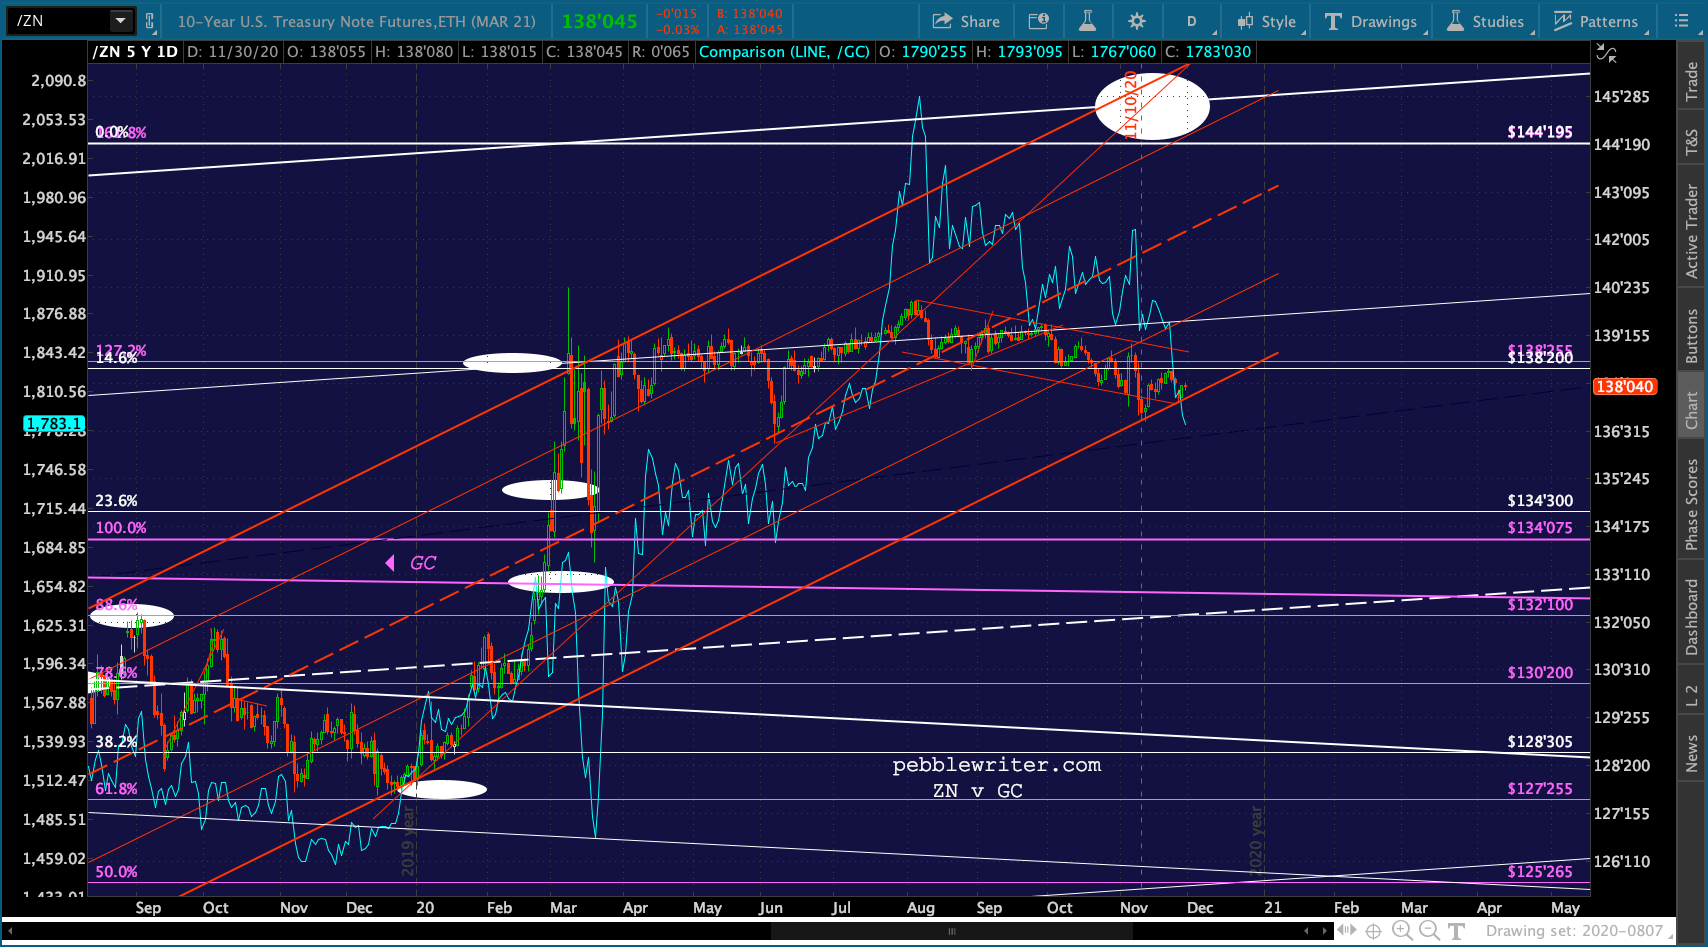 But, TNX has refused to break down – bouncing instead every time it threatens to break down.
 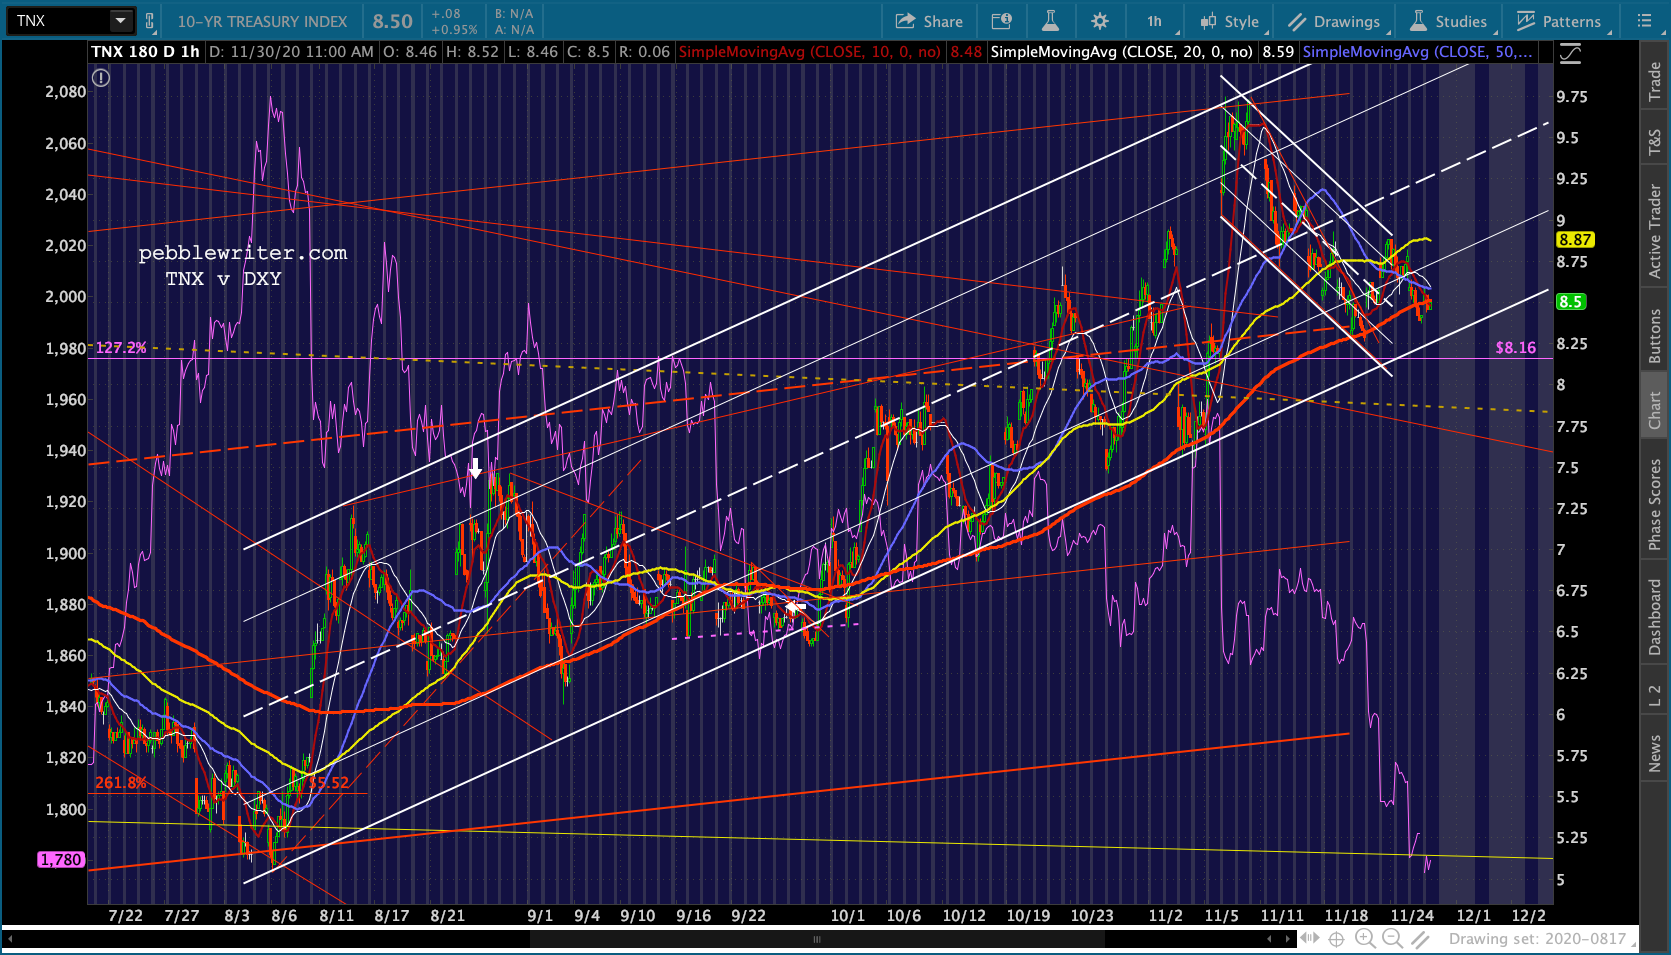 All it really needs is another big round of stimulus – but that hasn’t happened yet.
 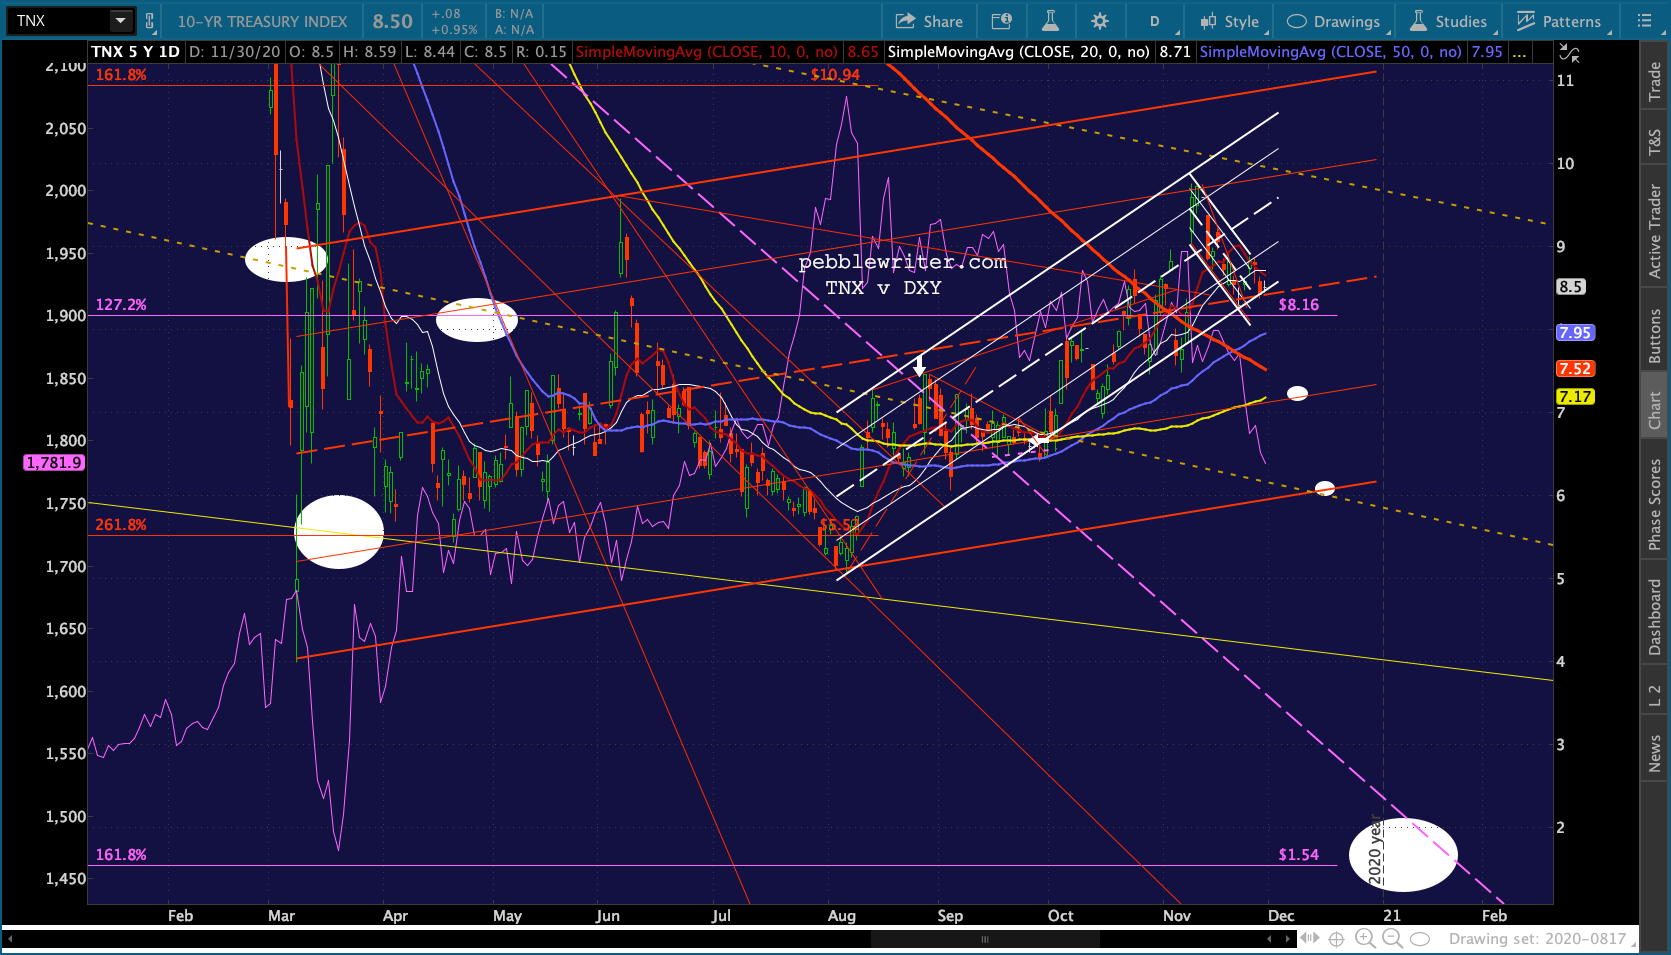 So, where does that leave us?
With Yellen and Powell at the controls and Biden in the White House, it seems very unlikely that we won’t get more easing of some type. I think this translates into lower rates and higher ZN – meaning higher GC as well, even if it’s not to new highs.
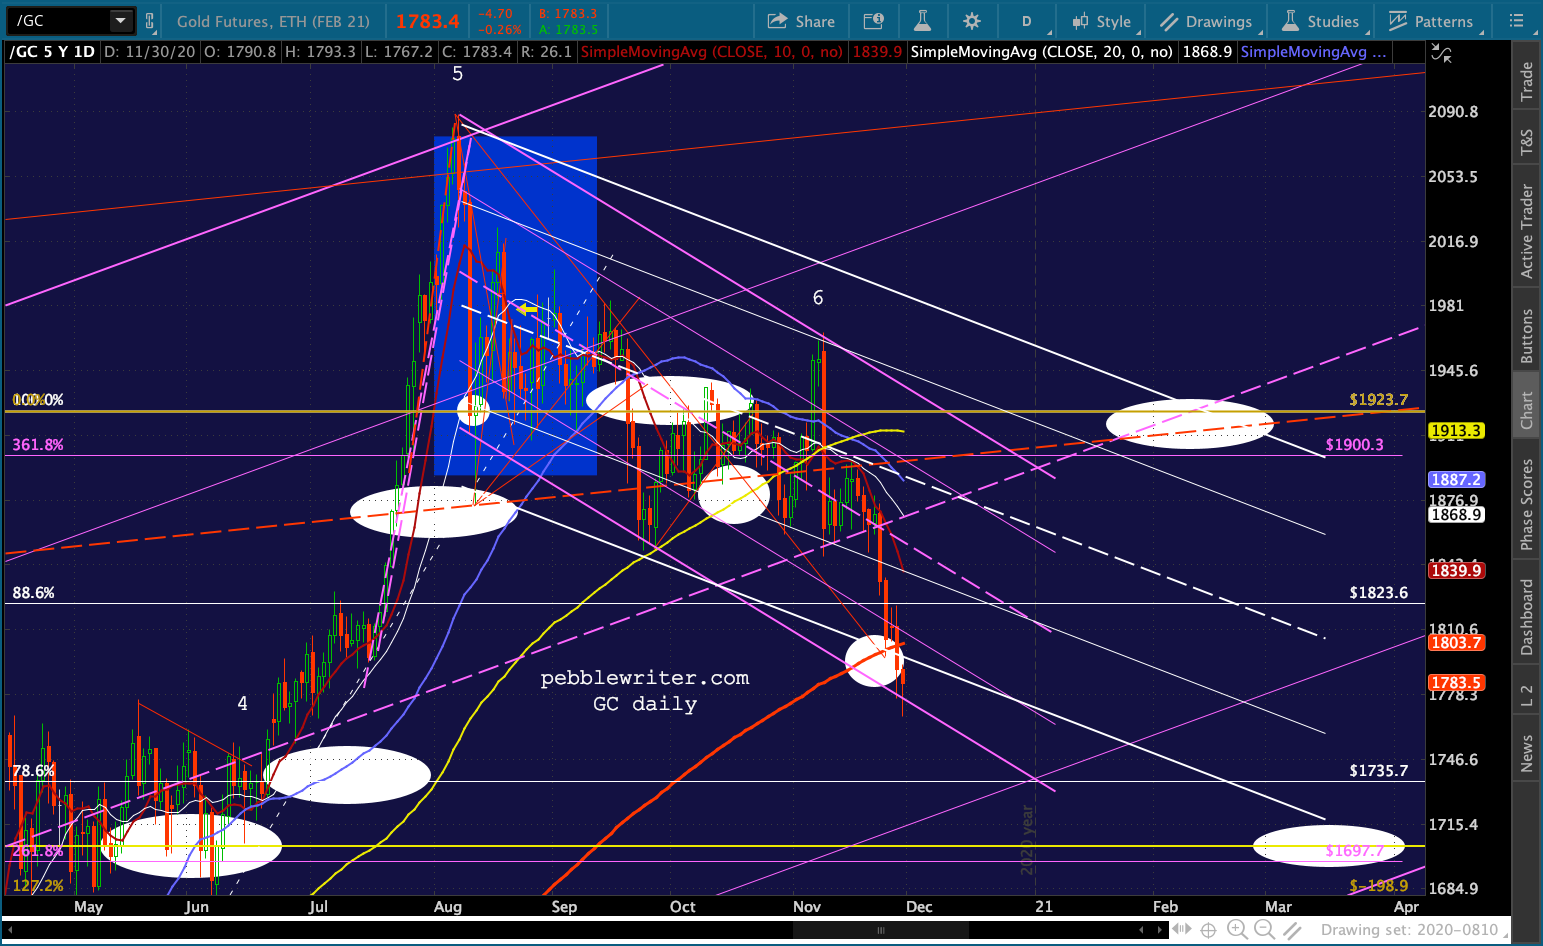 If DXY gets its bounce today, or even if it doesn’t, GC could claim the more steeply falling purple channel shown above. It’s not as good a fit IMO. But, them are the breaks. As the chart below shows, there’s not much in the way of support below the SMA200 until you reach a cluster of support at the rising purple channel .236 line at 1700ish, the IH&S target at 1705, the huge red channel .382 line and the purple 2.618 at 1697.
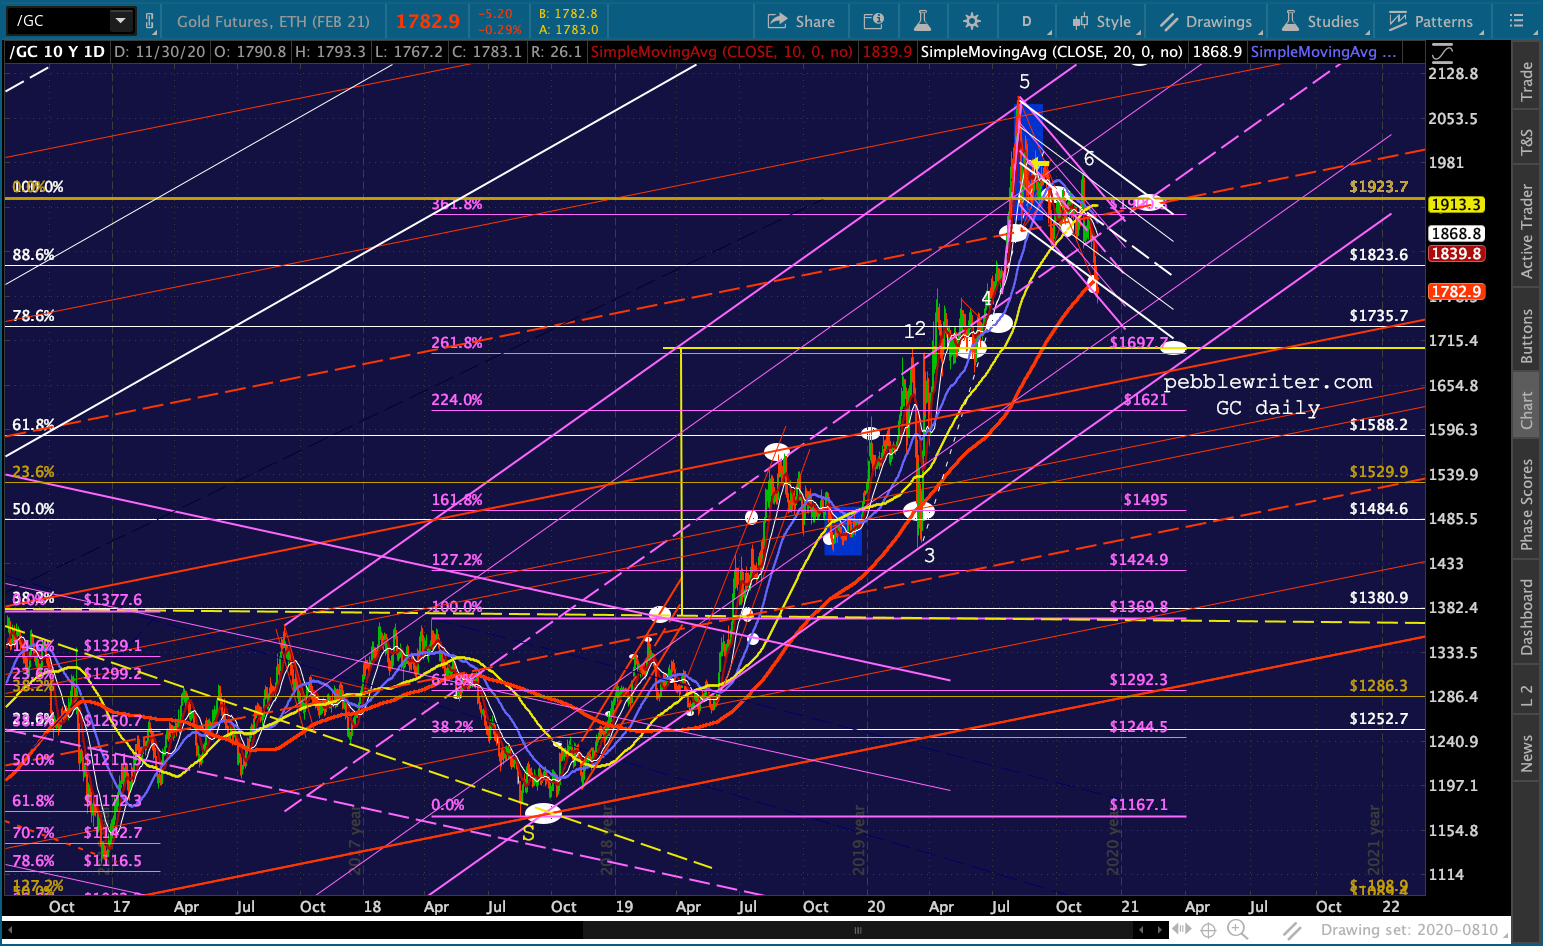 The red channel can be better seen on the wkly chart below. If today’s lows at 1767 or the targets mentioned above at 1700ish don’t hold, the next most significant support is the bottom of the rising purple channel. It’s currently around 1600, but will reach the 2.618 and IH&S target at 1700 around Apr 20, 2021.
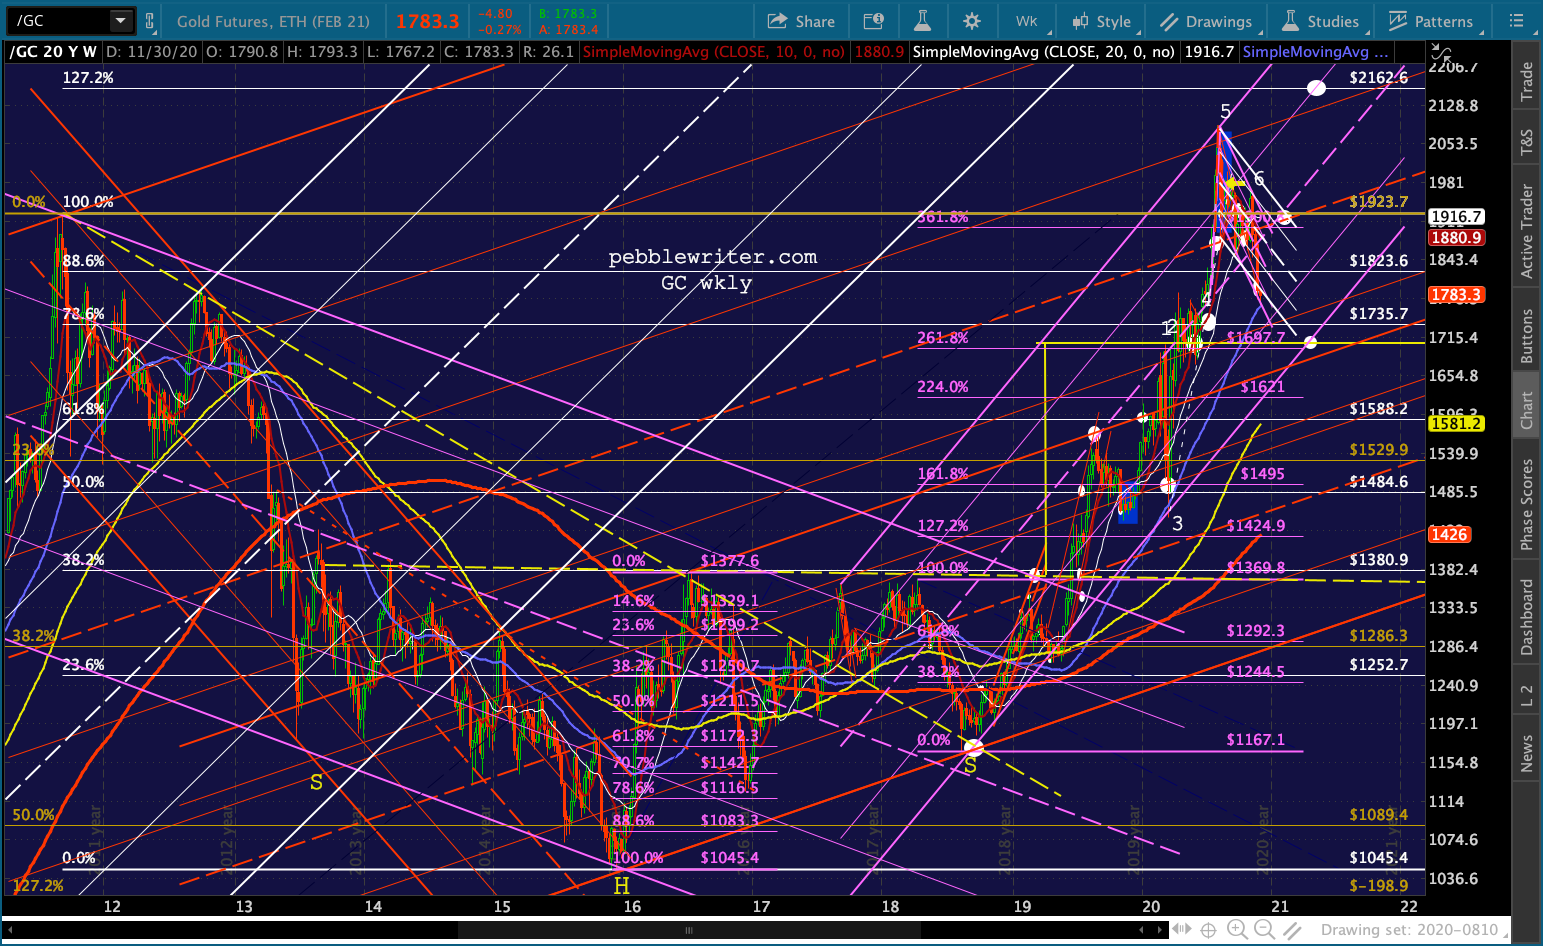 The last time GC was this oversold was in mid-March when everything was melting down and trying to find a bottom.
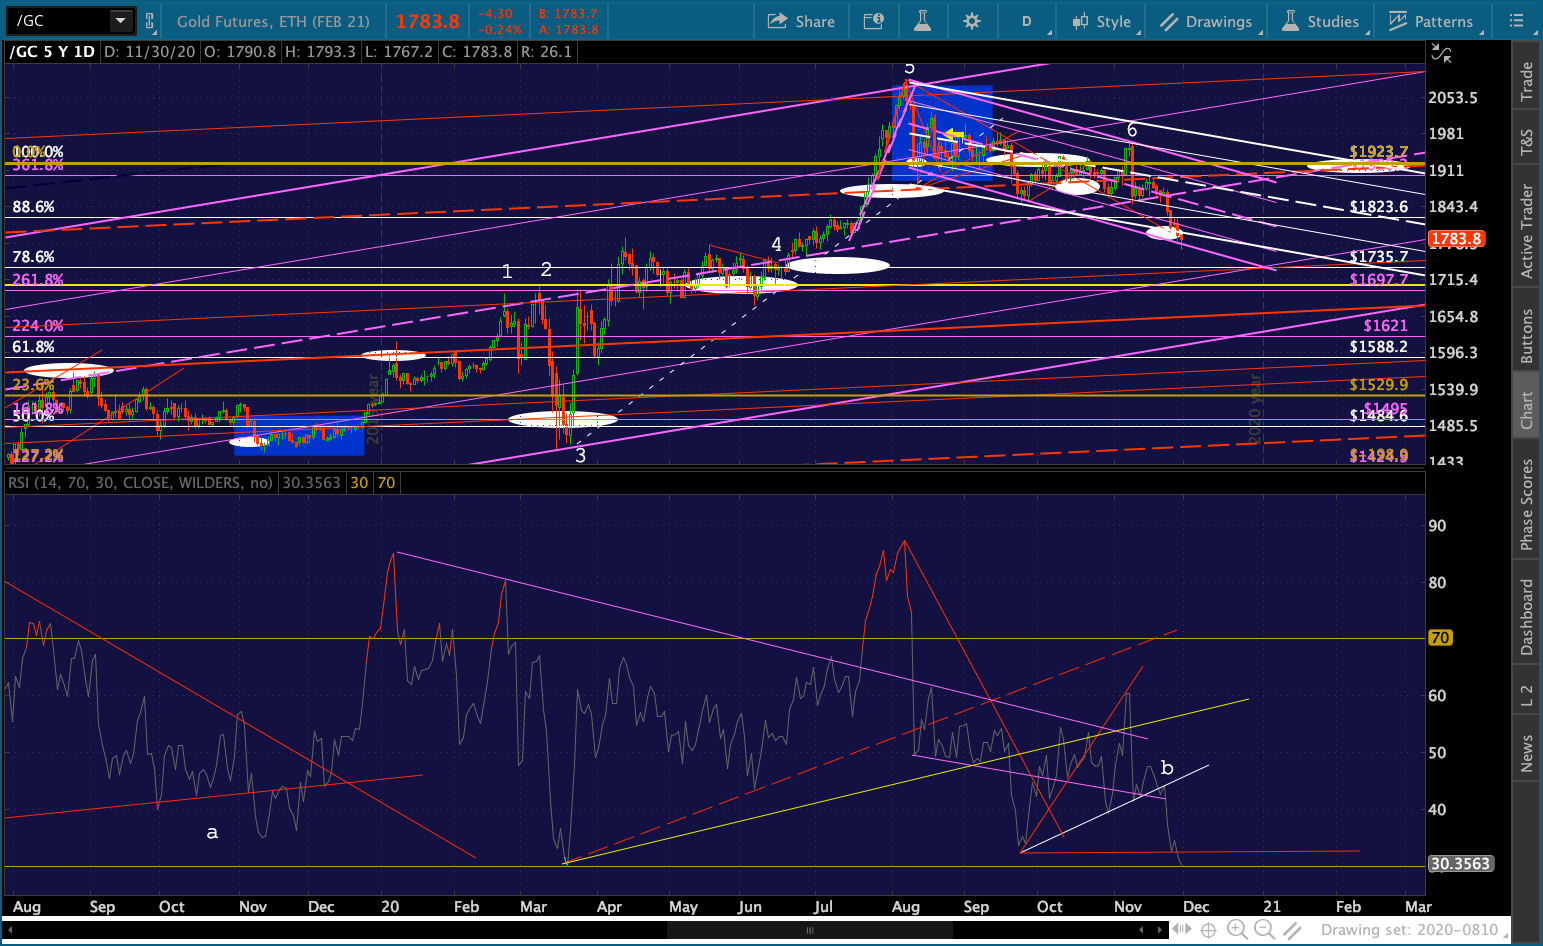 It traded below its SMA200 six sessions in a row, including two sessions where it closed below its SMA200.
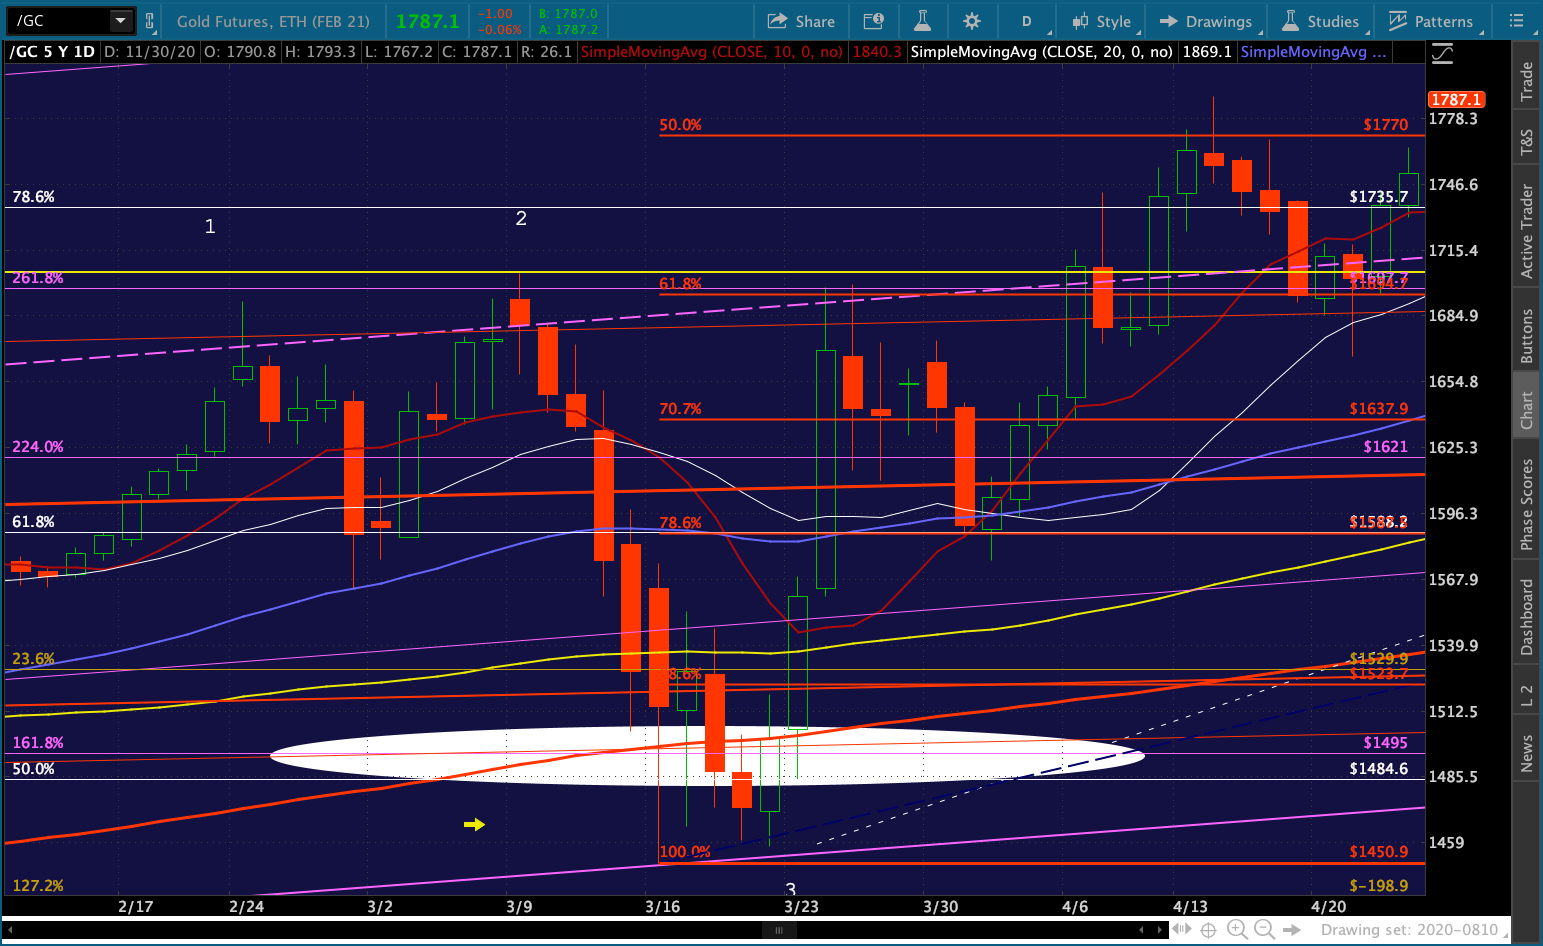 If it bounces here – and especially if it can regain its SMA200 and ZN holds its rising red channel – GC stands a very good chance of bouncing back up to its purple midline, currently at 1867 with the SMA20. If it can keep the bounce going, then the rising red midline and rising purple midline intersection at 1923 looks good. If it can bounce out of the falling purple and white channels, then we can start talking about the white 1.272 at 2162.60.
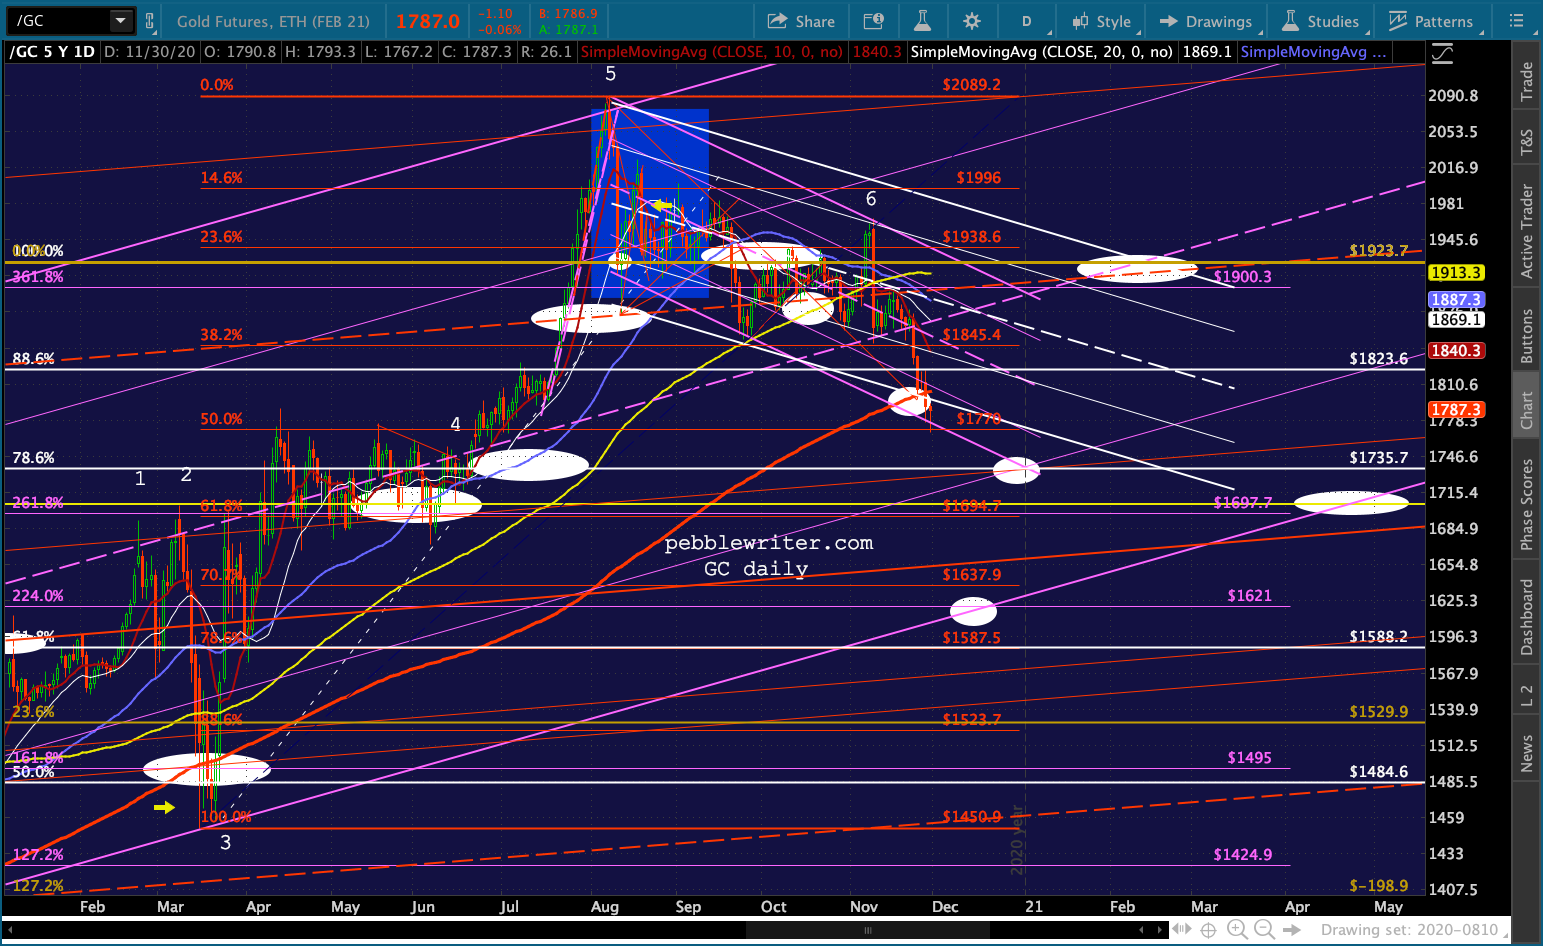 If ZN breaks down – meaning TNX is breaking higher – then don’t look for GC to recover any time soon.
What about SI?
I had originally expected it to backtest its SMA200 back around Nov 9 when it intersected with its red trend line and falling white channel bottom. 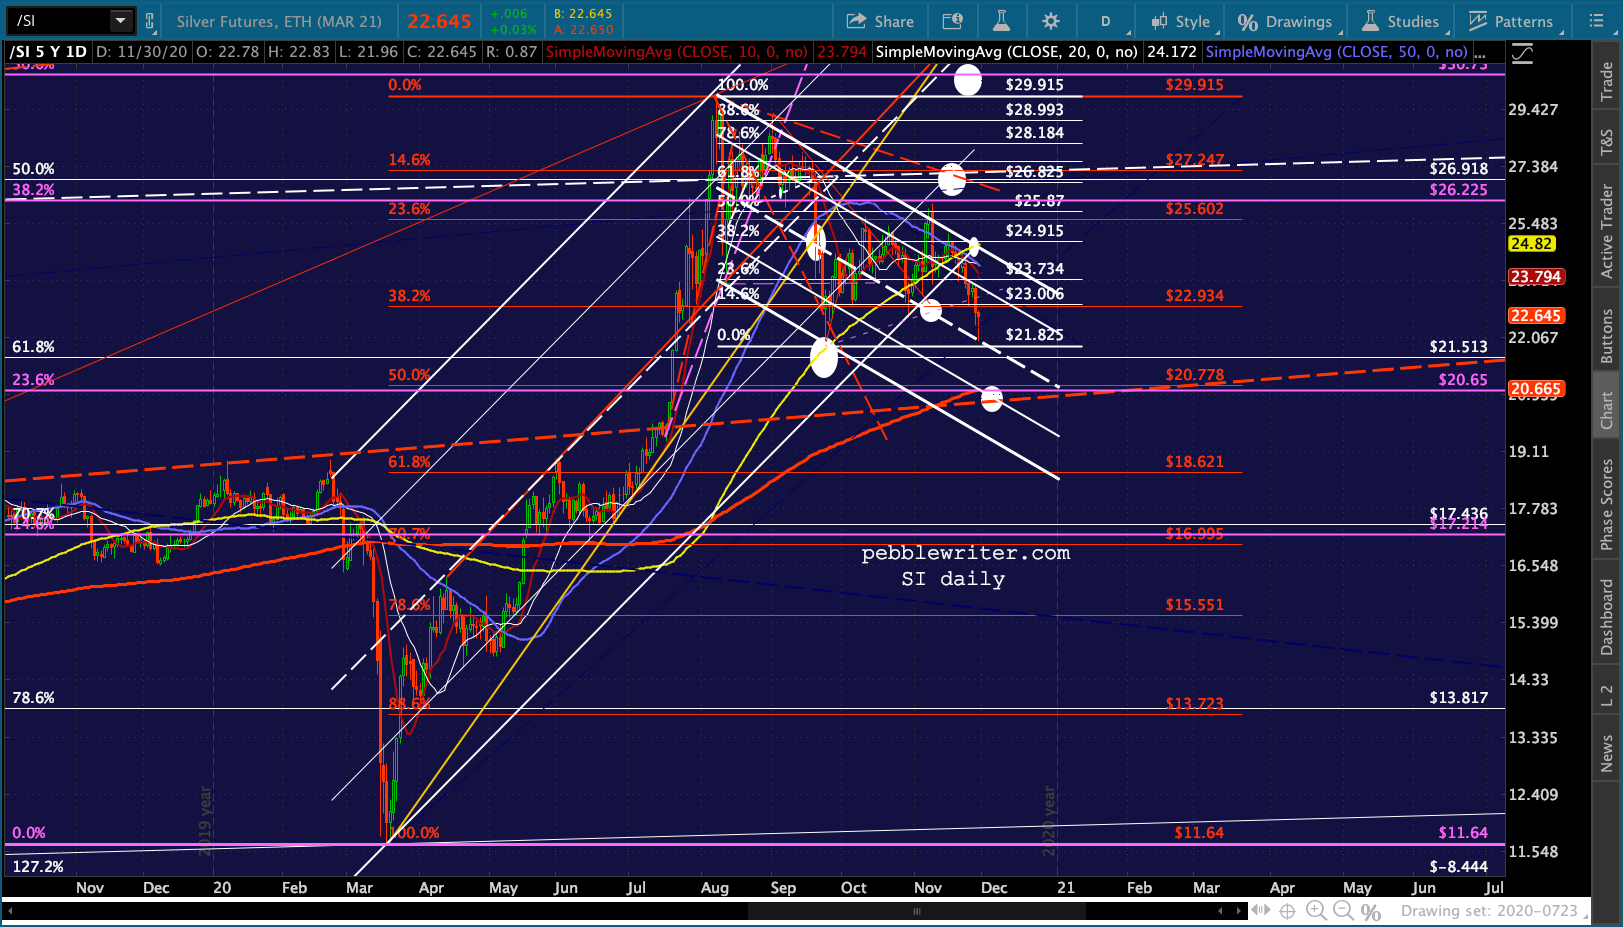 Now it has another shot at it as the SMA200 is coming up on the red .500 and is slightly above the red TL which, in my opinion, needs a proper backtest.
 The red TLs (technically fan lines) have been pretty predictive over the years. If SI can successfully backtest and remain above the lower of the two, it stands an excellent chance of backtesting the higher one – potentially where it intersects with the purple .618 at 35.235.
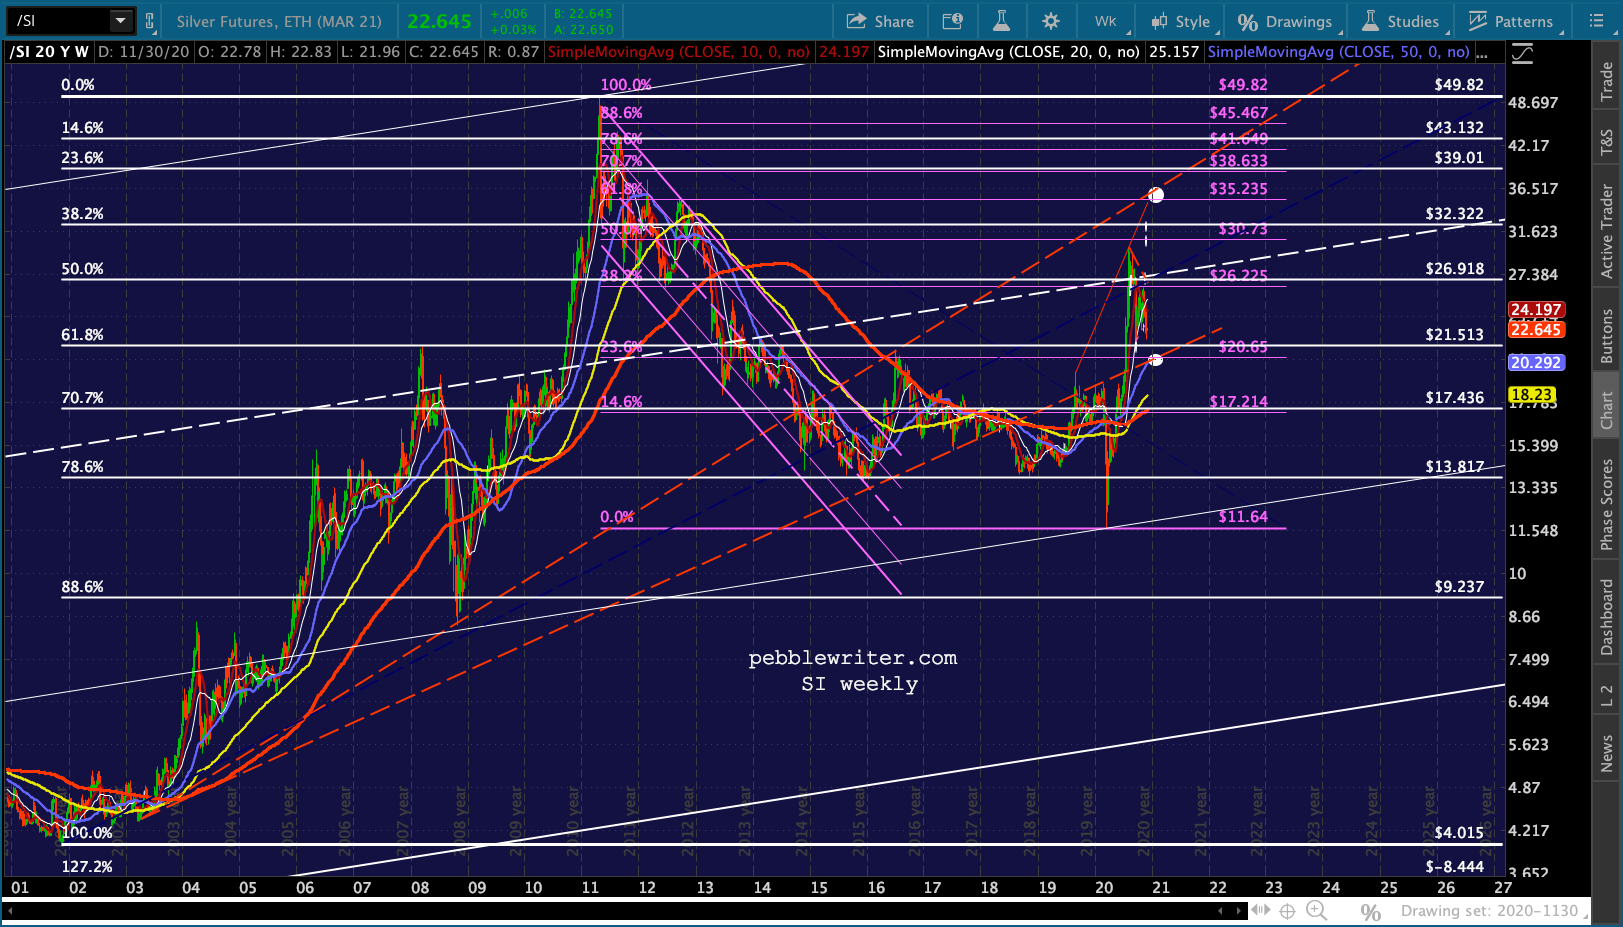 The white channel lines have been both overshot and undershot on a regular basis. But, we can’t ignore the fact that SI failed to push past it in August – again, when rates bounced and ZN didn’t break to new highs.
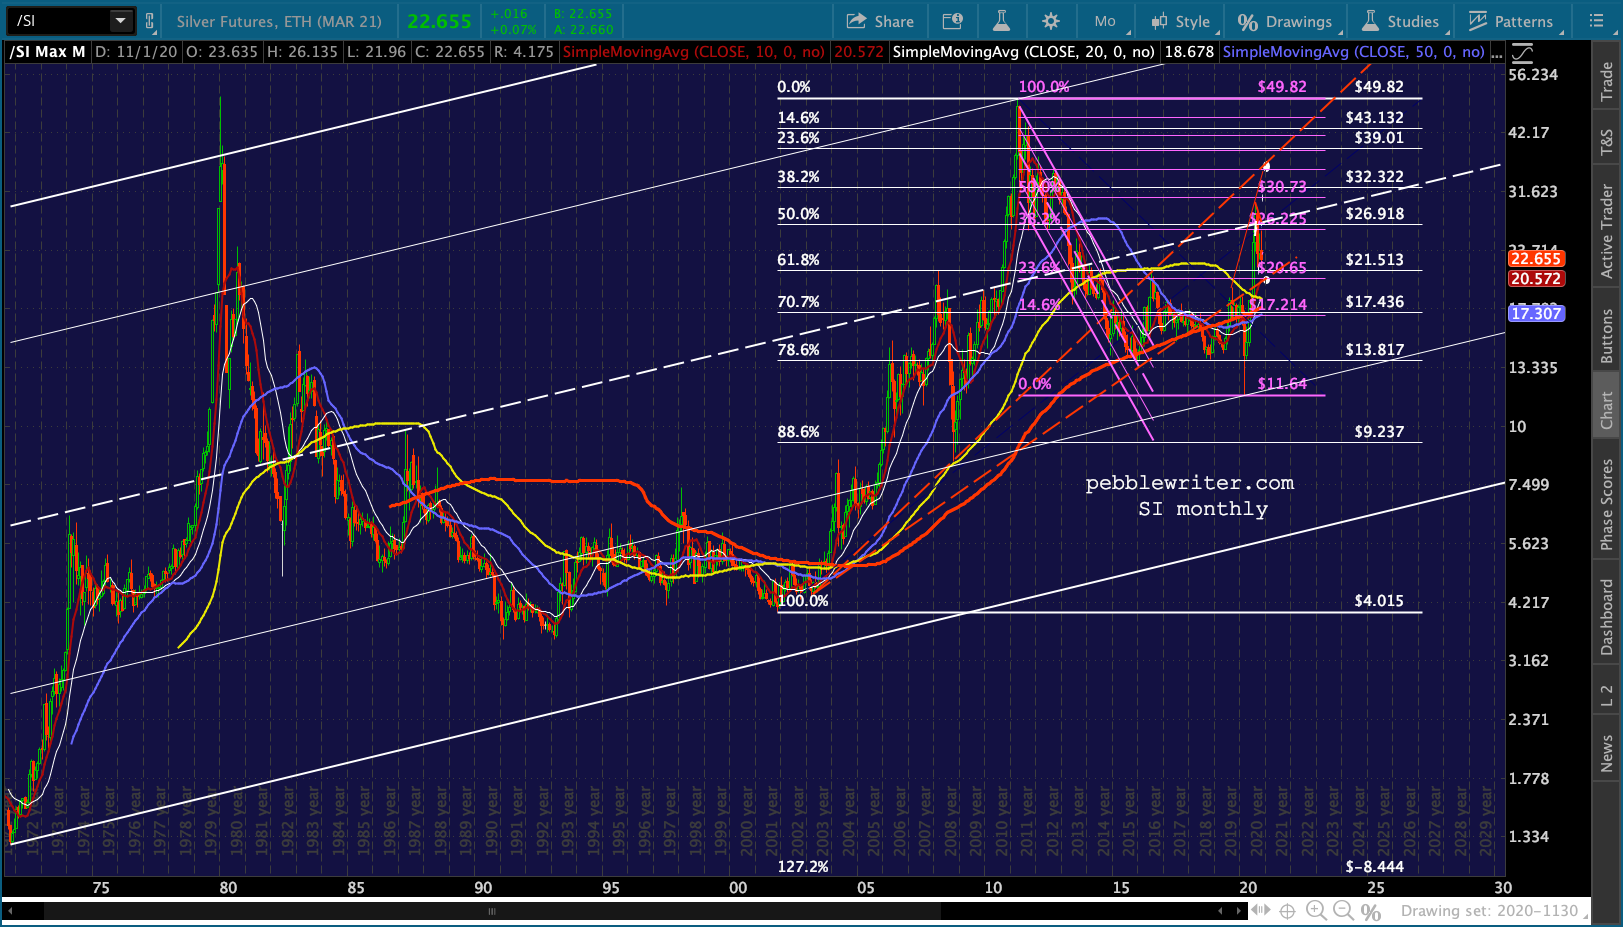 SI’s RSI chart echos its channel chart: today’s lows at 21.96 at the white channel midline is an important level of support.
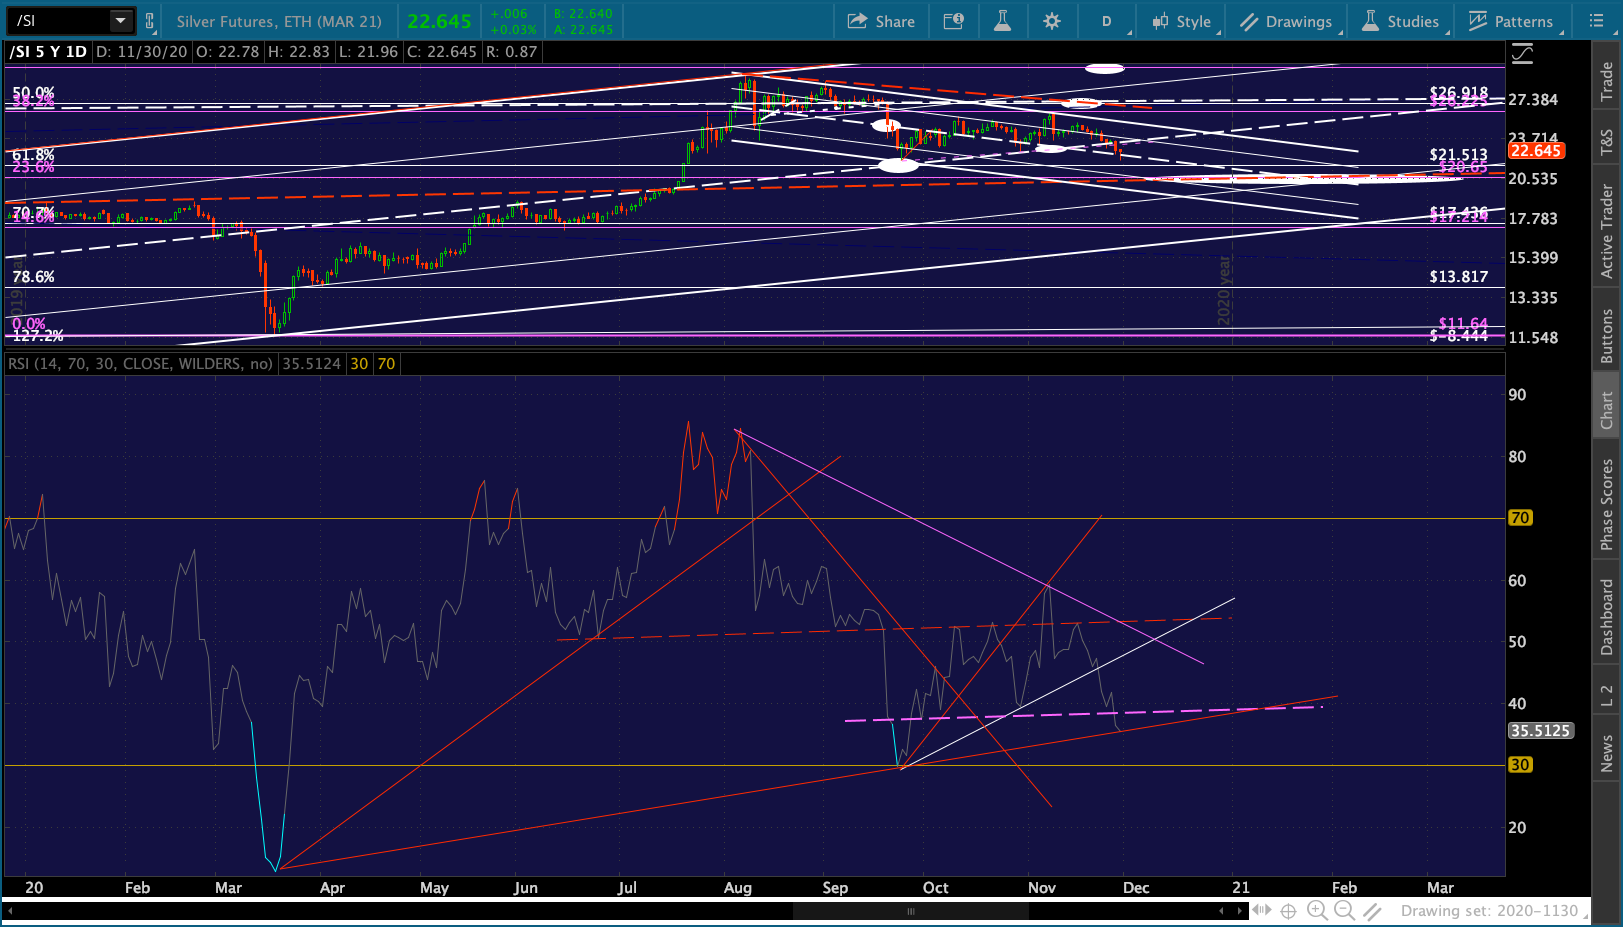
Comments
2 responses to “Update on Gold & Silver: Nov 30, 2020”
Do you see any gaps in the VIX below 17?
Apologies for not seeing this great question earlier Tim. Way back on Jan 31, 2020, I show VIX reaching 19.99. So technically, the 19.51 reached on Nov 27 closed that gap. I don’t show any other unfilled gaps going back to the Nov 27, 2019 lows.