

So…Janet Yellen again. The market seems quite pleased with the idea of a dovish Treasury Secretary paired with a dovish Fed. Is this the end of equity corrections?
 continued for members…
First, a quick overview:
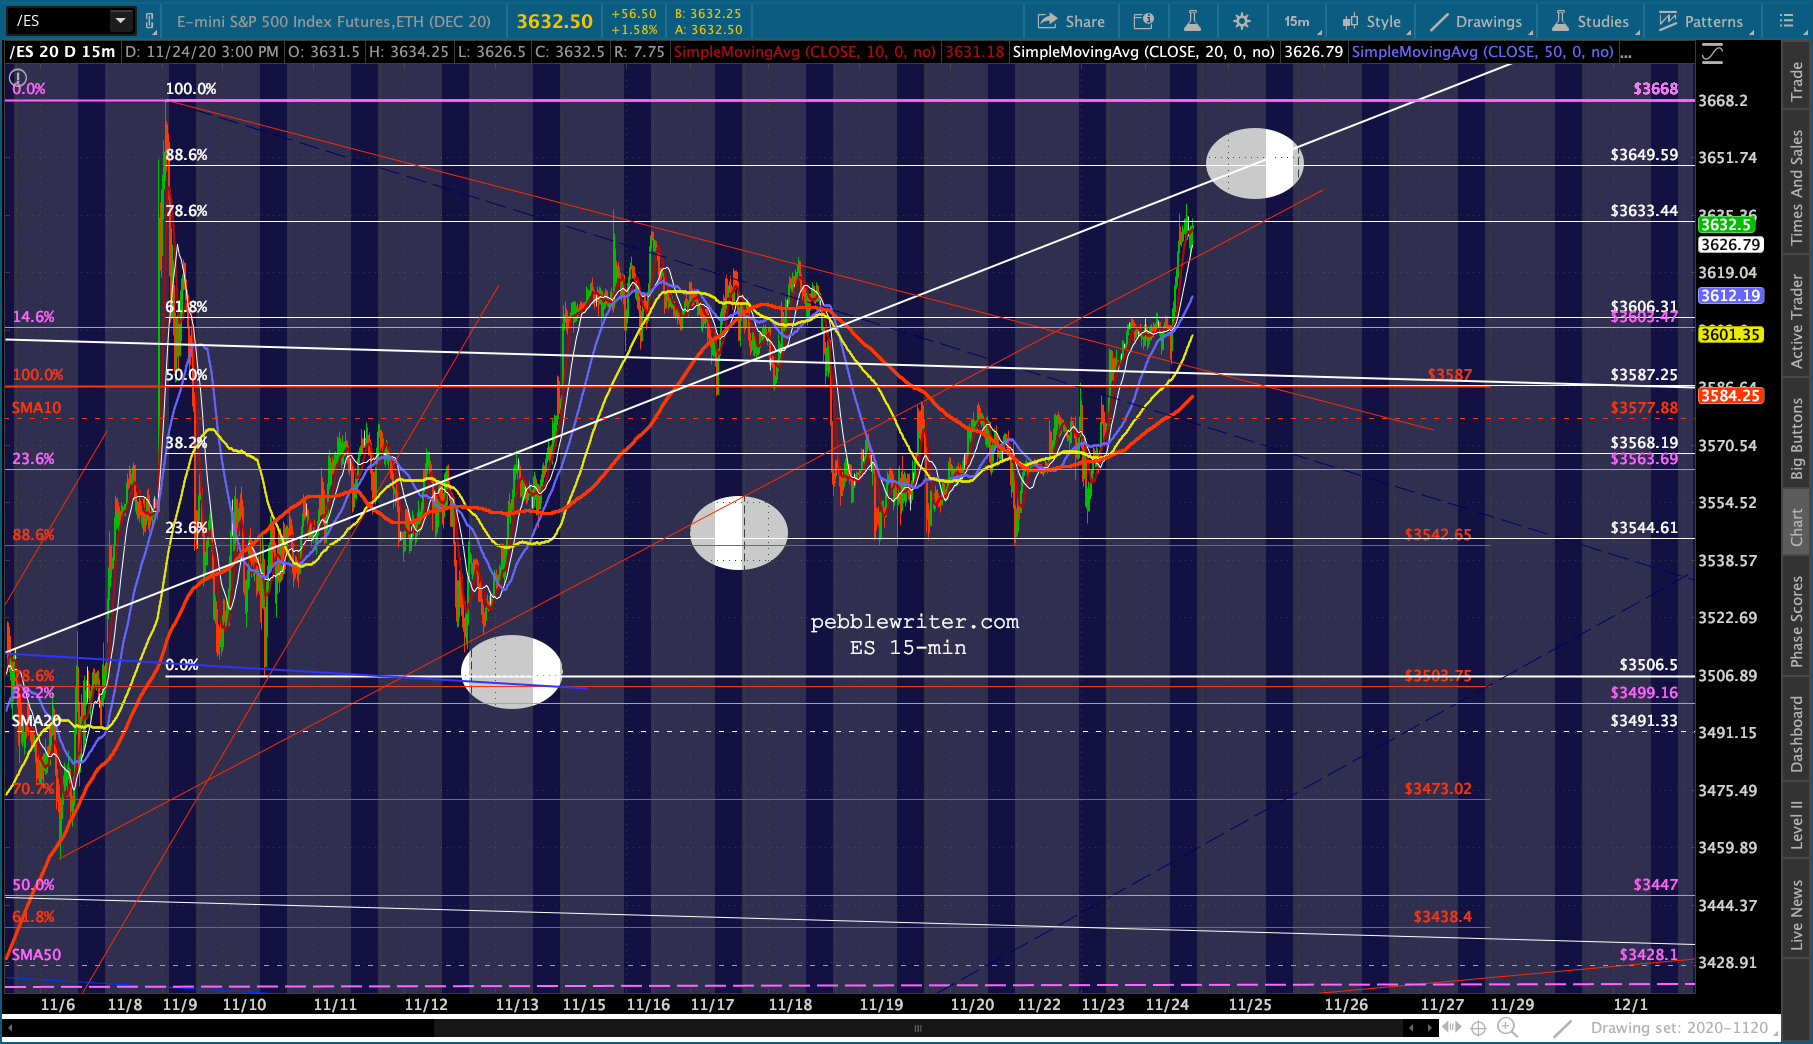
ES has broken above the little red TL – though it’s still a broken channel.
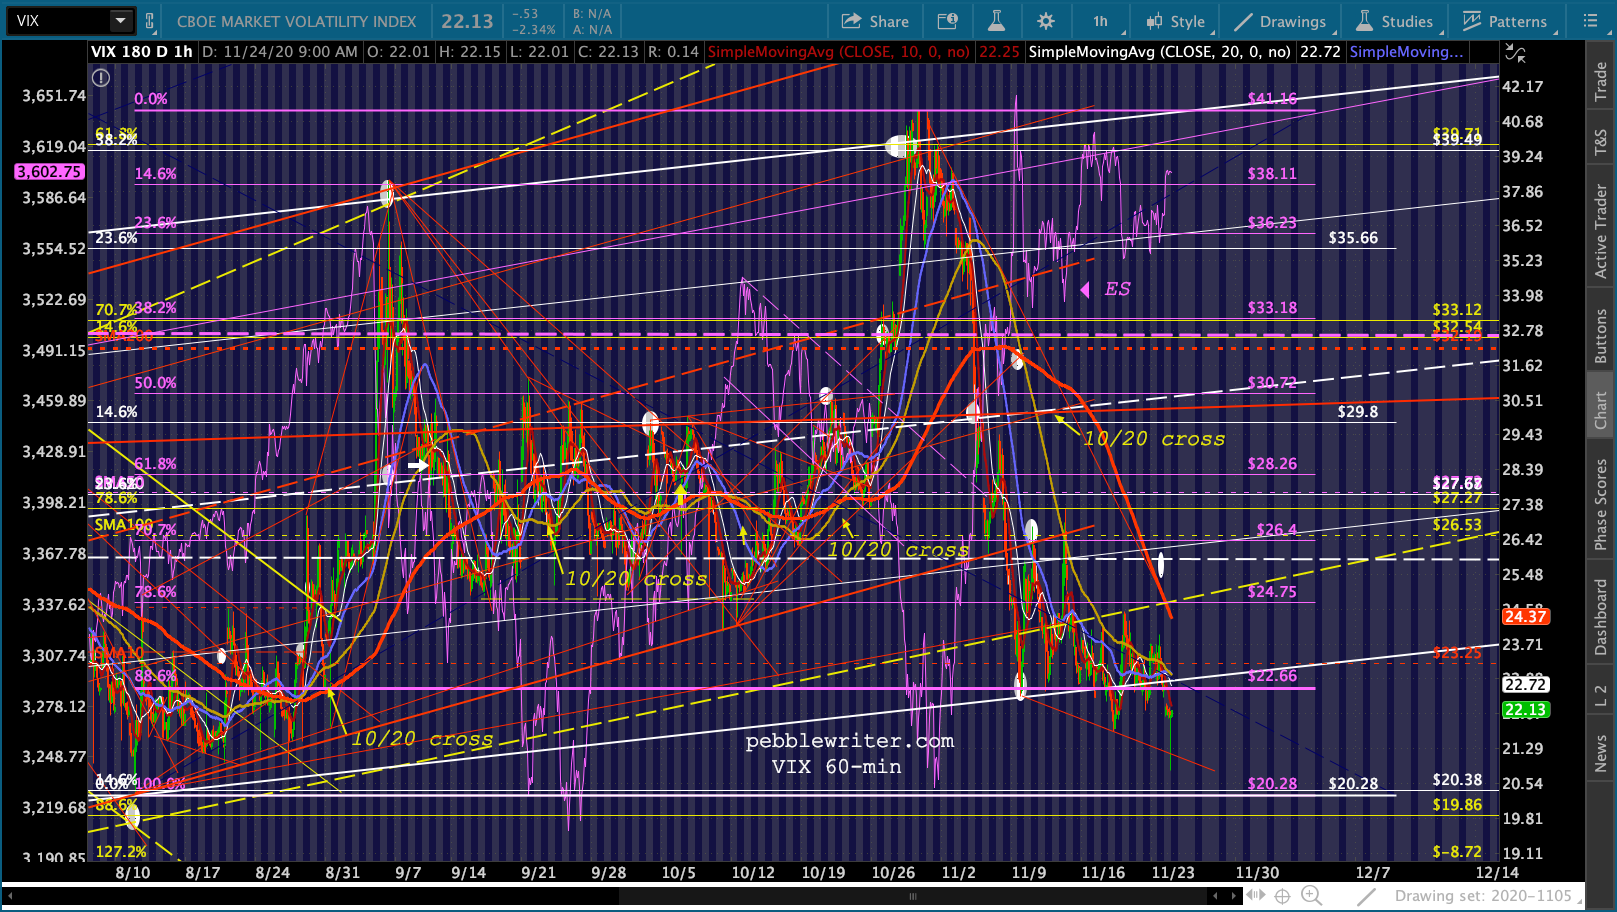
 SPX’s channel is obviously still broken down and backtested – a bearish situation EXCEPT that…
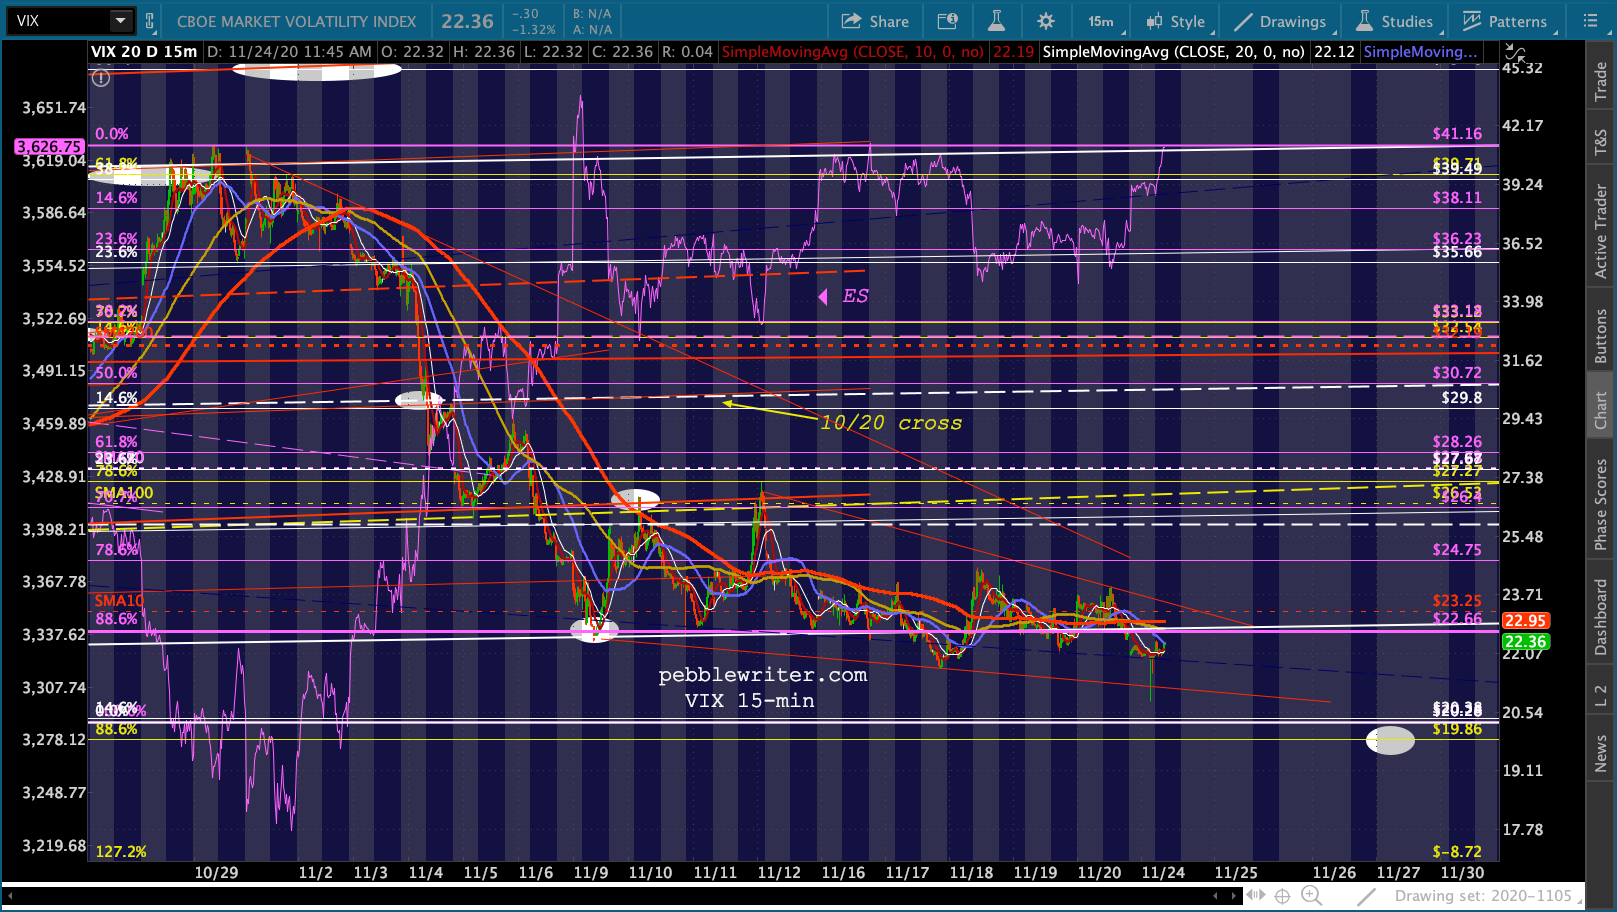
 …VIX is making new lows and has plenty of room between here and the .886 at 19.86 and beyond.
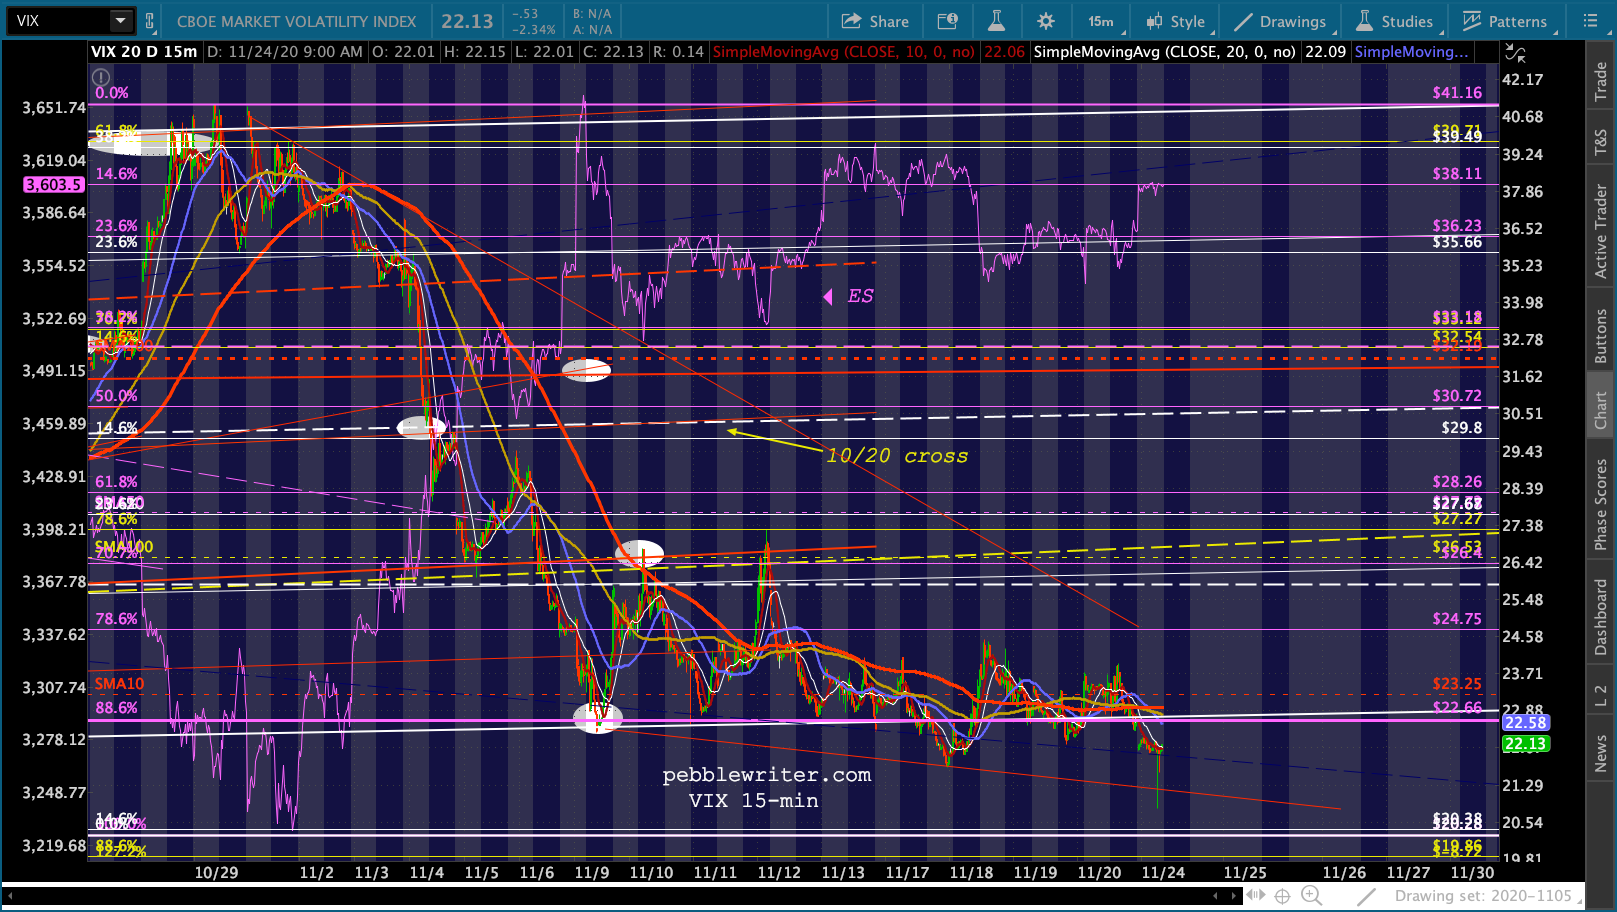
 The next most significant chart is actually RB – which completed an Inverted Head & Shoulders pattern and notched new highs. It’s silly, of course, as lockdowns are on the rise and the seasonal factor argues for falling and not rising prices.
 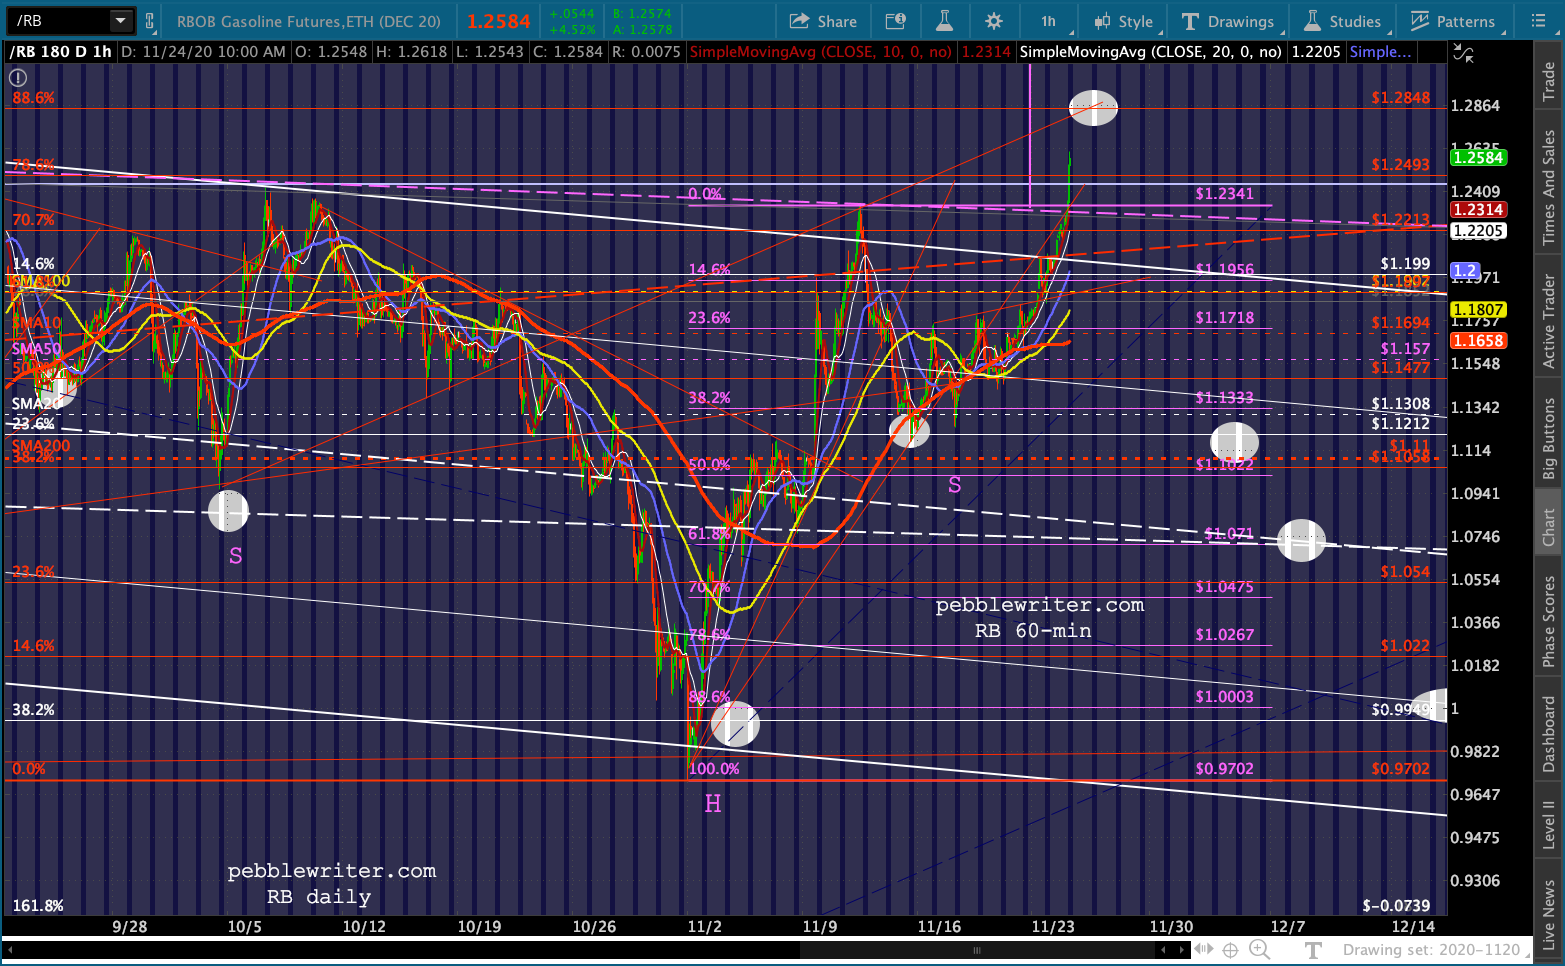 If the pattern were to play out (it has to get past the .886 at 1.2848), it targets 1.50. Imagine what that would do to inflation and, potentially, interest rates.
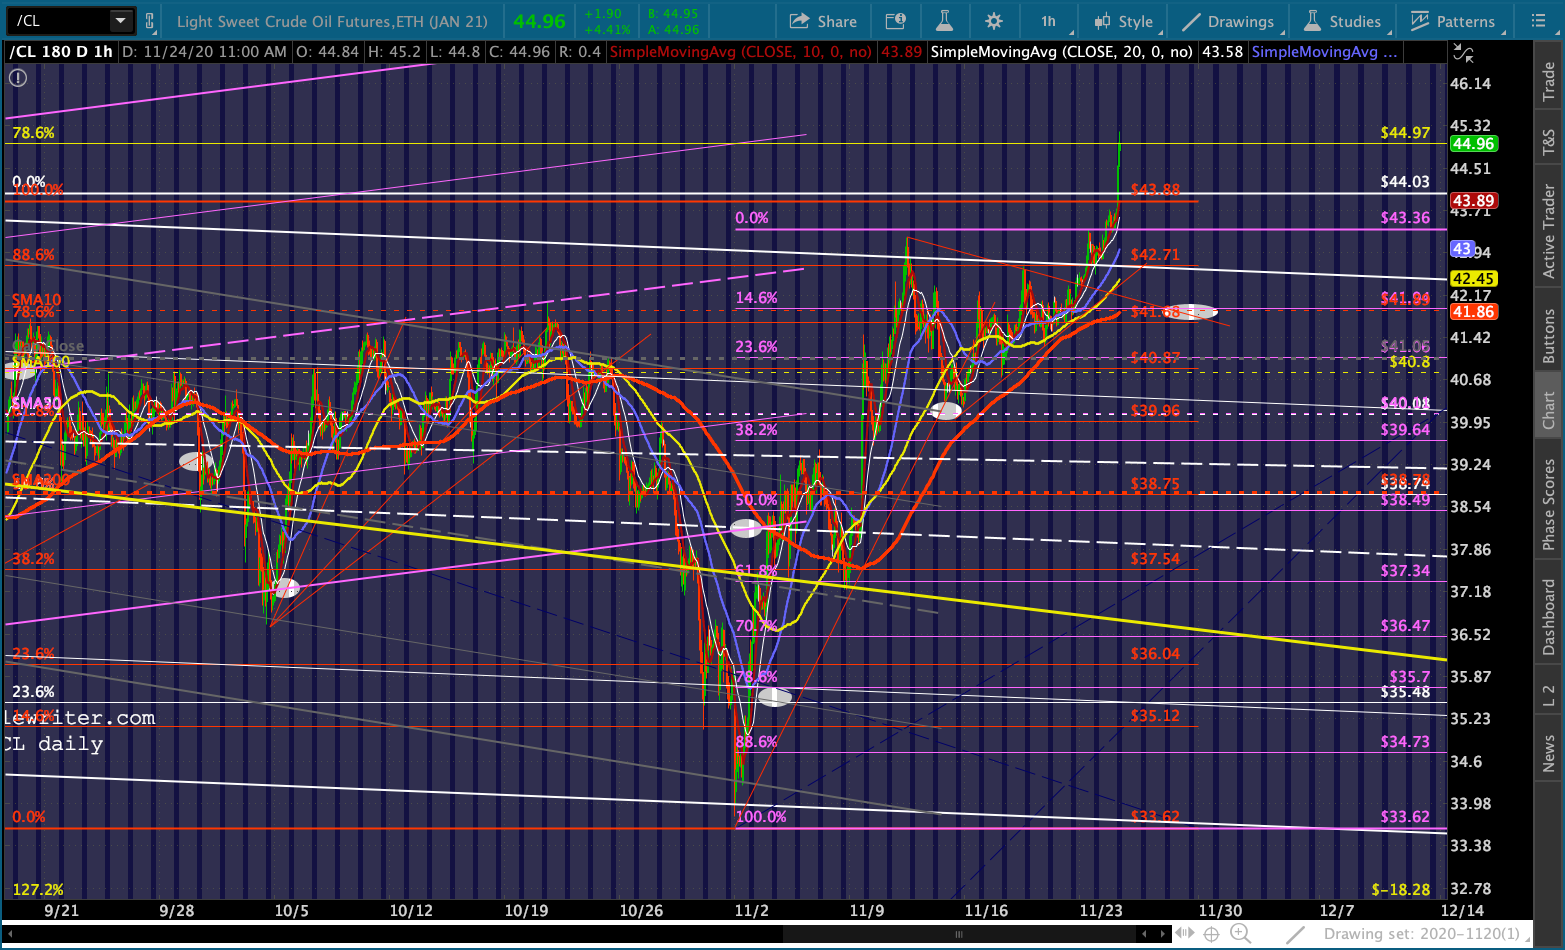
 CL is likewise making new cycle highs. It’s a stunning 32% move since Nov 1 – especially since OPEC+ is rumored to be dropping its Production Cut Program at its meeting next week.
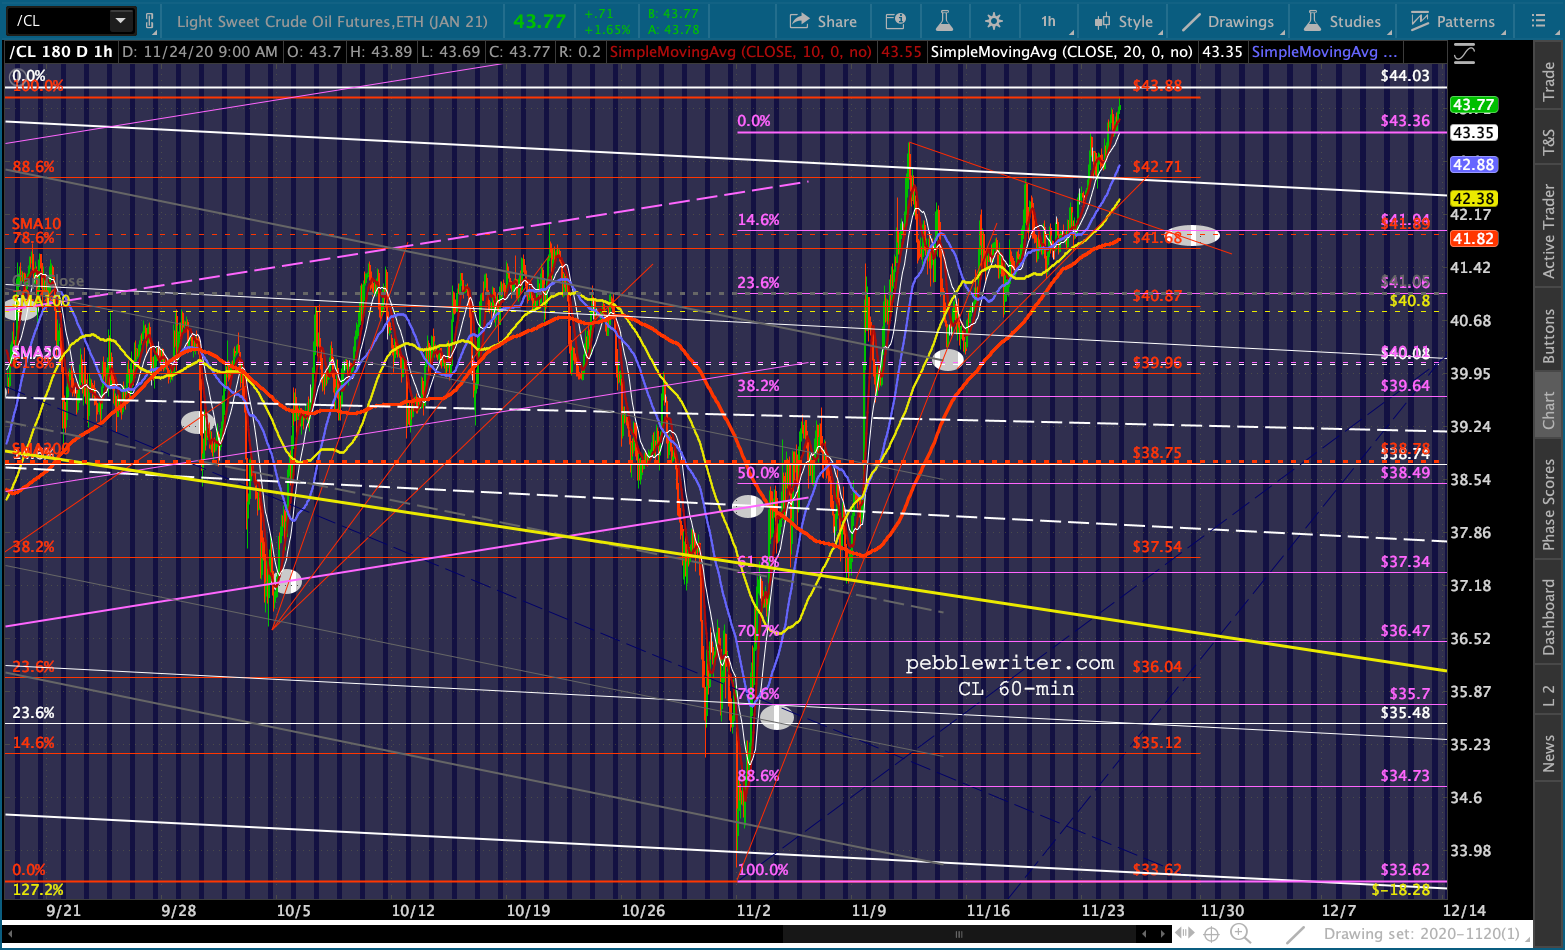
 And, just to be on the safe side, USDJPY’s rally is continuing…
 …driving NKD all the way to its 1.272.
  This has saved DXY from its breakdown, at least for the moment.
  But, since EURUSD can’t break out, the next move will still have to come from USDJPY if DXY is ever to reach support. As we discussed yesterday, Friday is a good candidate for surgical strike.
  GC finally reached out SMA200 target, which means a potential bounce and simultaneous DXY breakdown.
 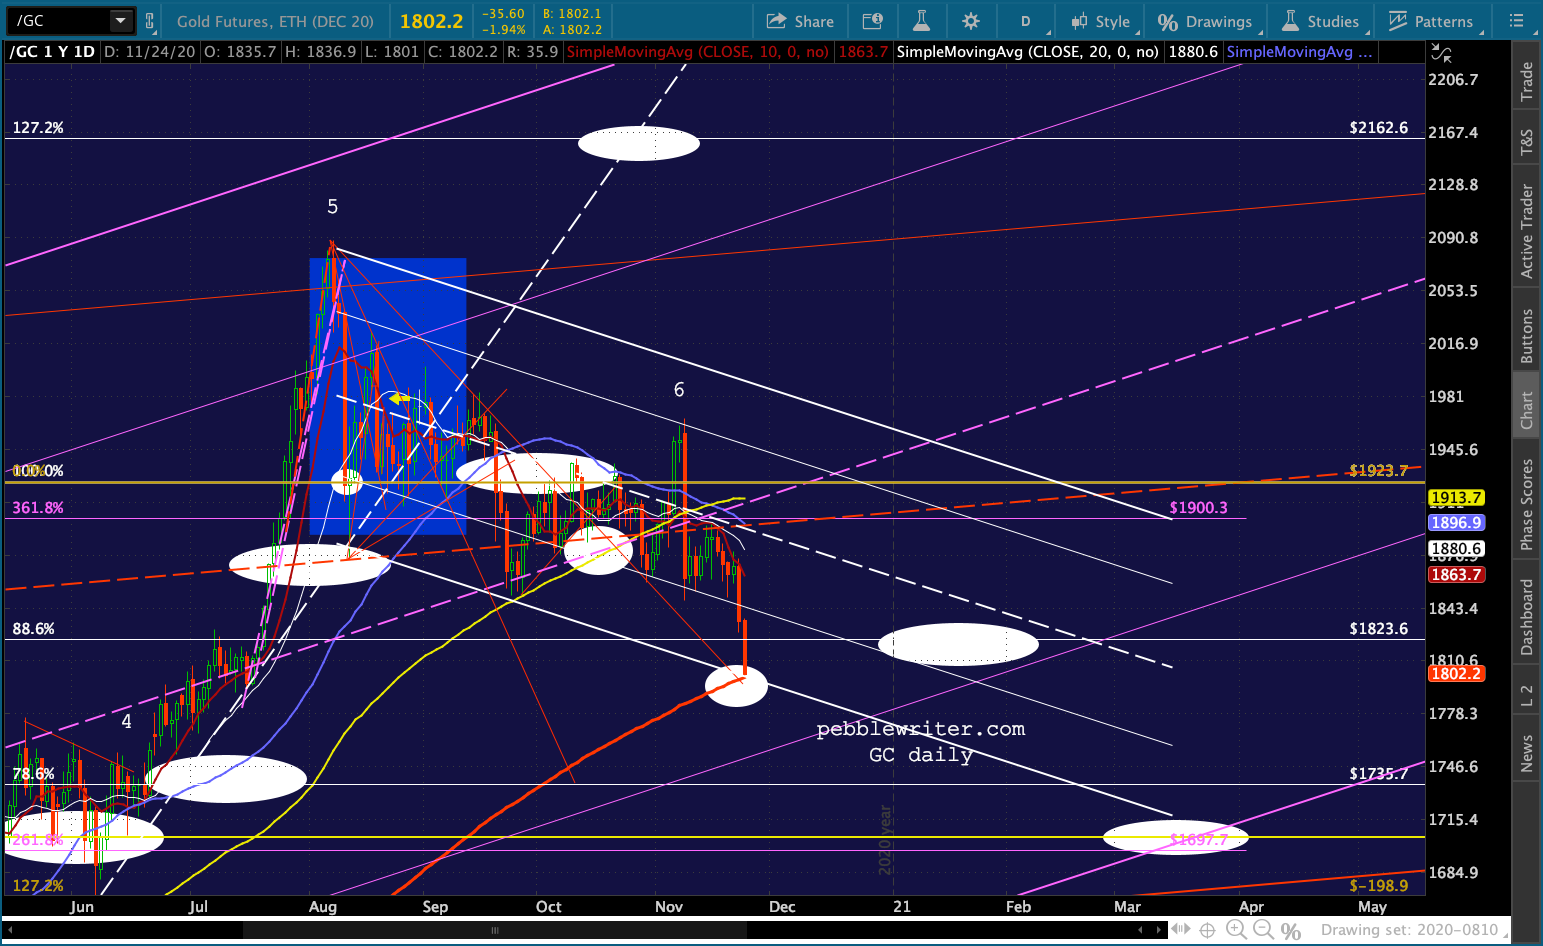 SI hasn’t reached much in the way of support. But, note that its rising channel has clearly broken down. If it holds, this is an important shift in momentum which suggests the SMA200 tag will occur when it reaches the .618 at 21.51.
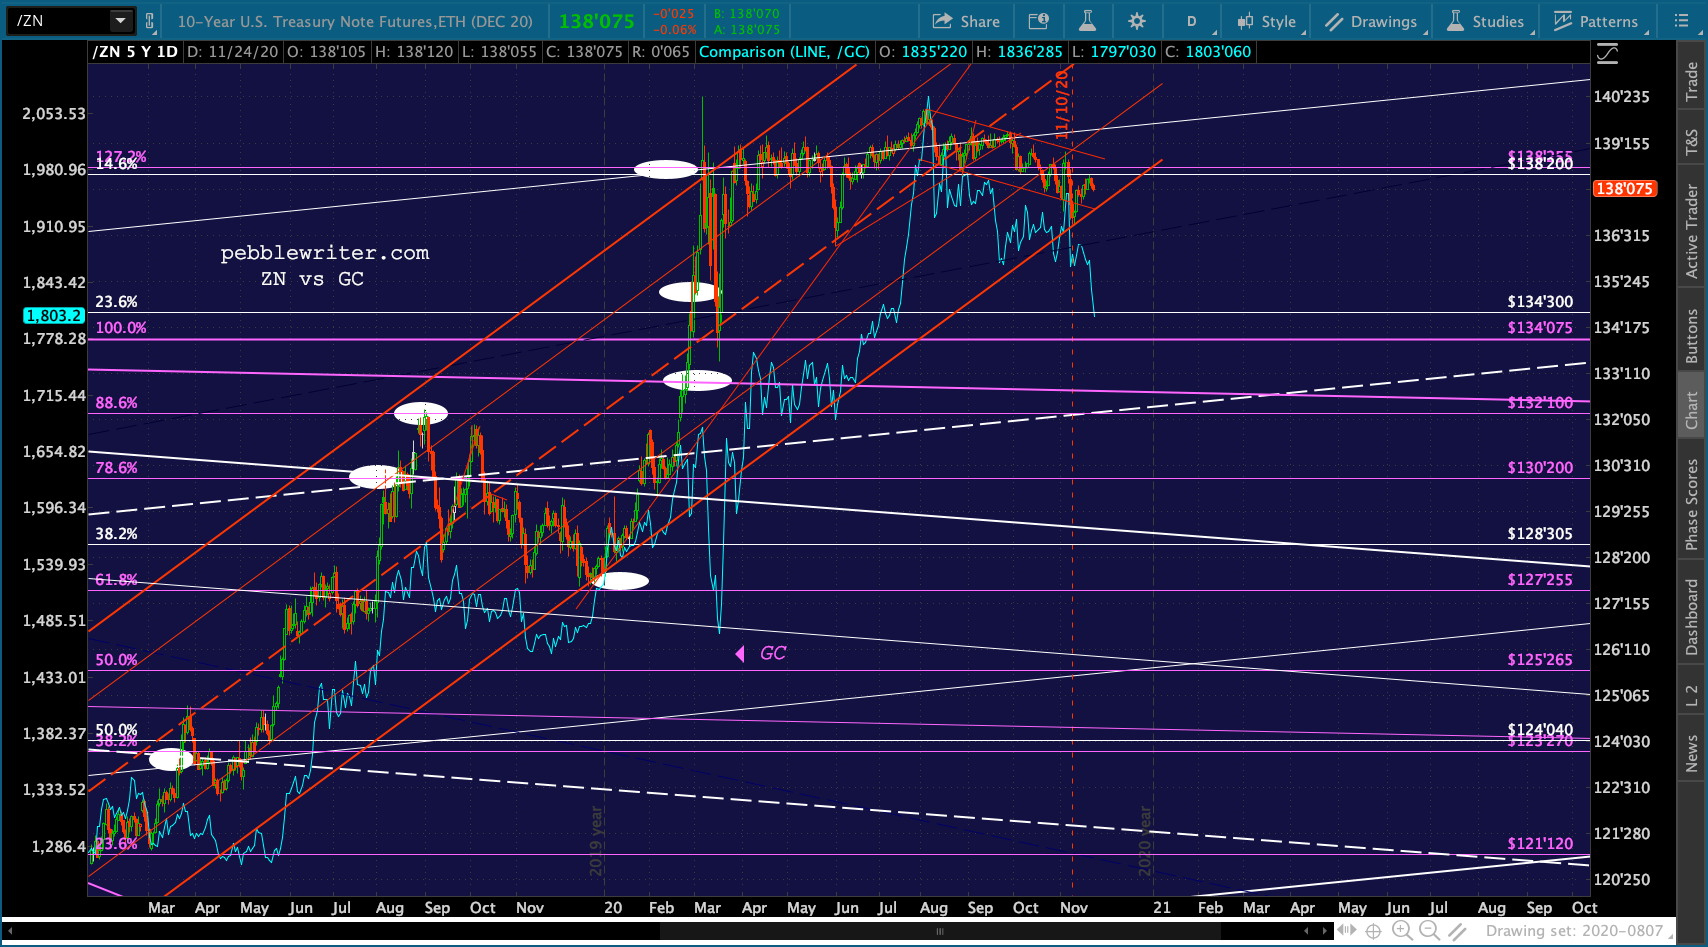
 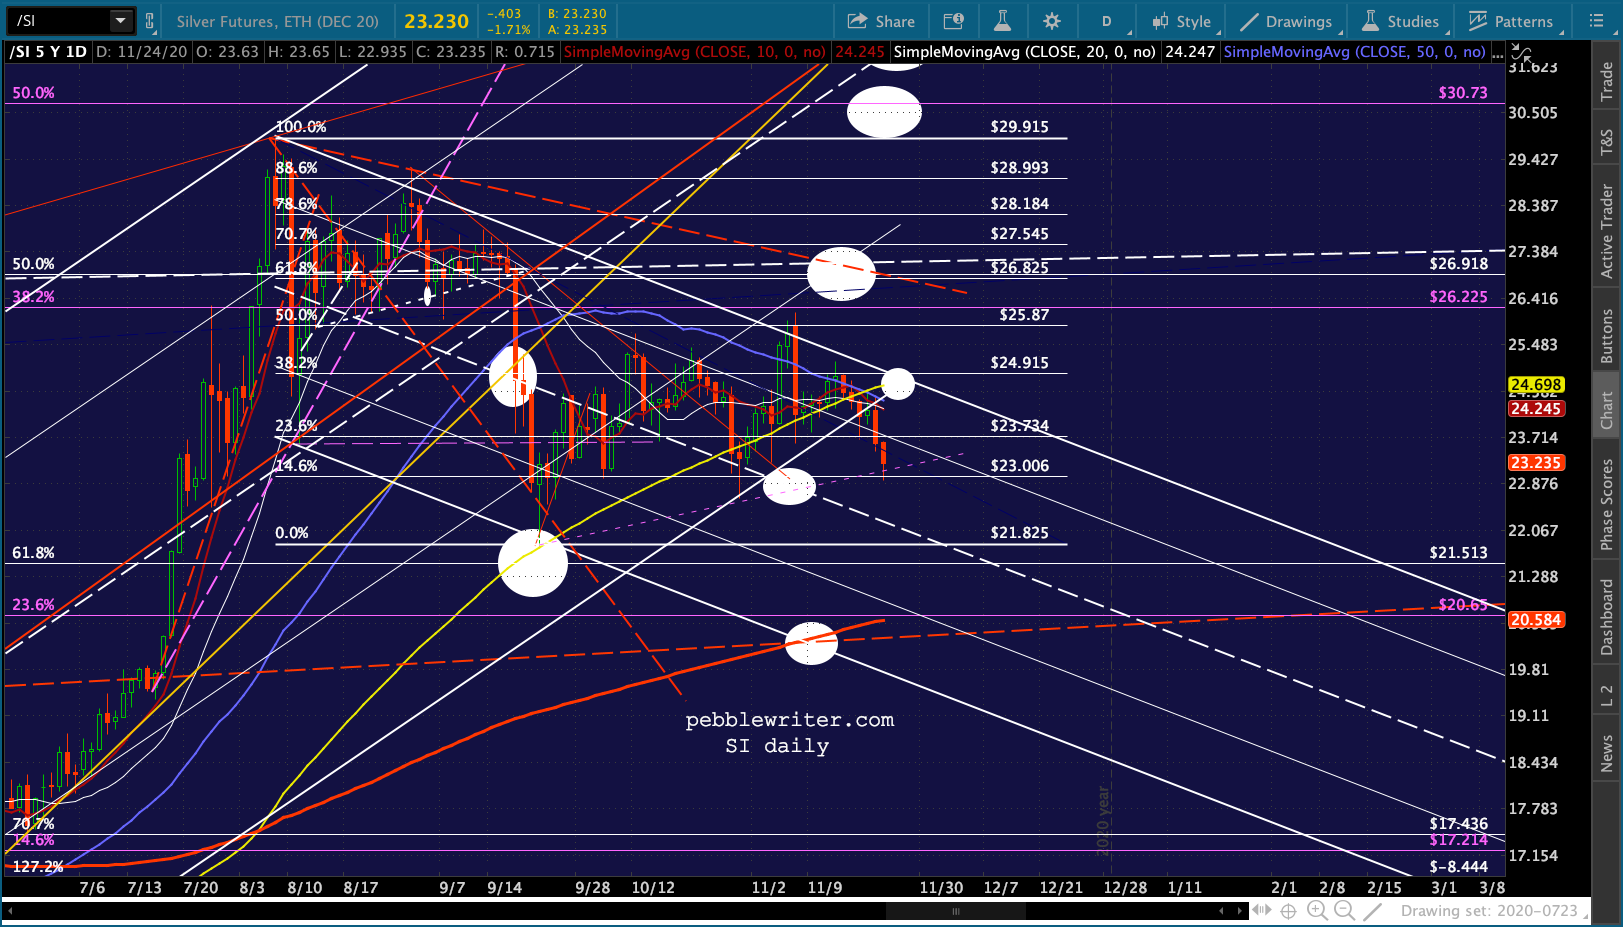 Though GC and SI are signalling a decline in inflation, money supply and stimulus, the bond market is trying to put on a happy face.
 TNX’s falling wedge has broken out prior to reaching the rising white channel bottom…
 …and the 2s10s is back above horizontal support – at least a little bit.
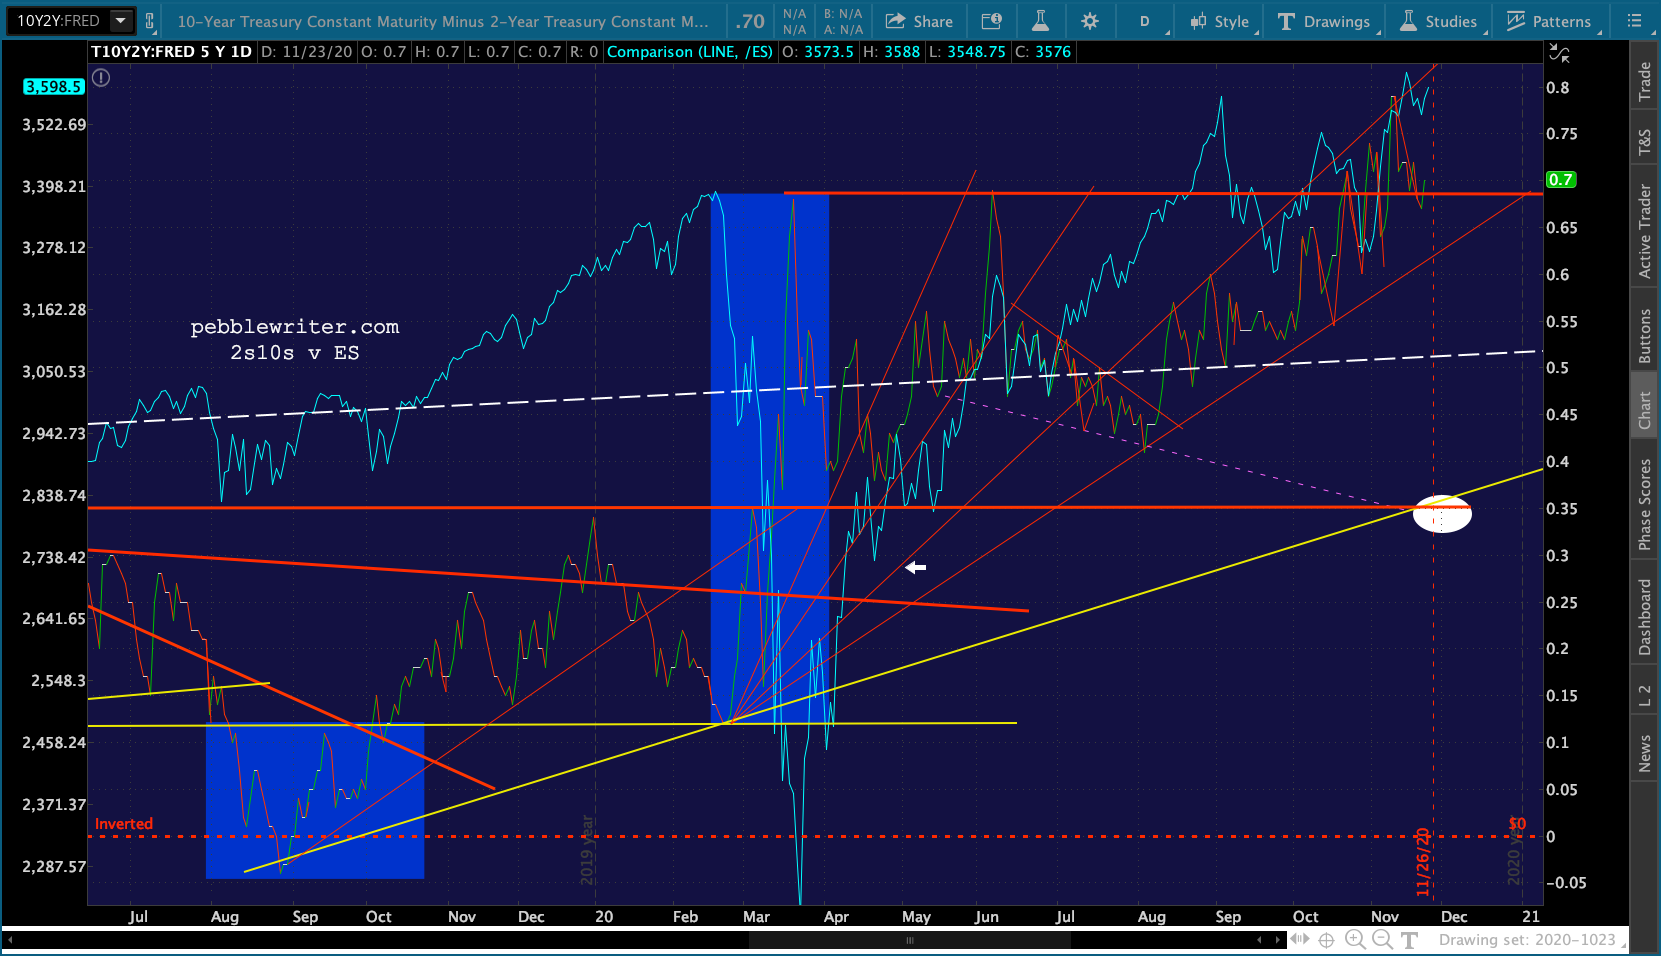 UPDATE: 11:45 AM
ES is still melting up as VIX, CL and USDJPY are all still working it higher. A move past 3649.59 likely means ES will rejoin the broken white channel and make new highs.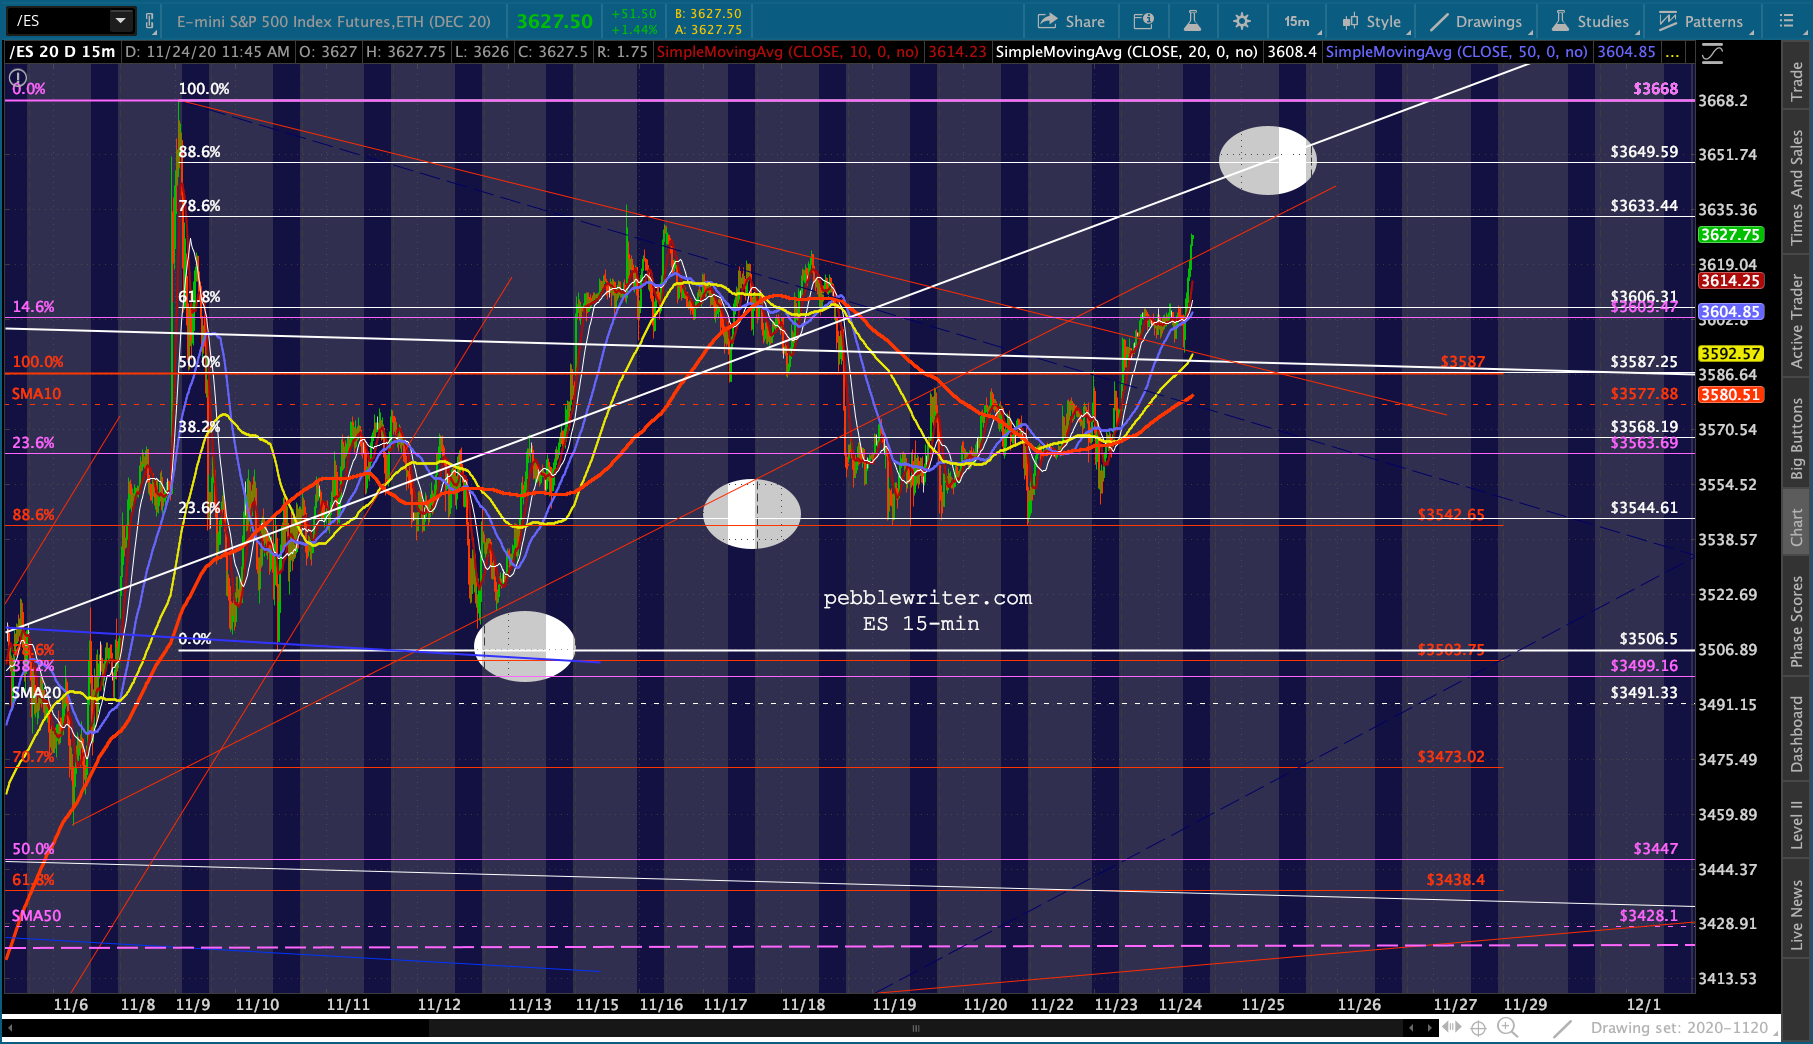
 I have a couple of calls to make, but will be back around 3pm – hopefully with better insight unclouded by frustration over this broken market.
UPDATE: 3:25 PM
Put yourself in Powell or Yellen’s shoes. The economy is on life support – with about 1/2 of those thrown out of work by the pandemic still unemployed. Roughly 1/3 of small businesses won’t make it. Foreclosures and evictions are less than a month away. Oh, and there’s $27 trillion in debt which, if it were ever to priced at the long-term averages, would consume every penny of income taxes collected – and then some.
Would you be worried about market integrity? Or might you be worried instead about the survival of the economy? That’s where the rubber meets the road. A significant correction or crash in the equity markets which spread to bonds, mortgages, real estate, private equity, etc a la 2007-2009 could be the big one that can’t be recovered from.
The new big picture. If ES makes it past the red .886 at 3542.65 and the previous high at 3587, the white 1.272 awaits at 3730.29. ES can reach it without rejoining the broken white channel, simply backtesting it higher and higher. Note that would also be a backtest of the red .786 channel line which marked the Feb 2020 highs and nearly marked the Sep 2020 highs.
The downside case, on the other hand, is relatively unchanged. The rising yellow channel bottom crosses the 2.24 Fib at 2728.79 around Jun 18, 2021, while the yellow .236 channel line crosses the 2.618 Fib at 3076.93 around the same time. From a reversal at 3730, these would be drops of 26.9% and 17.5% respectively.
An equally appealing target if ES can’t push past 3730 is the white .618 at 2930.12. Quite often, a reversal at the 1.272 extension results in a pullback to the .618 which, in this case would be a 21.4% drop – a common enough correction.
 I’ll toy with that chart more over the next few days. In the meantime, here’s where we are now.
 Still need to make adjustments to SPX, but you probably get the idea.
 USDJPY is surprisingly still in a bearish 10/20 cross, meaning the DXY breakdown is probably imminent.
 With the SMA200 in the bag, I’m exploring some different paths for GC. I assume another round of stimulus is coming in January if not sooner.
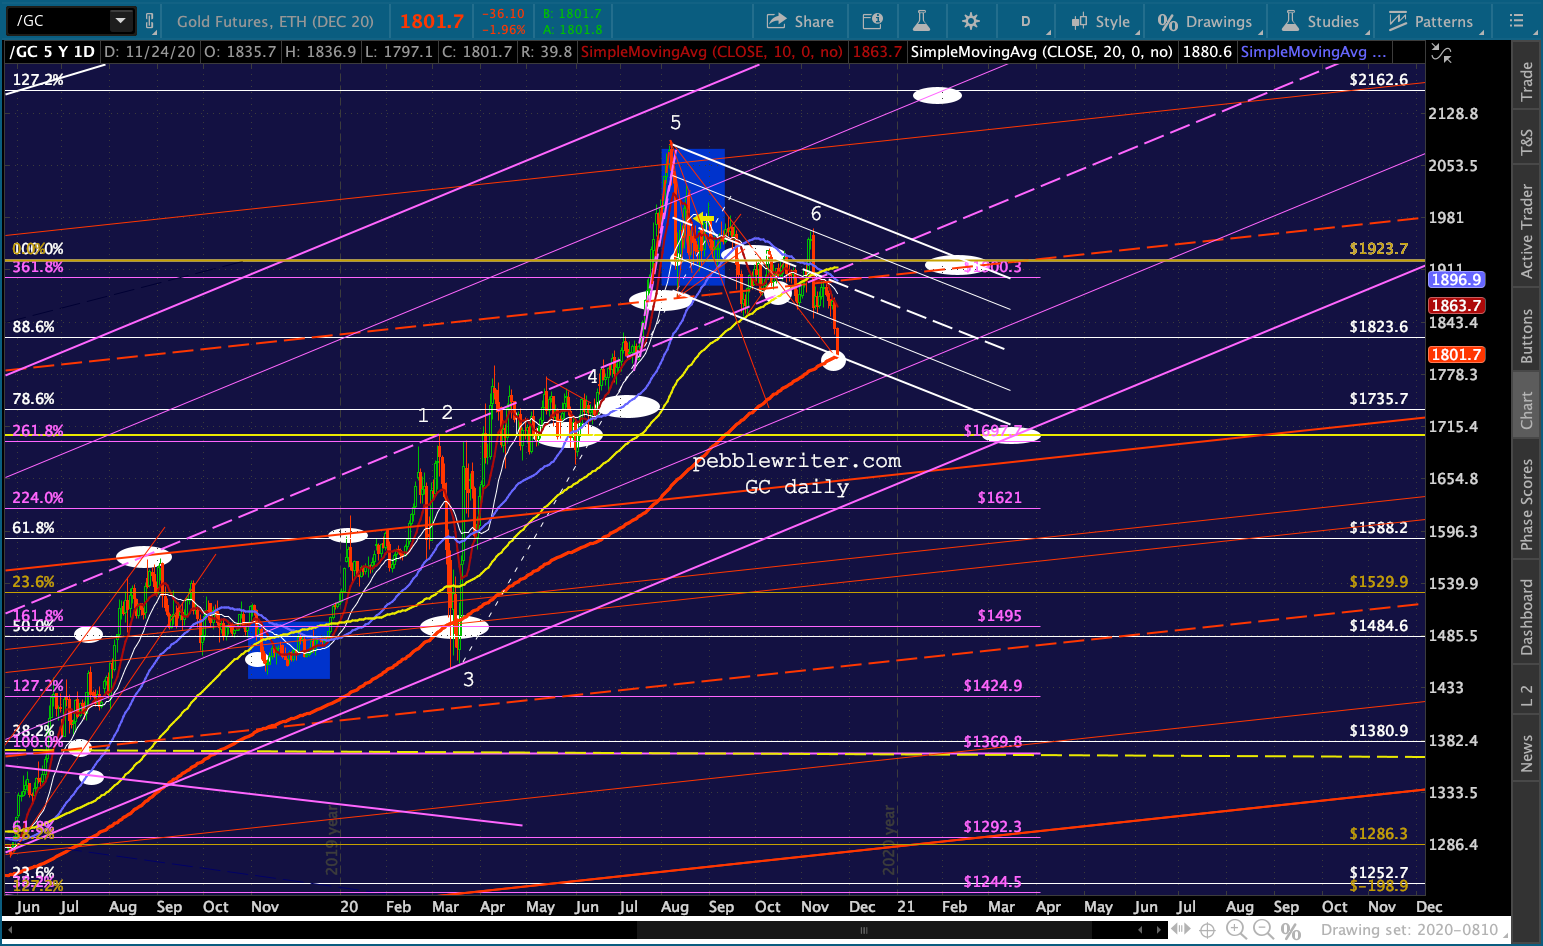
 CL’s new highs are very problematic from a charting standpoint. No wonder stocks have been goosed so high.
 Meanwhile, VIX continues melting down. It could do this every day through the end of the year – another few percent at a time.
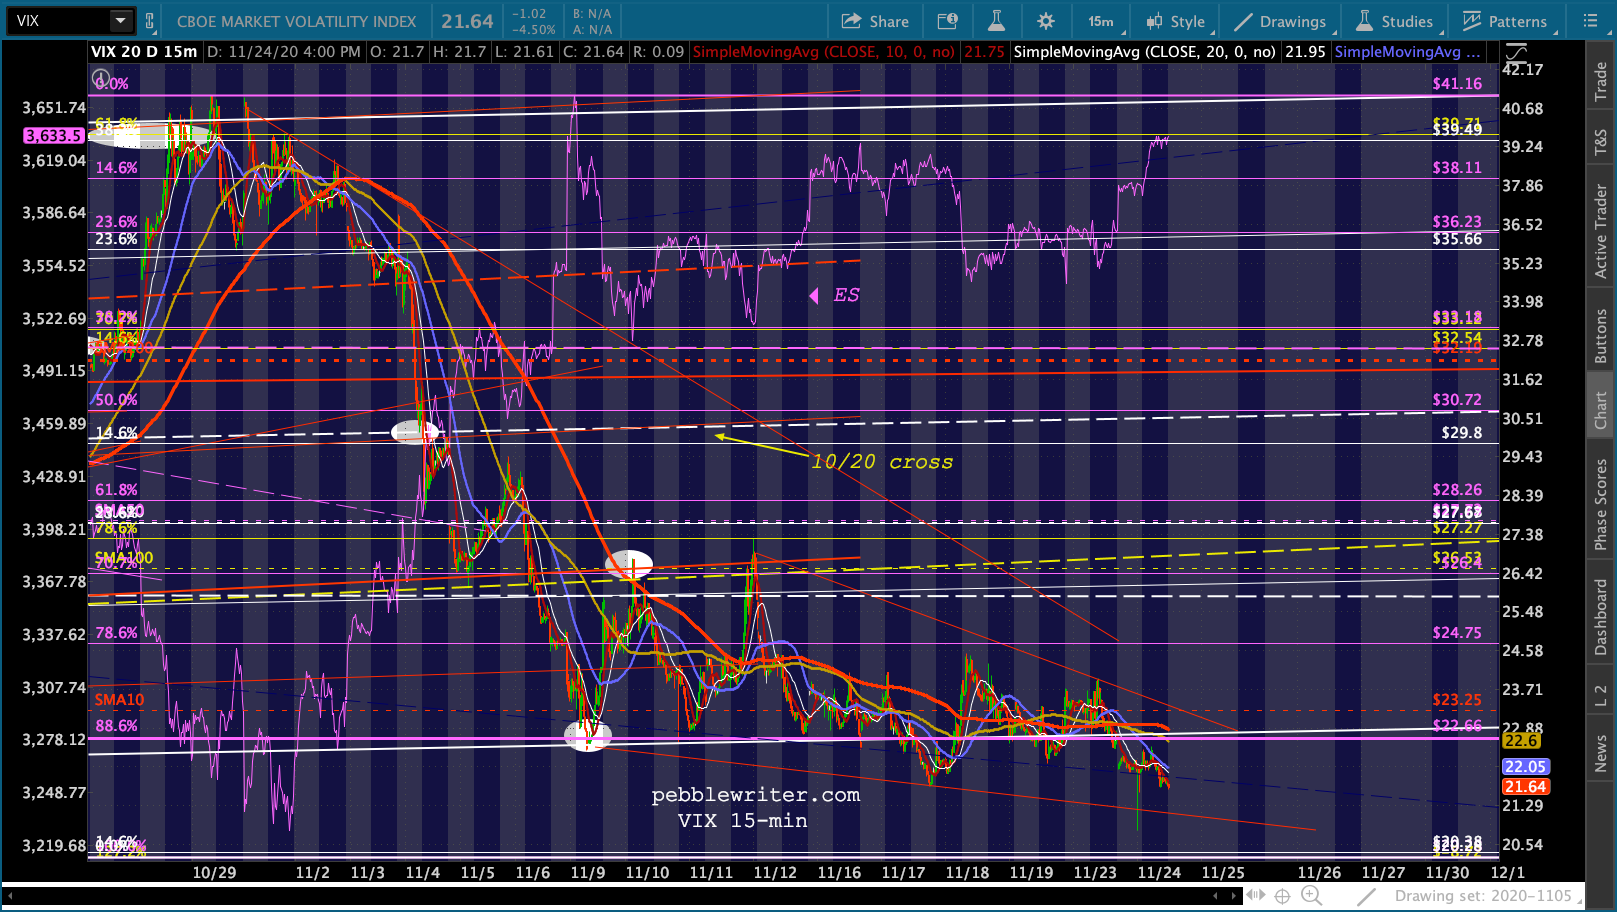 I’ll post the current charts first thing in the morning, but then I’m going to take the next few days off and work on the big picture. If we’re to enter another period of meltup, I’d like to suggest a reasonable path to follow. If there are tripwires ahead, on the other hand, I’d like to identify them ahead of time.
GLTA.