

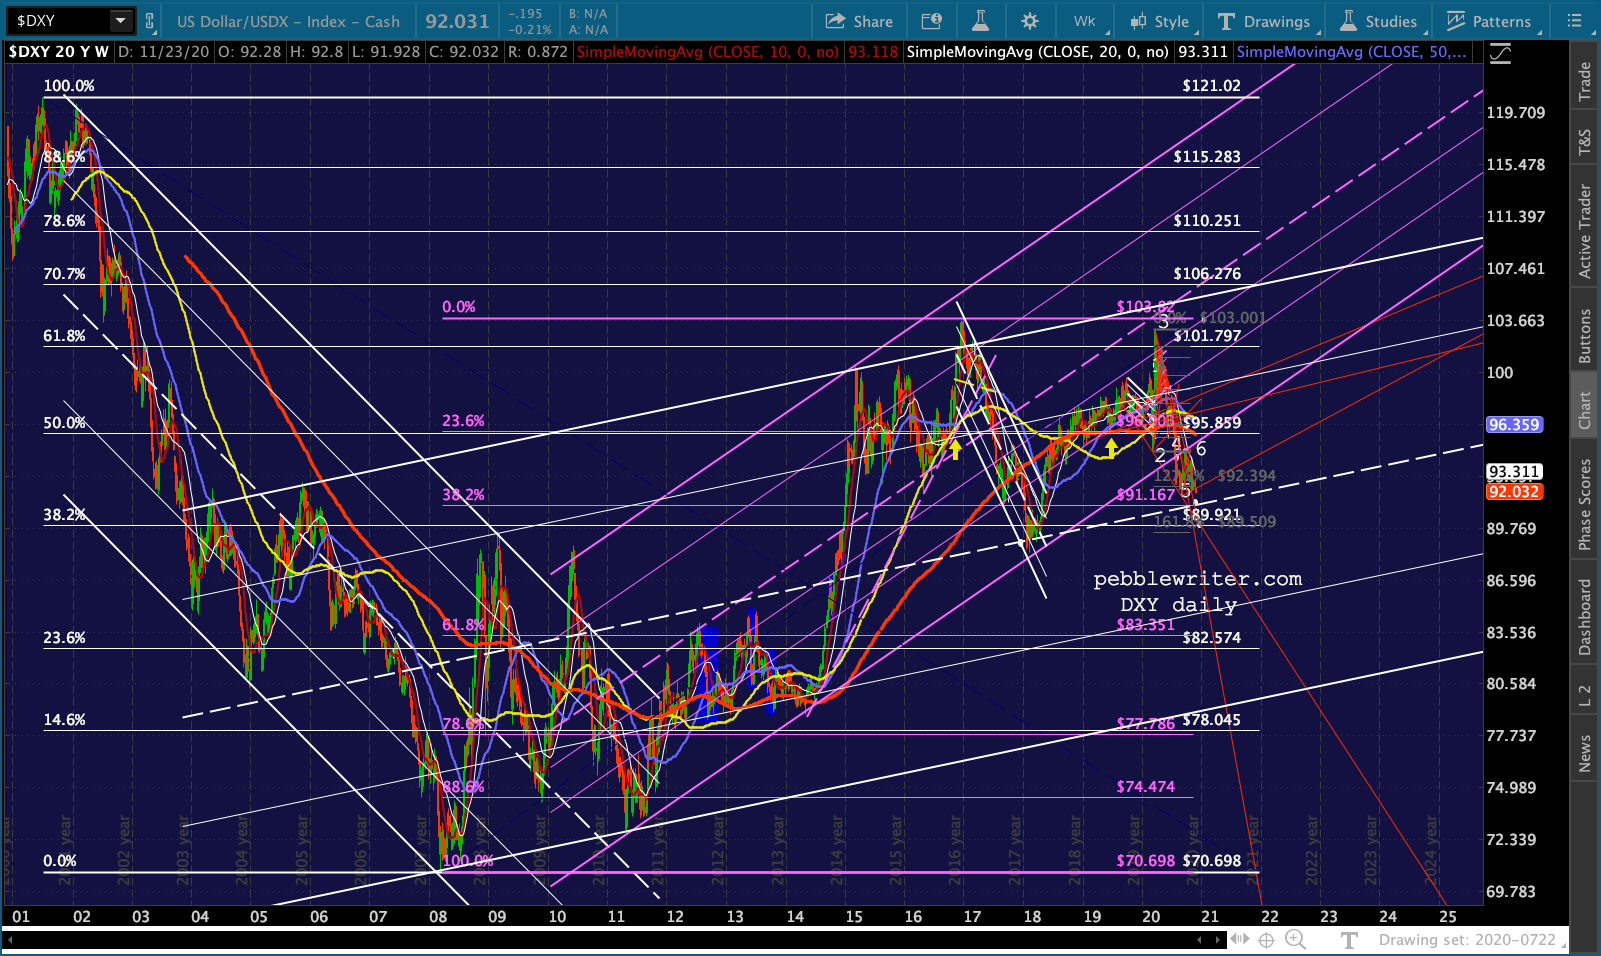
Back in March, when currencies were gyrating wildly, DXY shot nearly 10% higher in a little over a week [see: Currencies to the Rescue] to rescue stocks – which sorely needed a rescue at the time. But, it became very overbought. Our downside target of 94.20 remained in place.
 In July, when DXY reached the target and plunged through the channel bottom there, we started looking at 91.358 as the next most important level of support.
 The 91.358 target was even more important tha 94.20 for a number of reasons. Now that we’ve reached it, what can we expect for the dollar and other major currencies?
 And, what does it mean for bonds, gold and equities?
continued for members…Remember, this is the midline of a very big channel dating back to 2003. The rising purple channel paced DXY’s rise very well ever since the GFC. But, that trend has broken down. If the midline breaks down, what does it portend for other currencies, bonds, gold and equities?
 We’ll examine all of these over the next hour or two. We’ll start with USDJPY.
When DXY shot higher, it was to rescue stocks. But, as we noted at the time, DXY’s moves are a function by definition of moves in USDJPY and EURUSD.
And, it was USDJPY that was on a tear, breaking out of its falling red channel. The first breakout, on Feb 19, was an attempt to keep SPX’s push above its 2.618 Fib at 3047 (ES 3076.) It didn’t hold.
And, USDJPY’s reversal on Feb 21 helped signal our equity short call. When it fell back below the red channel top instead of backtesting it, we knew that stocks were in serious trouble.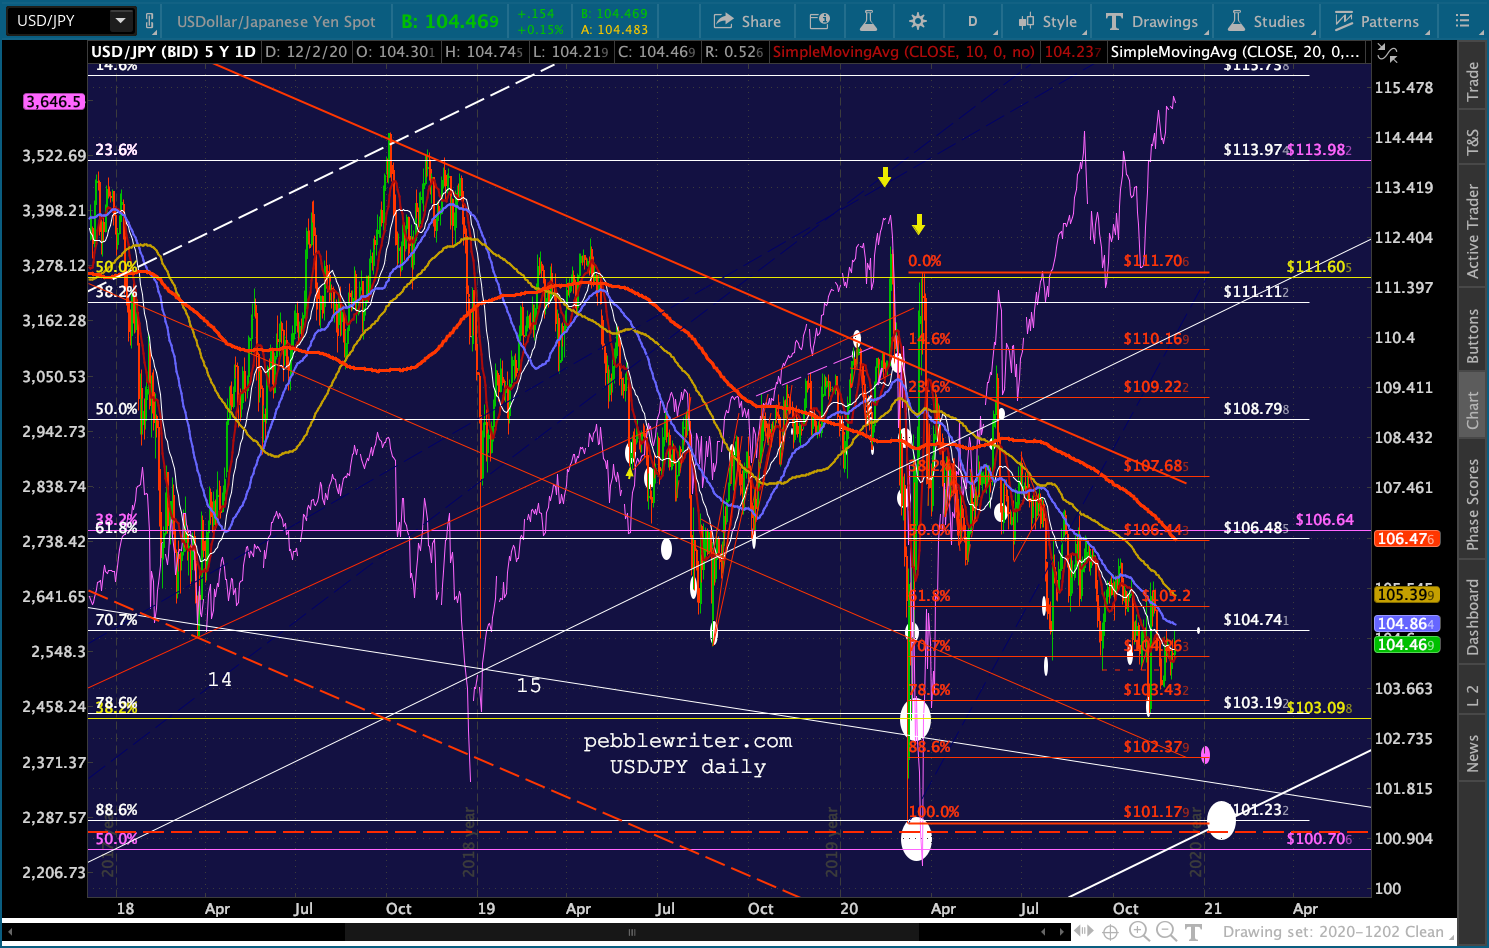 It’s not that the red channel was that legit. It was an awkward looking thing which had done a good job of providing upside turning points.
Its raison d’être was merely to provide a something that USDJPY could break out of when stocks needed support – much like VIX’s straw man rising trend lines that break down when stocks need support. [New subscriber? Check out how the Yen Carry Trade works.] As we saw in the chart above, it did break out – but the break back “in” and subsequent breakdown killed stocks’ rally.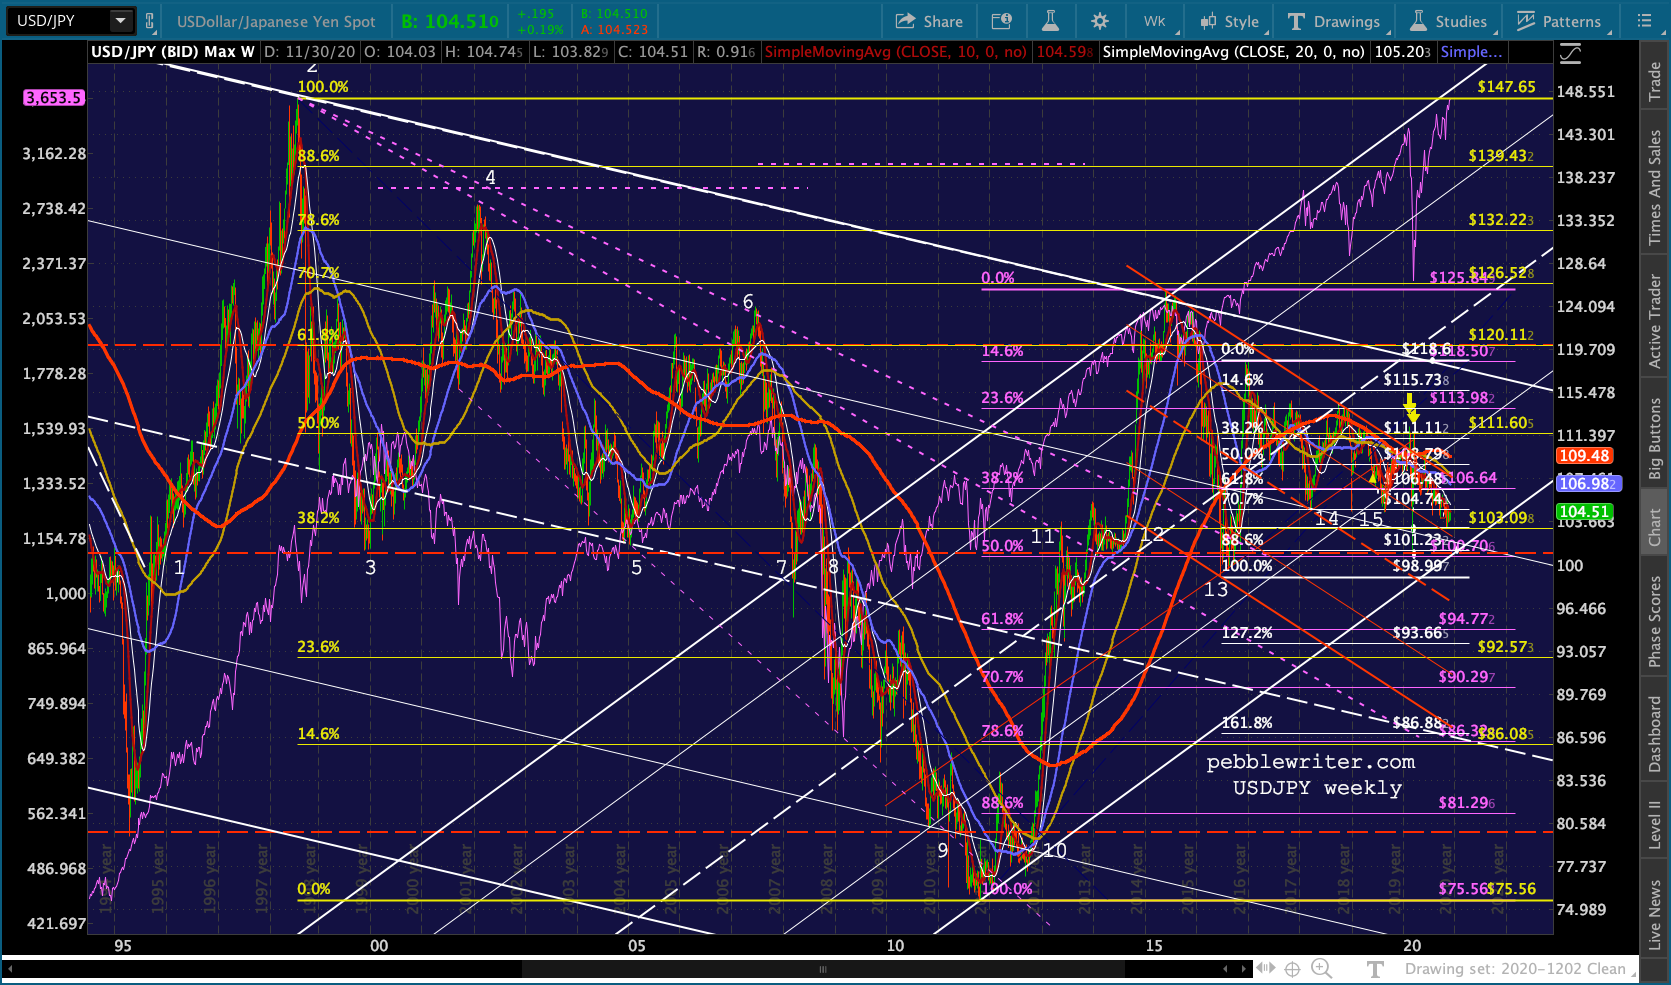 My apologies for the delay folks. Steady stream of conference calls today…
Anyway, back to USDJPY. The red channel could still come into play over the remainder of the year. The upside case is a rally (to keep stocks on the rise through 2020) up to or through the red channel top. Note that a (dashed yellow) TL from the Feb and Mar highs intersects with the red channel top in early Jan. We’ll call it 107.46.
 If it can remain above its SMA10 – which it just rose above and backtested yesterday – this is a reasonable scenario. To get there, USDJPY would need to push past its SMA50, SMA100 (also the purple channel top), and the SMA200. It would mean a strong bounce for DXY.
The alternative is the triangle pattern we discussed yesterday – the little white dot at 104.74 around Dec 28. This would allow it to make lower highs and higher lows, consolidating until year end when it could either break out or down.
The huge rising white channel is obviously more important. This begs the question: why didn’t USDJPY tag the channel bottom when it had the chance in March? The two reasons are: (1) at the time, the channel bottom was at 98.60 – which would have been a lower low than in 2016; and, (2) NKD, having fallen 35%, had broken down from a rising channel dating back to 2008.
This was a serious breach of bullishness and urgently needed to be corrected. As it was, NKD’s decline was arrested at the .886 retrace of its rise from its 2016 lows. 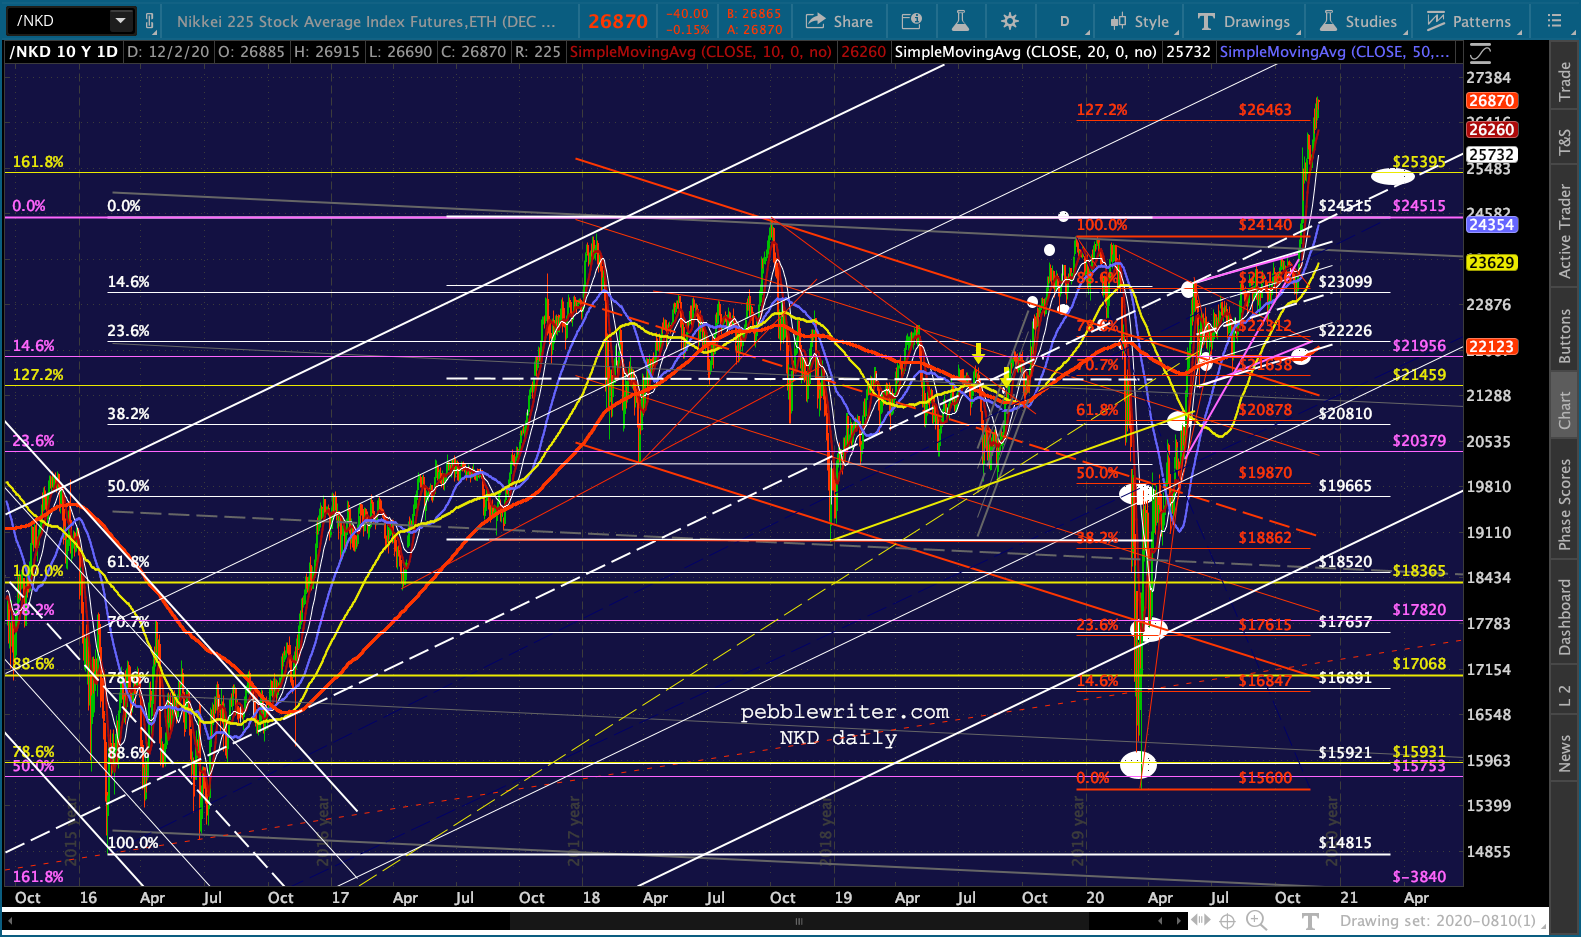 USDJPY’s move back above the red channel top was enough to get NKD back to the white channel bottom and the periodic rallies – along with massive stimulus, equity purchases, etc. have kept the uptrend going. Since it’s finally rallied above its yellow 1.618 and red 1.272, it now has its sights set on the red 1.618 and yellow 2.24.
Since the BoJ and GPIF own/control the bond market and nearly own/control the stock market, their motives are very clear. Currency policy in Japan is all about (1) keeping stocks on the rise, and (2) keeping stocks from falling.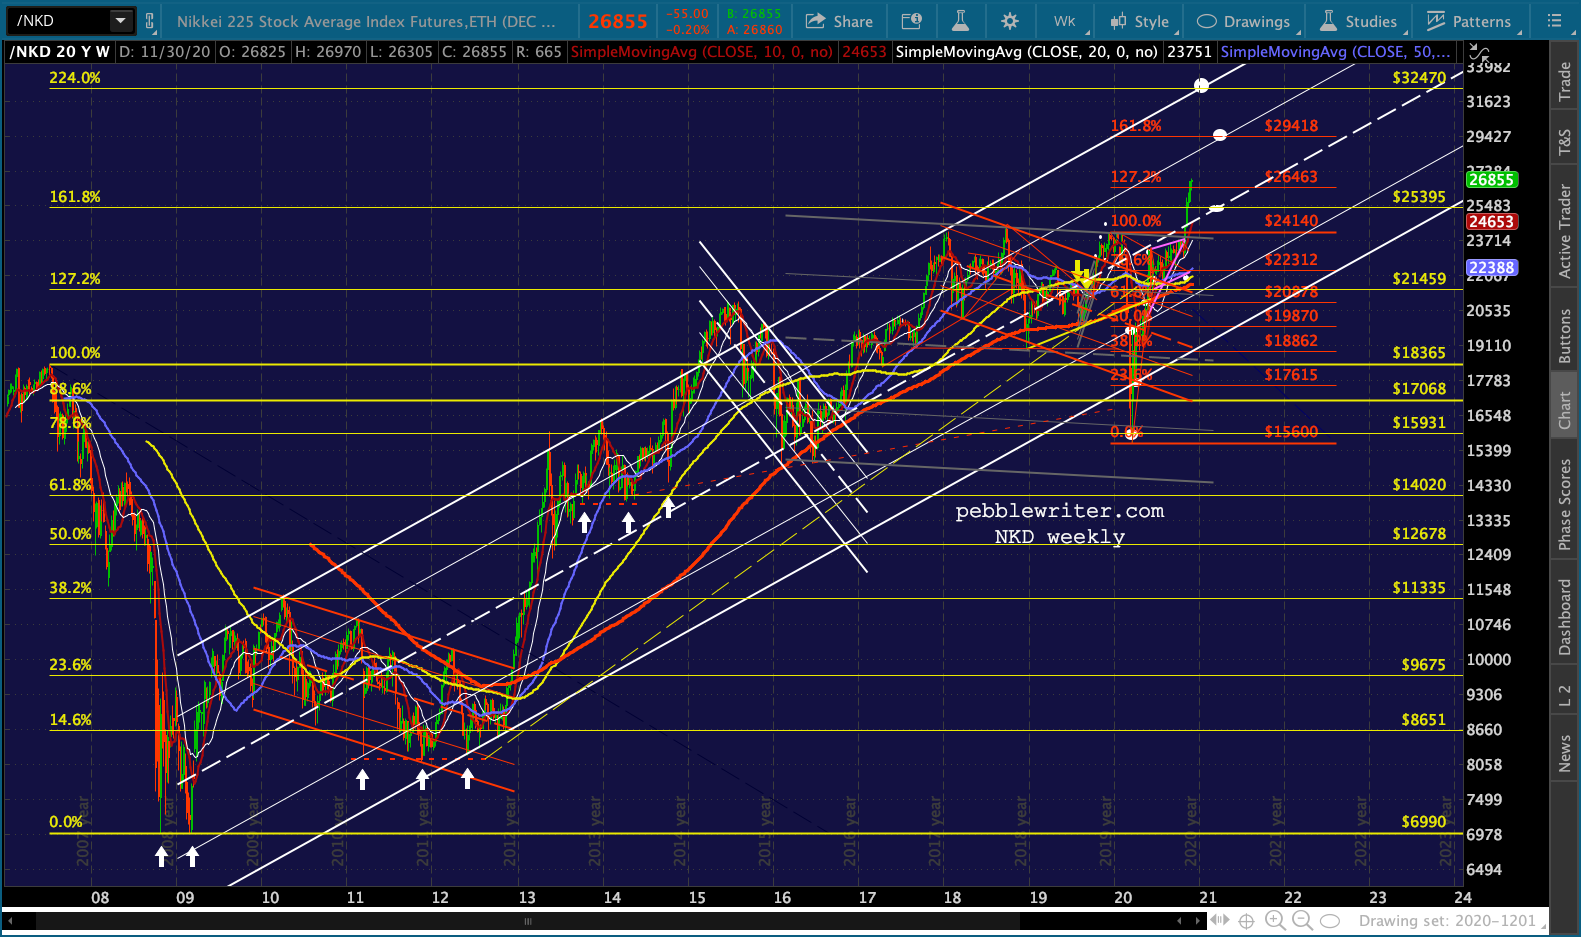 If this seems ludicrous and completely out of touch with price discovery, you’re right. Japan is broke, and has little chance of ever recovering. Their COVID trend ain’t so pretty…
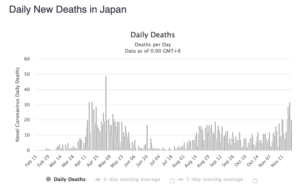
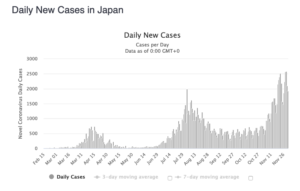
…but they have much better COVID numbers than the US (17 deaths per 1MM verus 841 for the US.)
[BTW, we shouldn’t cast stones from a monetary/debt/market control/price discovery standpoint. The US is clearly following in their footsteps – just not so obvious about it.]
The bearish case for NKD and USDJPY is also interesting. If NKD gets tired of looking obviously rigged on its way to 32,470 at year end, it could backtest its 1.618 Fib at 25,395 around March 15.
If this were in the cards, it would mean a test of the rising white channel bottom by USDJPY. The channel bottom is currently around 100.85, which would mean a lower low than we saw in March. That would need to happen by mid-December.
A less aggressive downturn could test the red .886 at 102.38 around year end, followed by a bounce and another leg down to a nice intersection of channel and trend lines at about 101.70 around March 15.
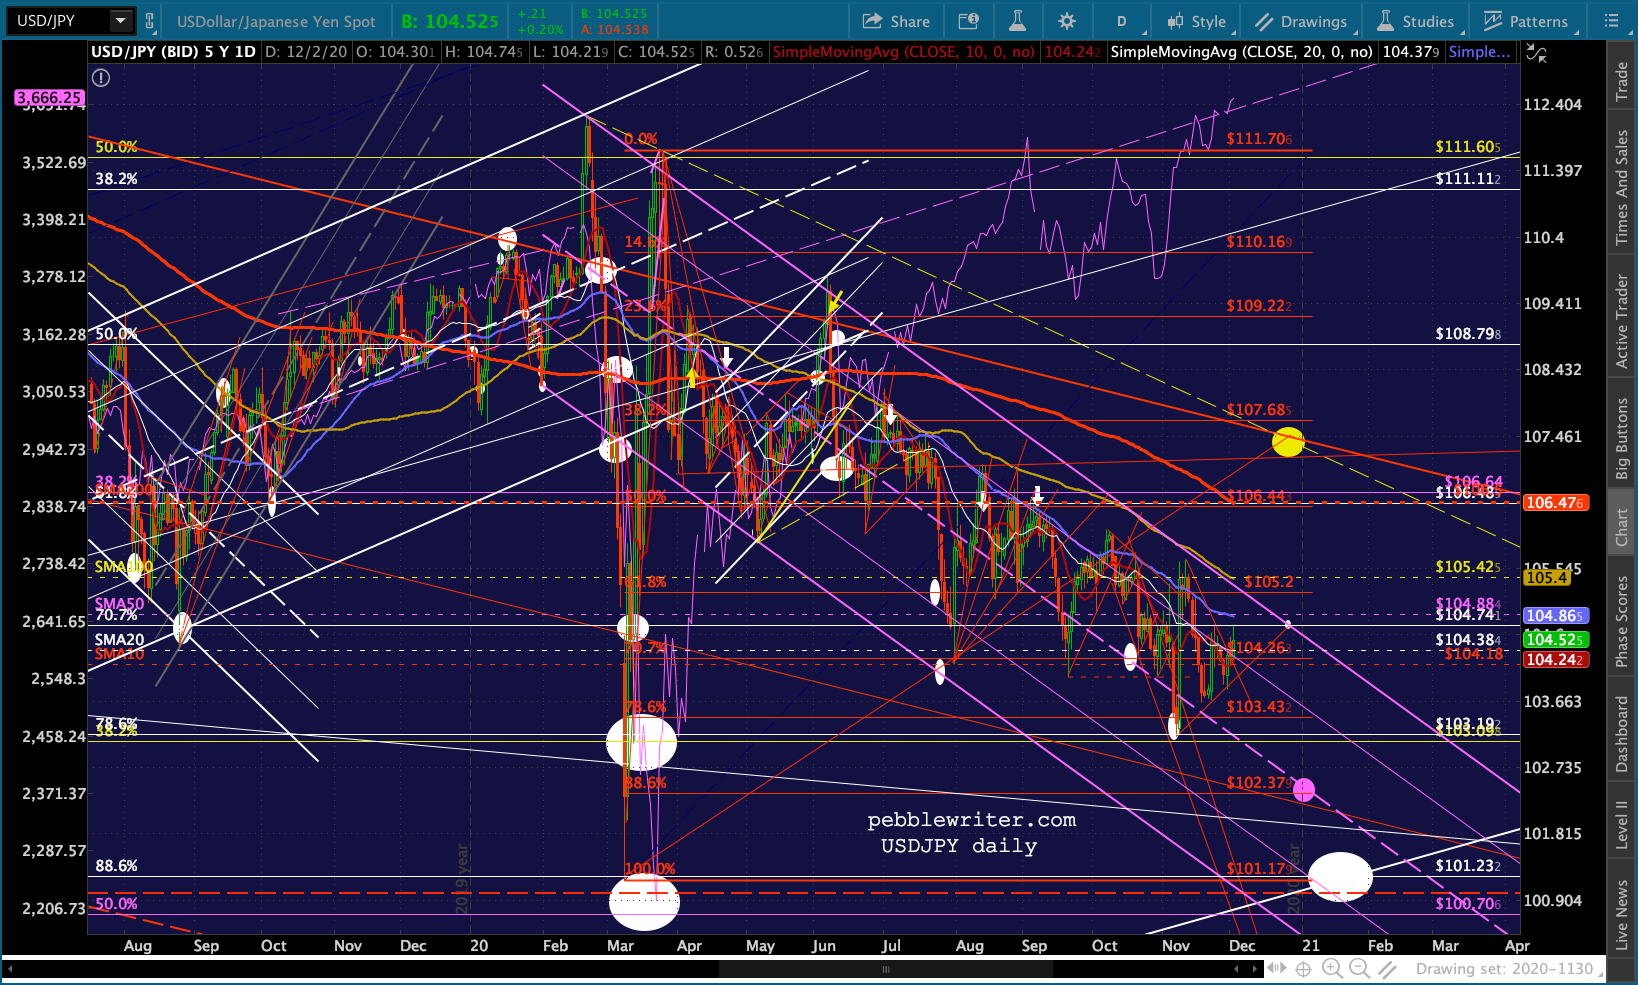
 If things got really messy, note that there’s a falling channel (shown below in purple) that reaches the June 2016 98.99 lows around Mar 4. I don’t believe the BoJ would allow the rising white channel to break down. But, then again, they didn’t intend for the March 2020 crash to go so low either.
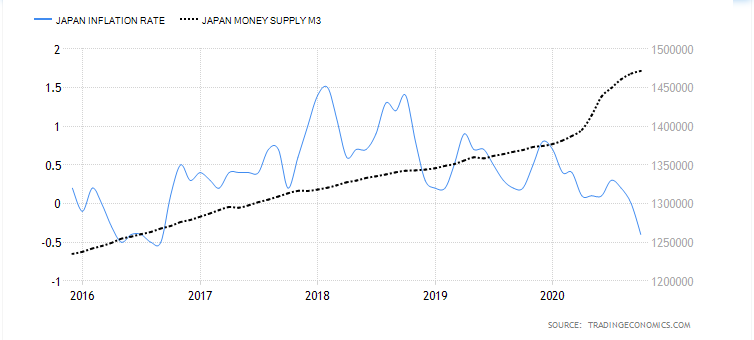
How will we know what to expect? Watch USDJPY’s squiggles. It has held rising TLs and broken out of falling TLs lately. If this continues and we get a bullish 10/20 cross, it bodes well for the bullish case. If the rising TL breaks down and USDJPY drops through its SMA10 and SMA20, the bearish case looks better.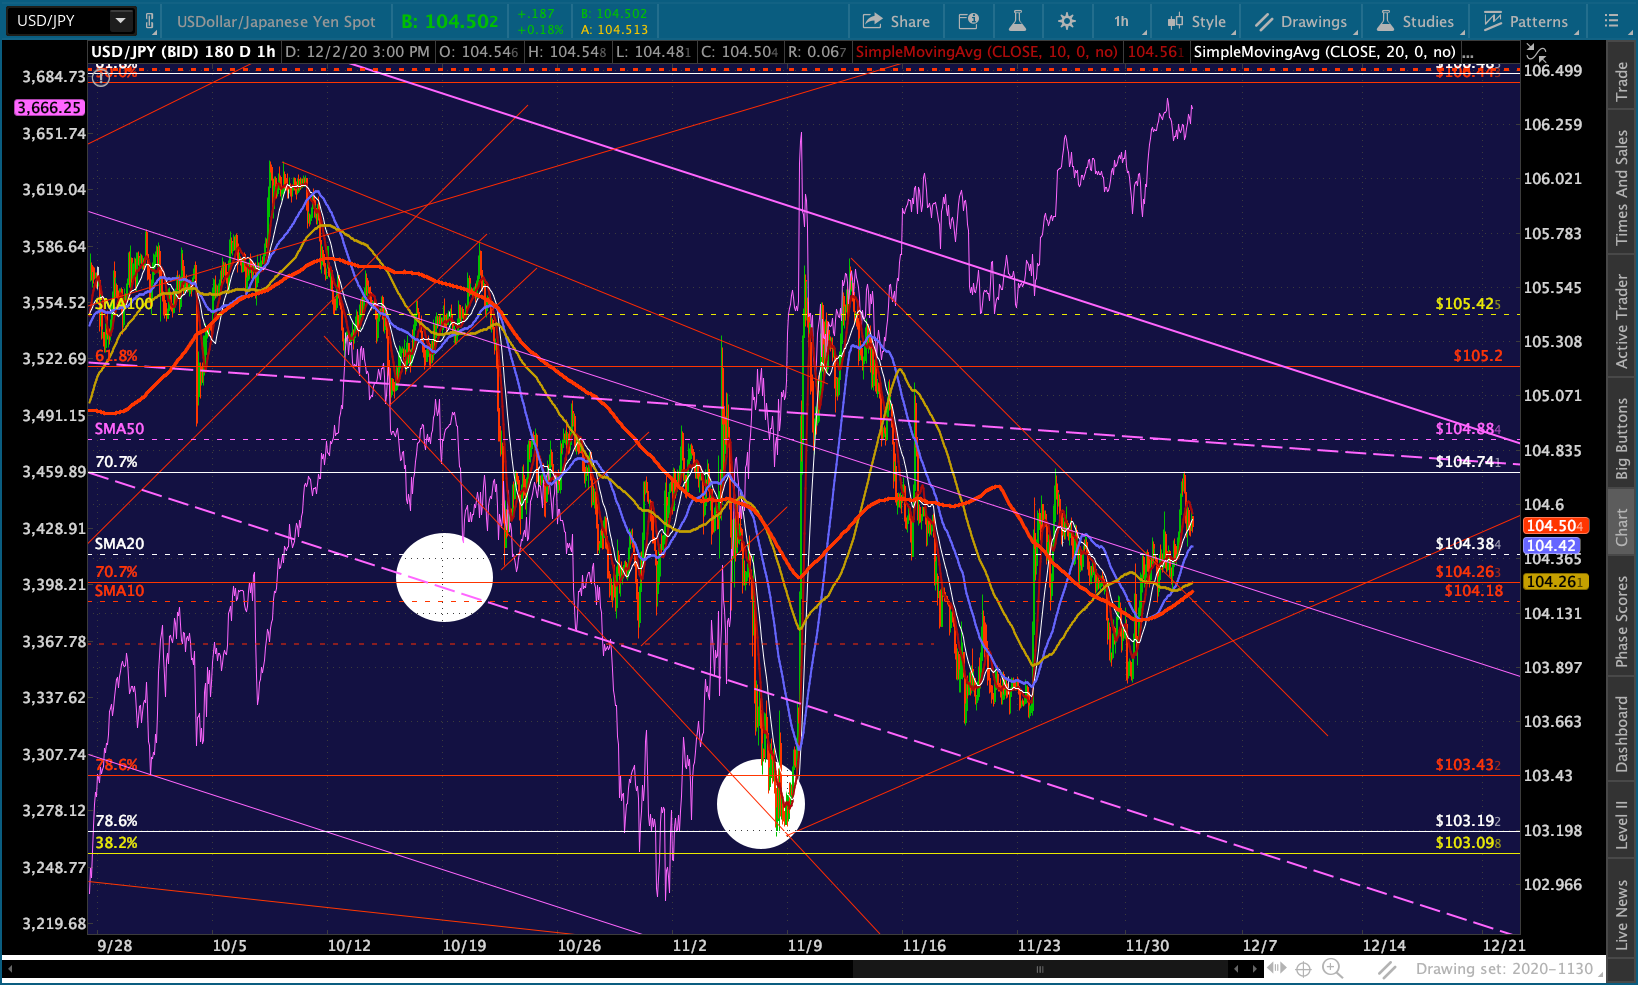 One last note. Japan’s CPI continues to trend lower even as money supply continues to expand.
 10-yr JGB’s were trending slightly positive again.
 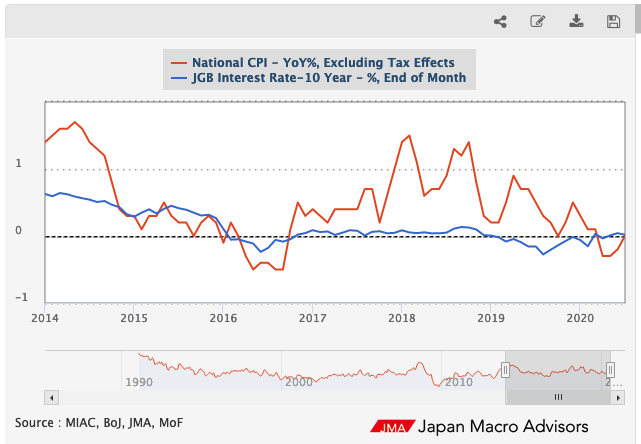 The BoJ needs rates to stay negative, meaning inflation has to continue trending lower. The best way to ensure this is for the yen to gain value – meaning the USDJPY falling. This could set up a conflict between acceptably low interest rates and acceptably high stock prices.
I’m going to break for the night and continue this post tomorrow.