

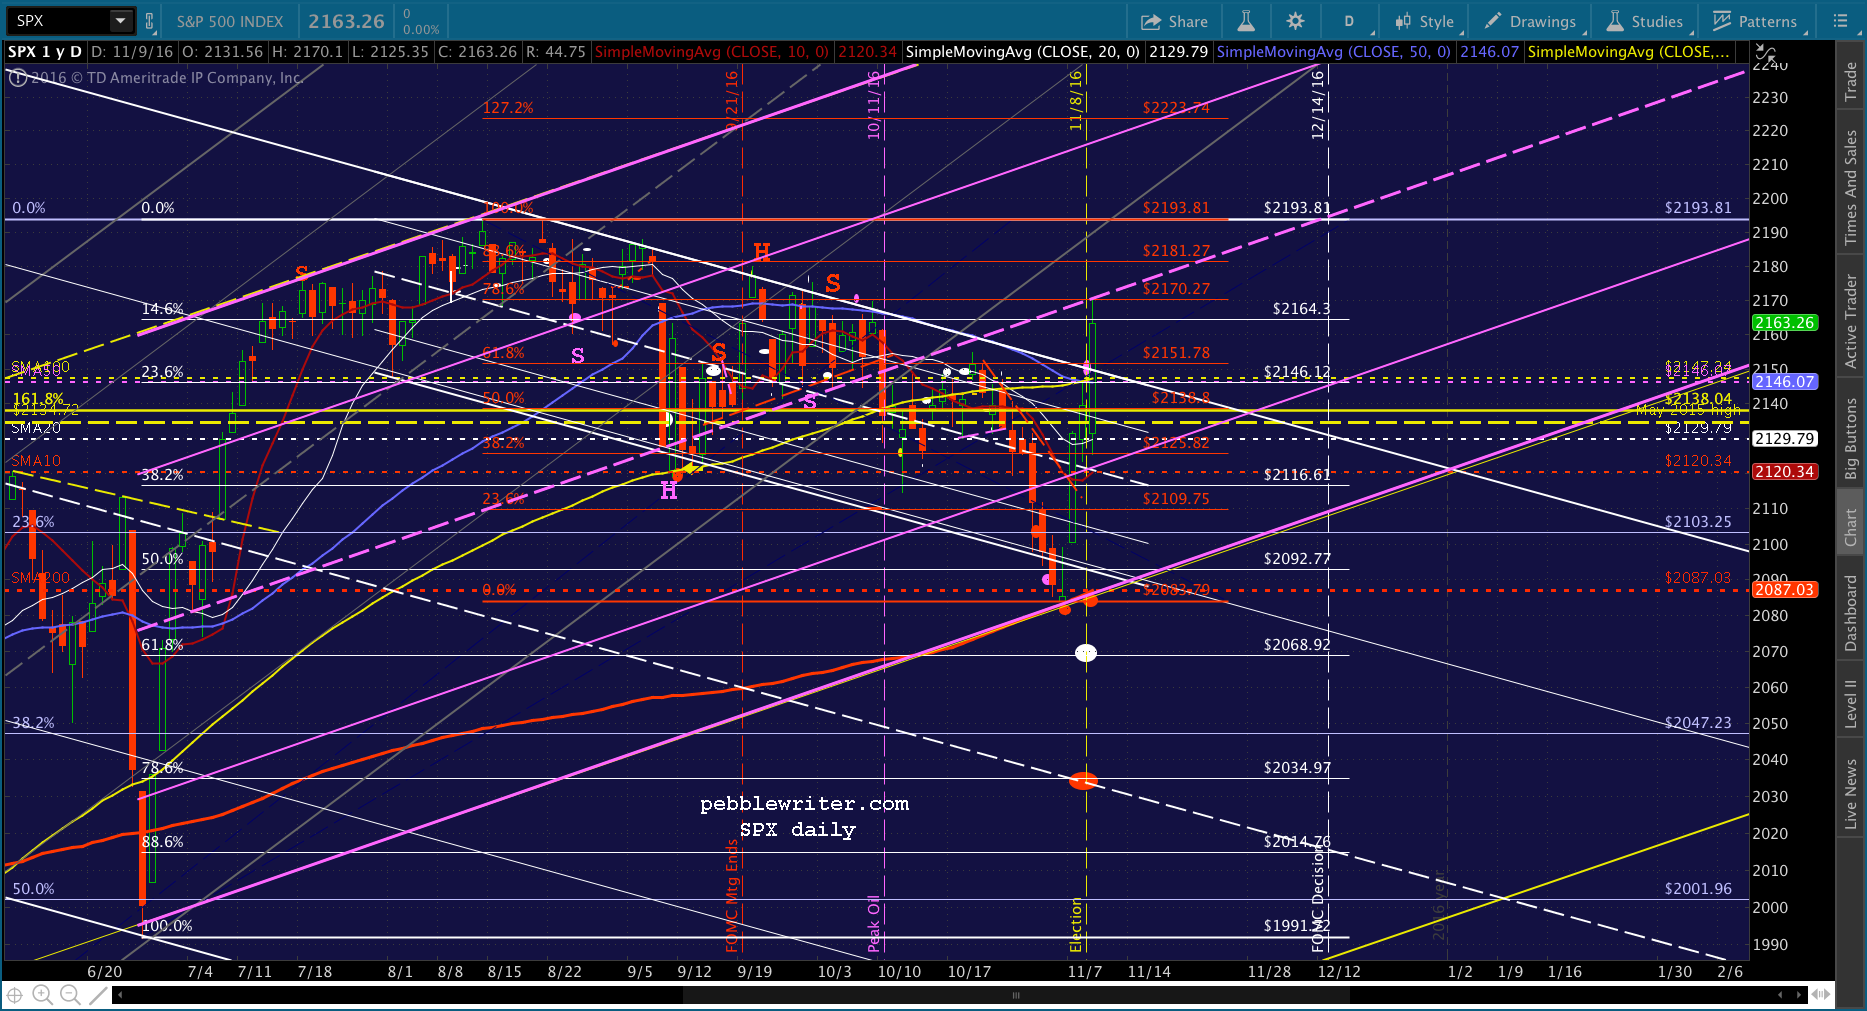
With the S&P futures off around 100 points Tuesday night, I noted that if the selloff lasted, SPX had a very good chance of tagging the .786 retracement at 2034.97 the next day. Instead, we got the biggest overnight turnaround since Mar 2009 and a breakout of the channel SPX has been in for the past three months. What happened, and why?
While most analysts were scratching their heads over the repercussions of a Trump presidency, central planners were busy ramping USDJPY for all it was worth. Just this morning, it reached our next upside target — a rally of over 5% in about 24 hours.
Was this merely a case of not letting a good crisis go to waste, or is there something more fundamentally bullish at work here?
continued for members…
SPX isn’t completely out of the woods, as it tagged the red .786 and faces resistance at the purple midline (2073ish) this morning. Note that this represents the equivalent of a .886 retracement for ES. For those stopped out yesterday, this would be a good spot to try a short — if VIX and USDJPY allow a pullback.
To be sure, heavy VIX shorting by CBs played a very important role. Much of this occurred as futures were plunging, so it was a case of the tail wagging the dog as is often the case.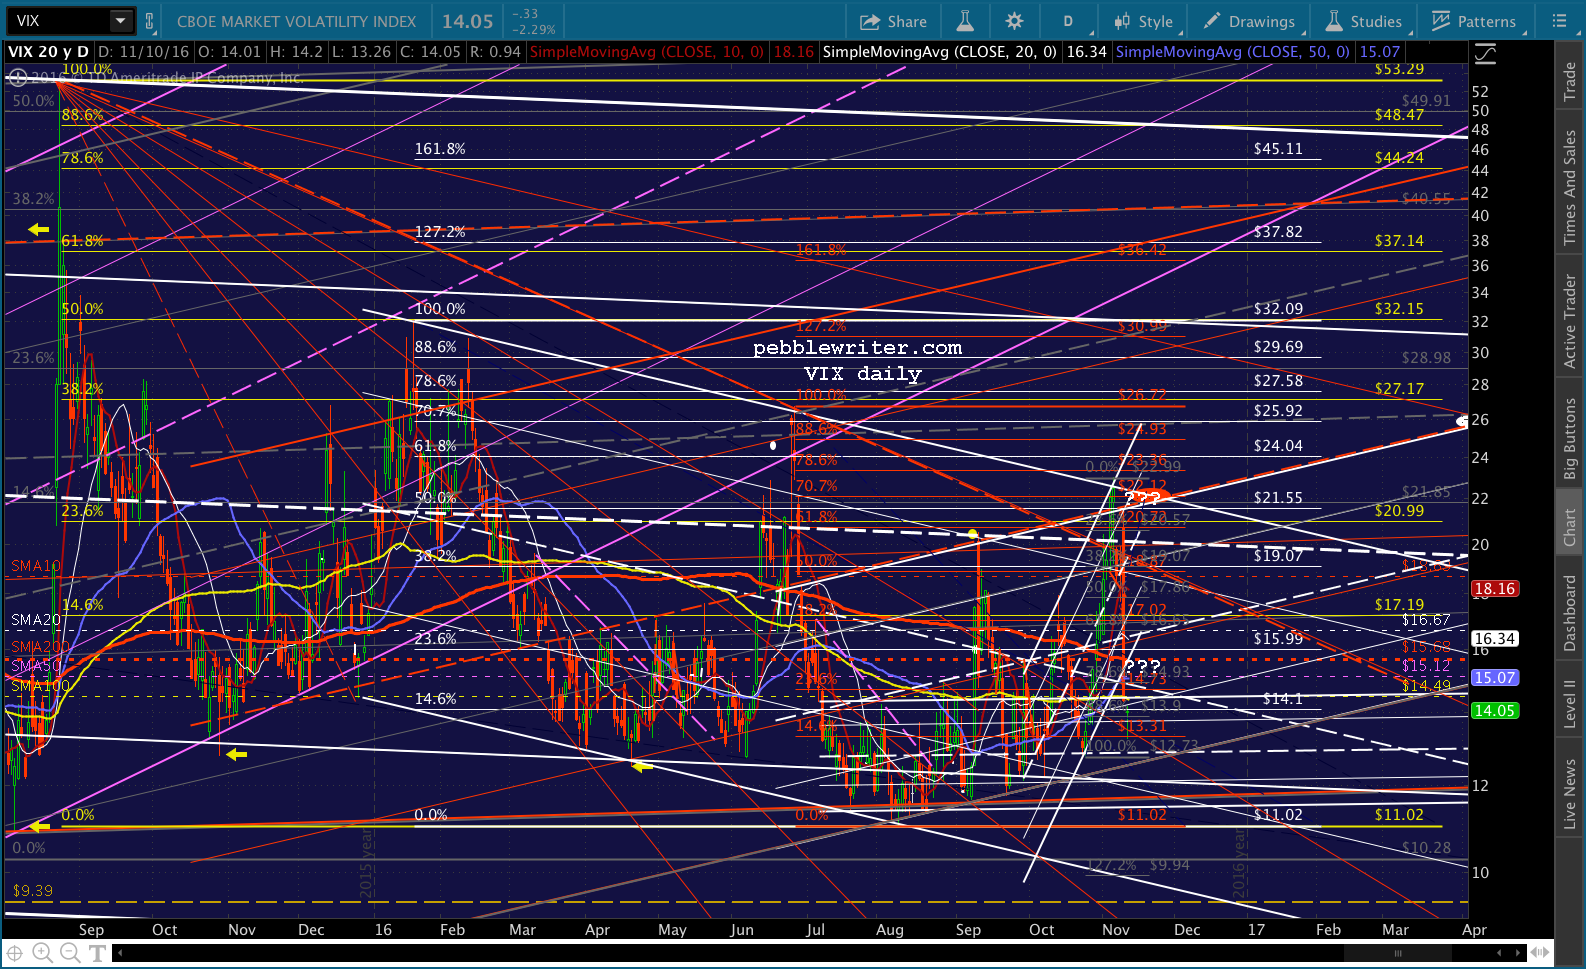 With the latest rising white channel having broken down, there’s little support until VIX reaches 12.55 or so — the bottom of the larger rising channel at or below the Oct 25 lows. Though, there’s potential fan line support around the red .146 at 13.31.
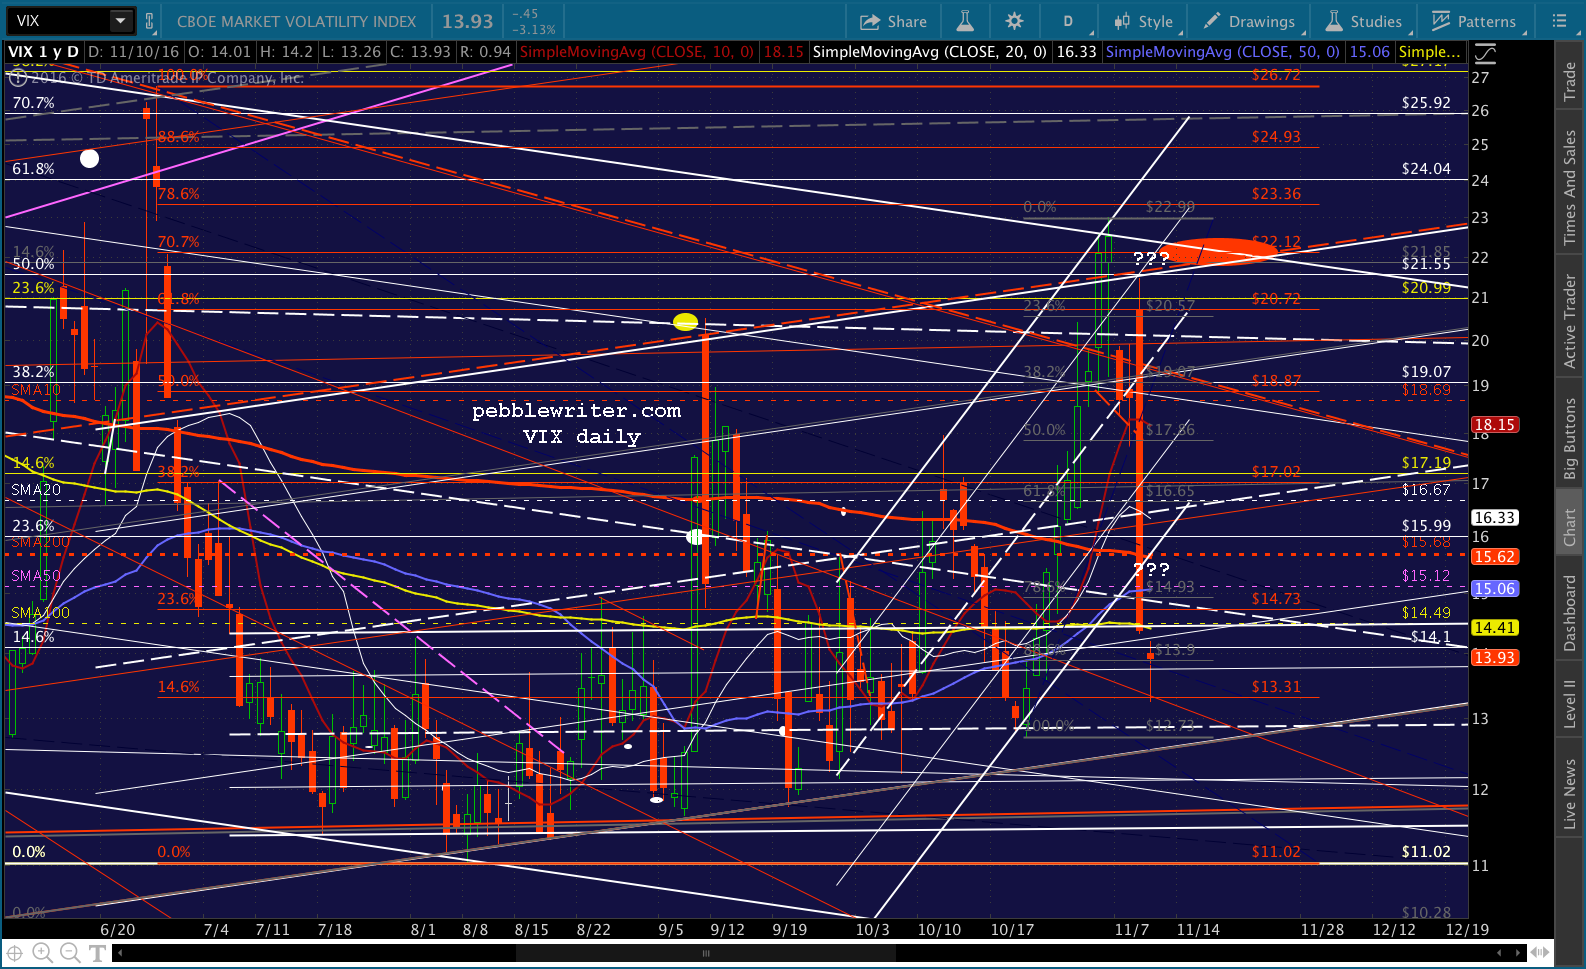 So far, VIX and USDJPY have been able to completely offset CL’s continuing weakness. It bounced off the SMA200 yesterday and maintained the bounce until stocks closed. It has further to go, but could continue putting in declines after hours — a favorite trick of its.
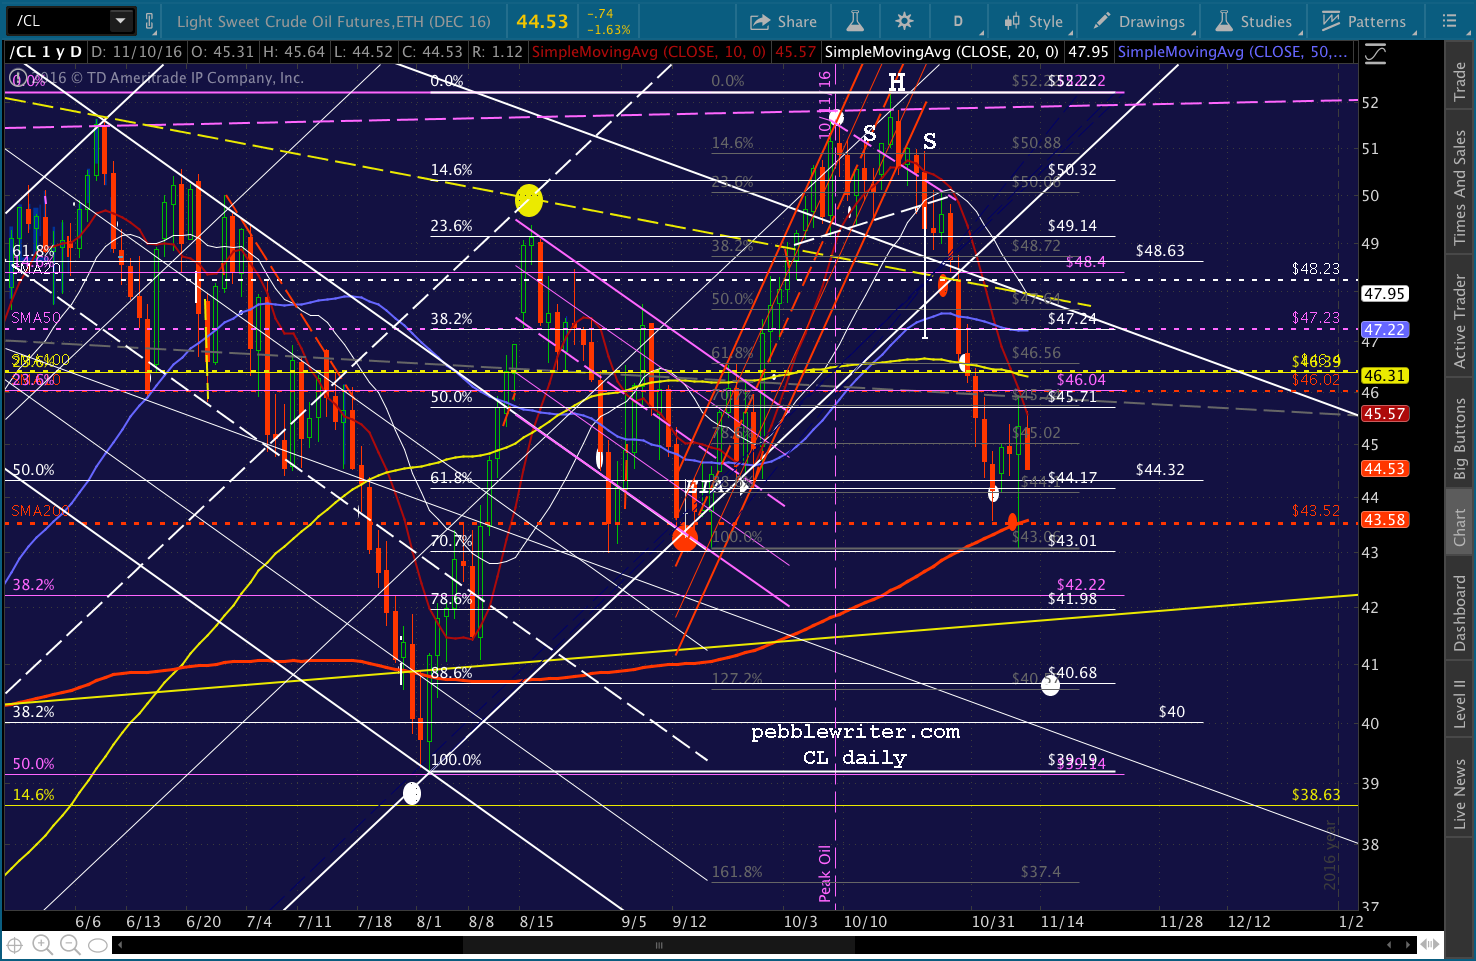
The charts say DX could have further to go. But, the white channel top represents a potential spoiler.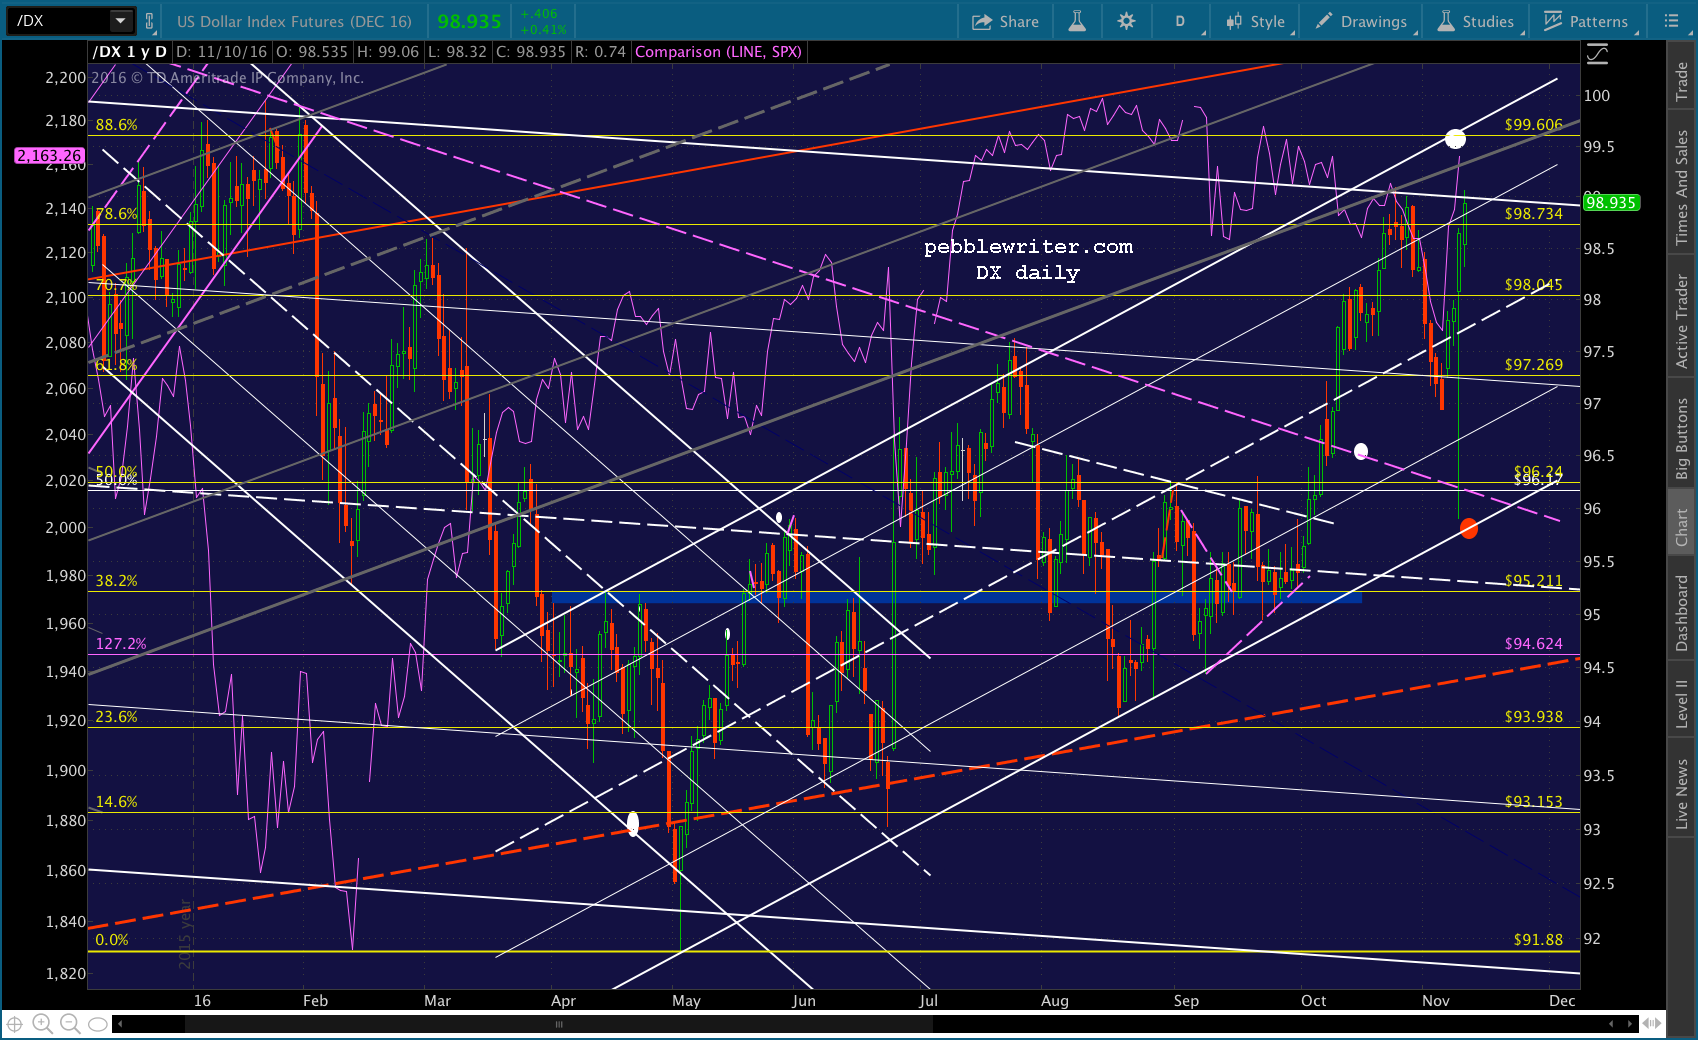
Here’s a view from further out. This channel was breached quite a bit back in late 2015, but is otherwise fairly well formed.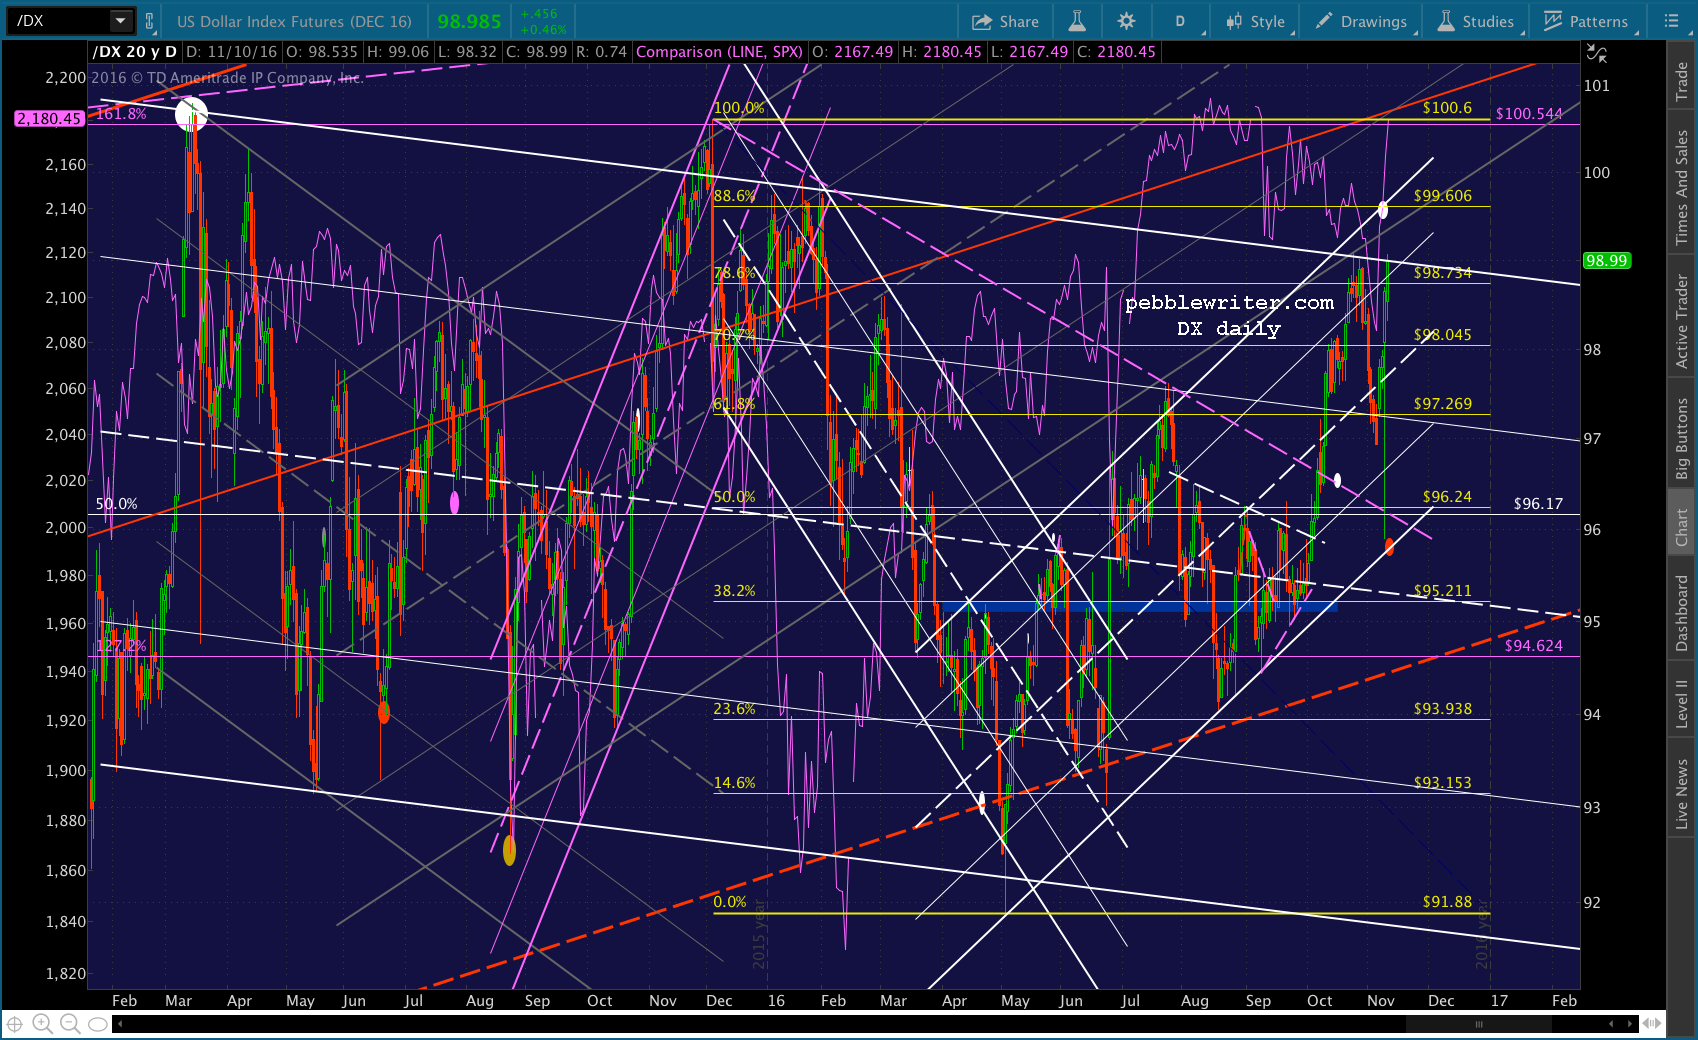
UPDATE: 9:48 AM
SPX slipped past its .786 and just reached its .886. I’d try to a short position here at 2181.95, but keep a close eye on VIX. Initial target would be the SMA100 and white channel top around 2147.24. 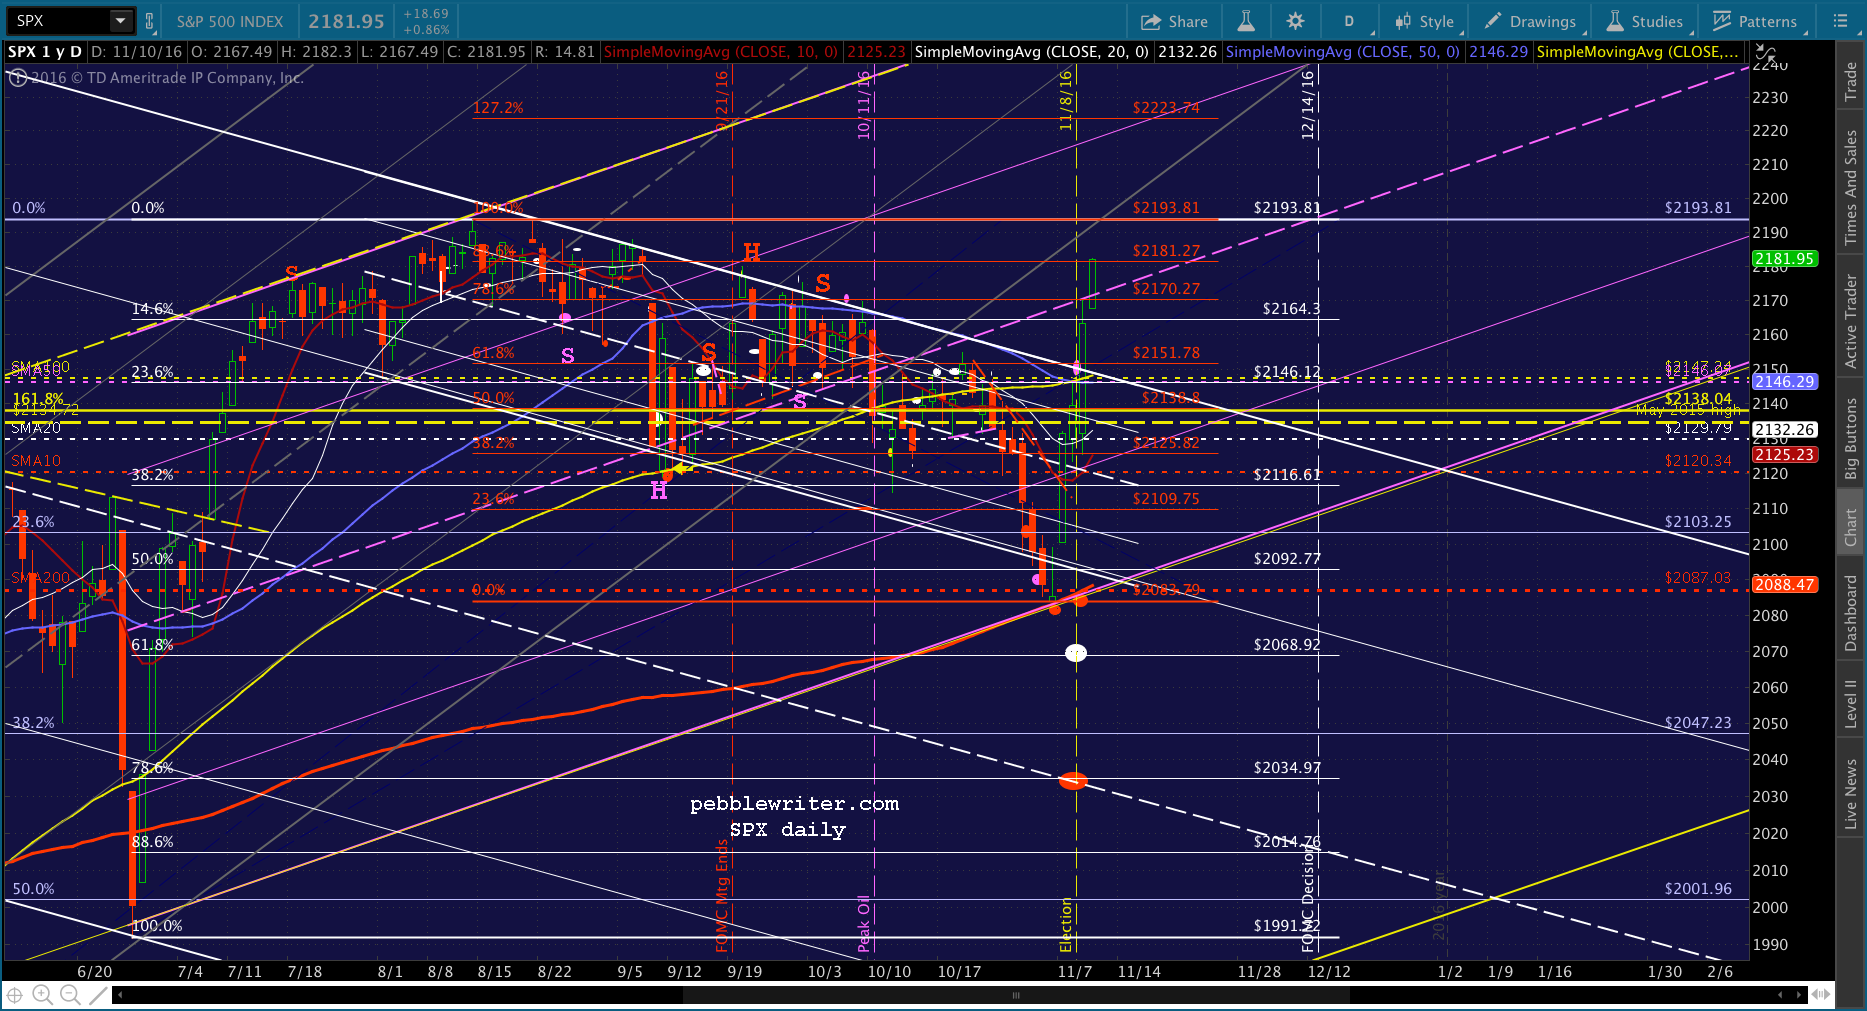 I must admit, I secretly harbor the hope that yesterday was a breakout along the lines of 5/31/11. But, the parallels don’t seem strong enough to suggest an analog.
 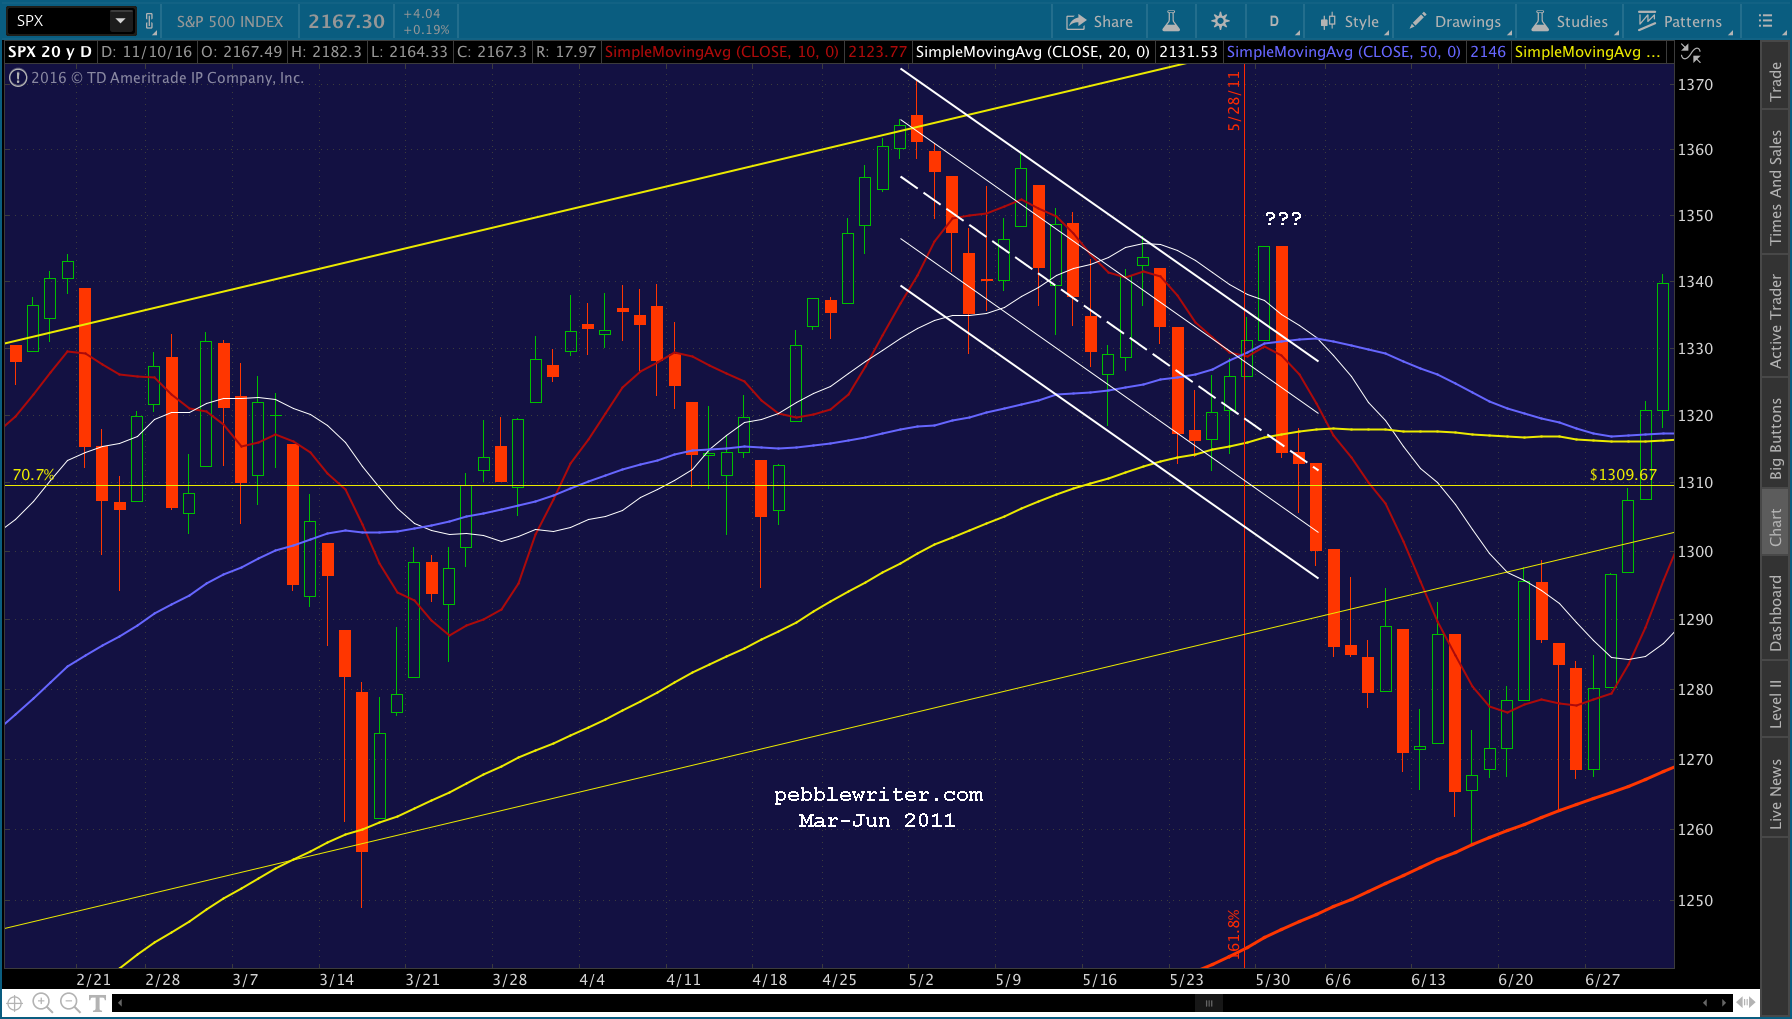 And, I imagine TPTB will defend this white channel breakout — letting this decline to nothing more than a backtest. If it drops through 2147, then the conversation changes. This takes us back to the earlier topic…
I know that roughly half the population thinks that Trump will deliver on his economic promises. But, there never has been a free lunch, and I don’t think this time will be any different. The argument, as I understand it, is we’ll see greater fiscal stimulus. Of course, with lower taxes, this translates into more deficit spending and a greater debt burden — which will amp up inflation and produce/necessitate higher interest rates.
Apparently, I’m not the only one who sees things this way. Just came across comments Jeffrey Lacker made earlier today:
“If a fiscal stimulus initiative were enacted I think we would see a steeper path” of rate increases. “In December we will be debating another increase no doubt,” he said. “The case for raising rates is relatively strong. I continue to believe that’s the case even with the events of this week.”
As I recall, markets freaked out the last time rates were increased…
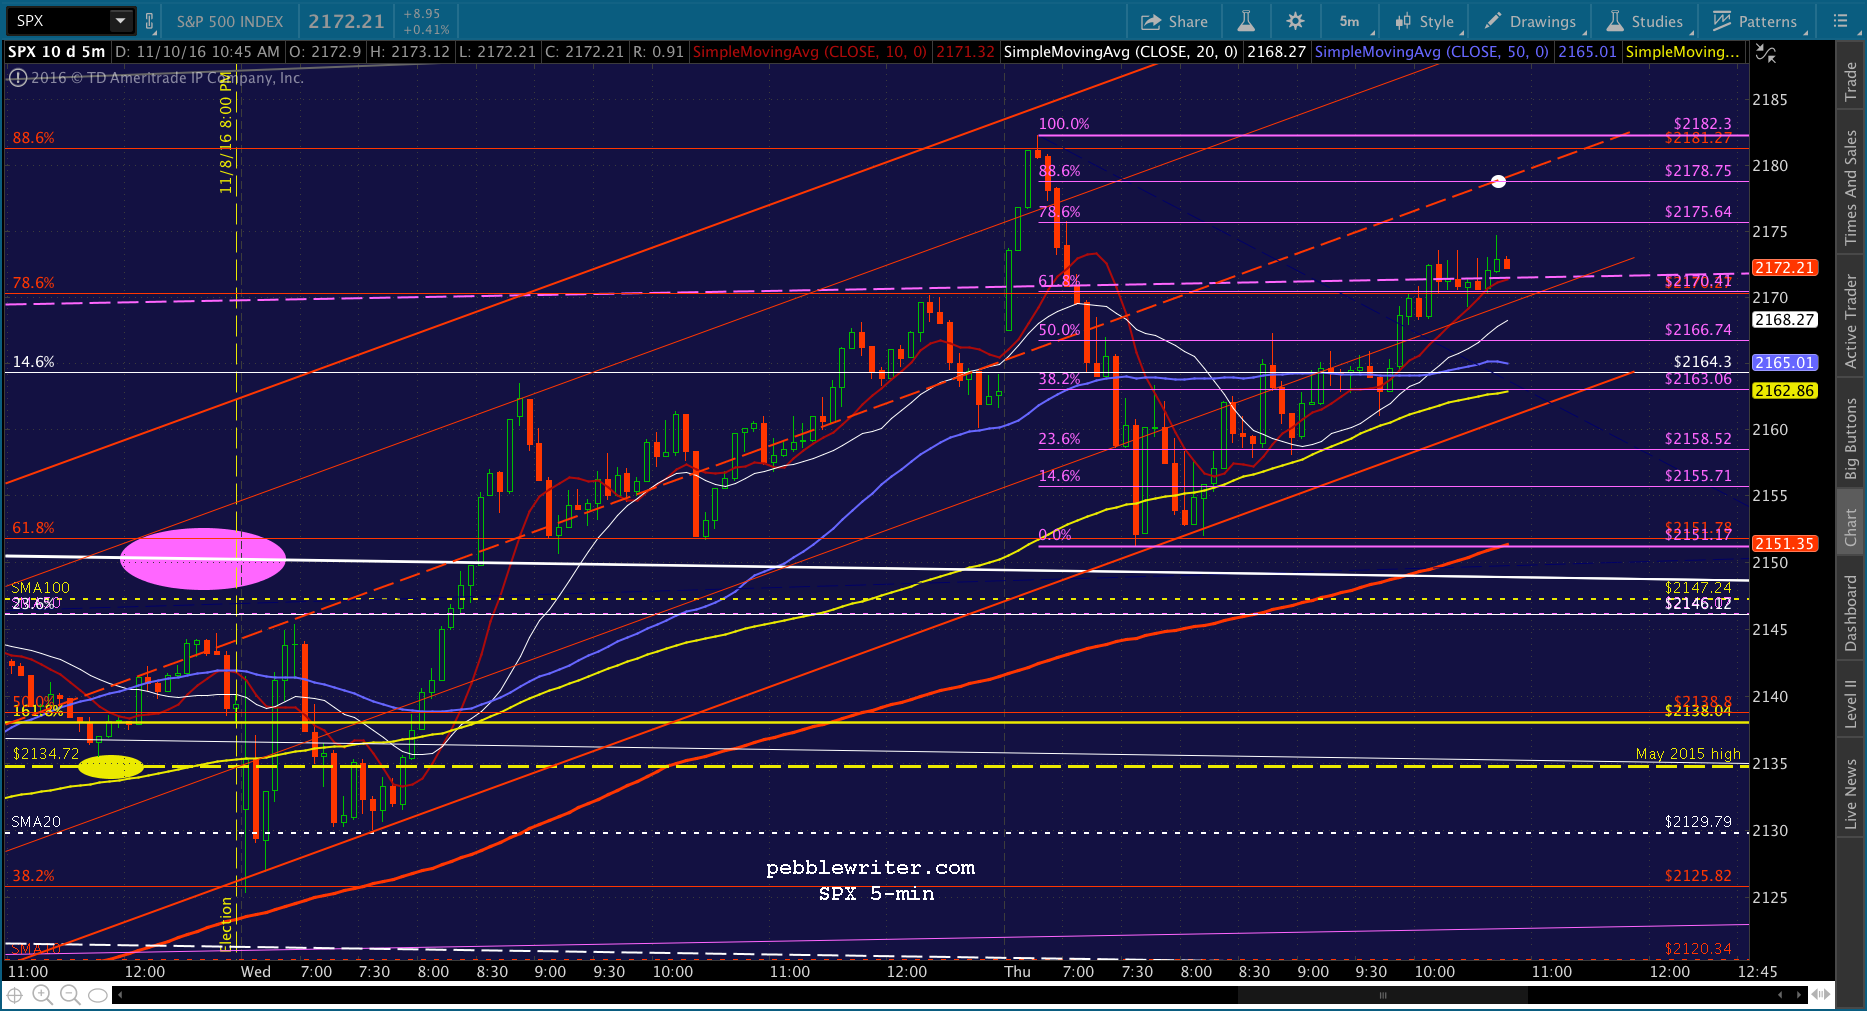
UPDATE: 10:41 AM
We’re likely to get a bounce here at the red .618. Not a bad idea to cover and wait for the SMA5 10 to catch down.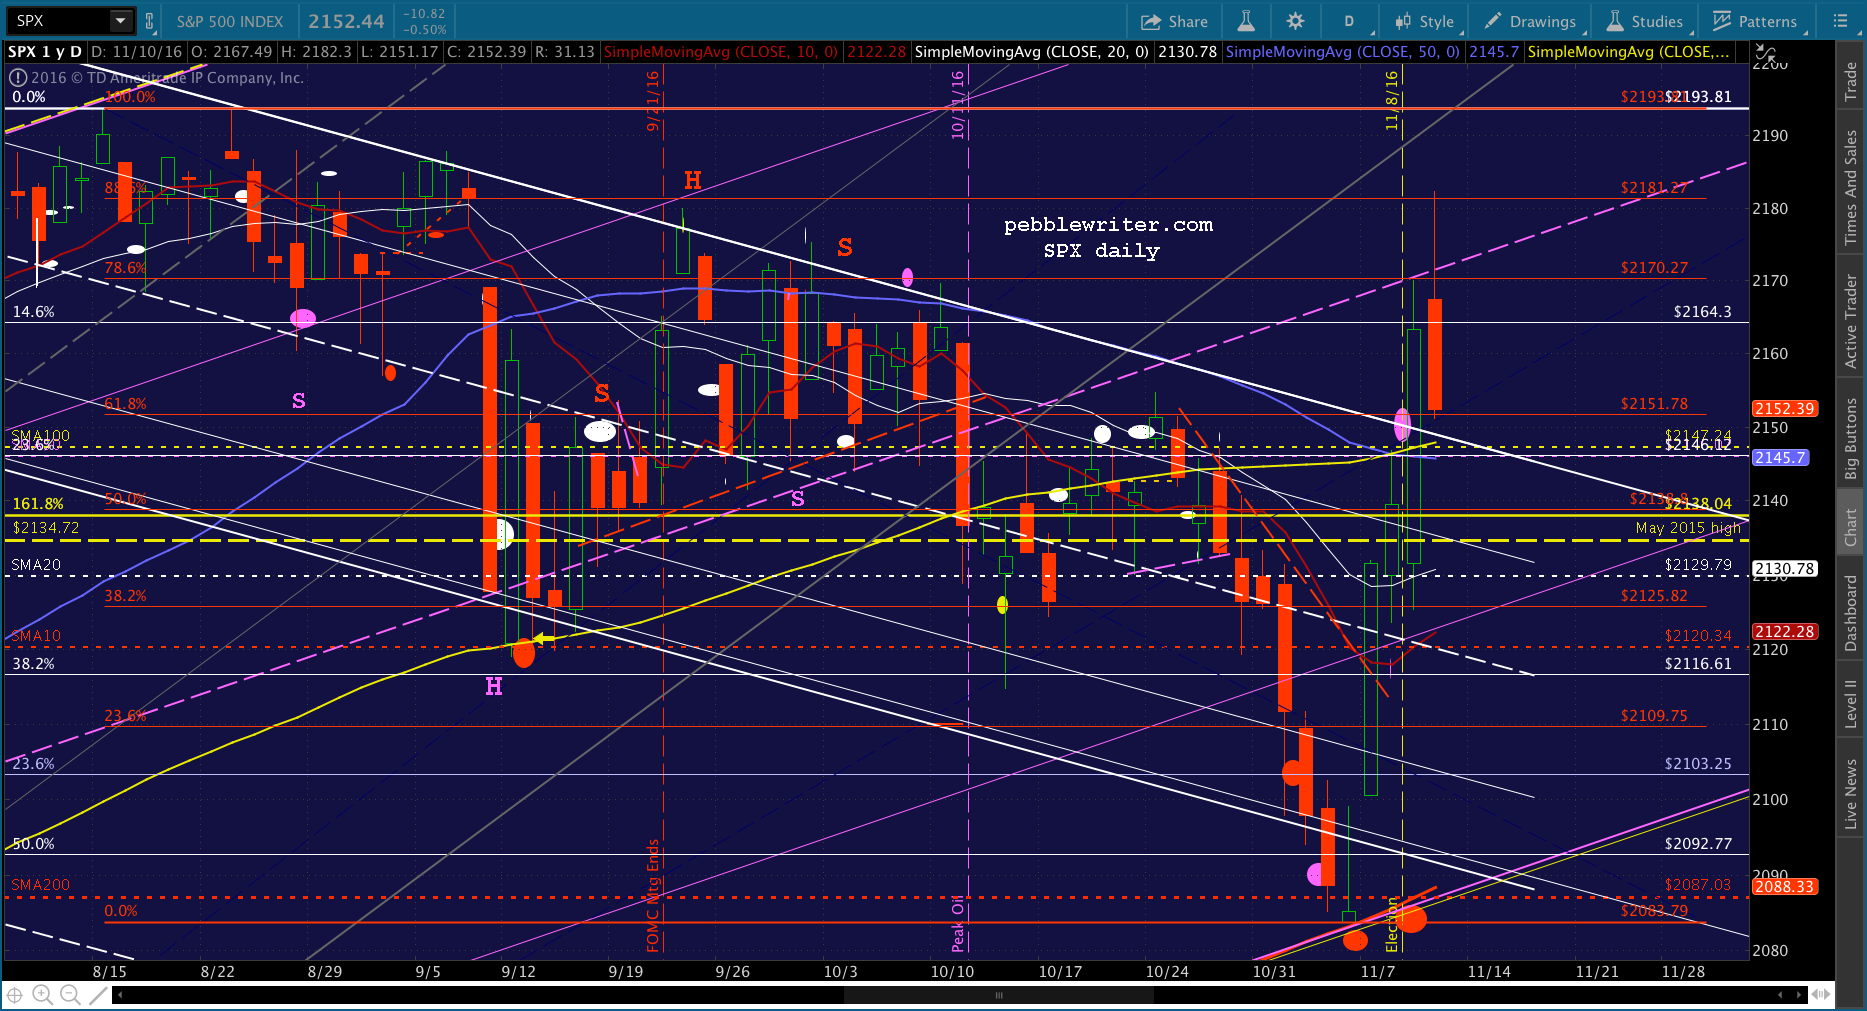
UPDATE: 10:46 AM
There’s the SMA5 10. I’d reshort here at 2163.30 for 2147.24. Tight stops are advised. Note that the SMA5 200 is on the rise, and should reach the SMA100 in an hour or so. In other words, this might take a while to finish out if it’s going to happen.
It could also drop lower than 2147.24. Note that ES, which dropped through its SMA5 200 at 2166, has its .618 down at 2129.23 which would be the equivalent of 2134 on SPX. I’ll be watching to see what happens when SPX tests the TL from Monday’s lows again.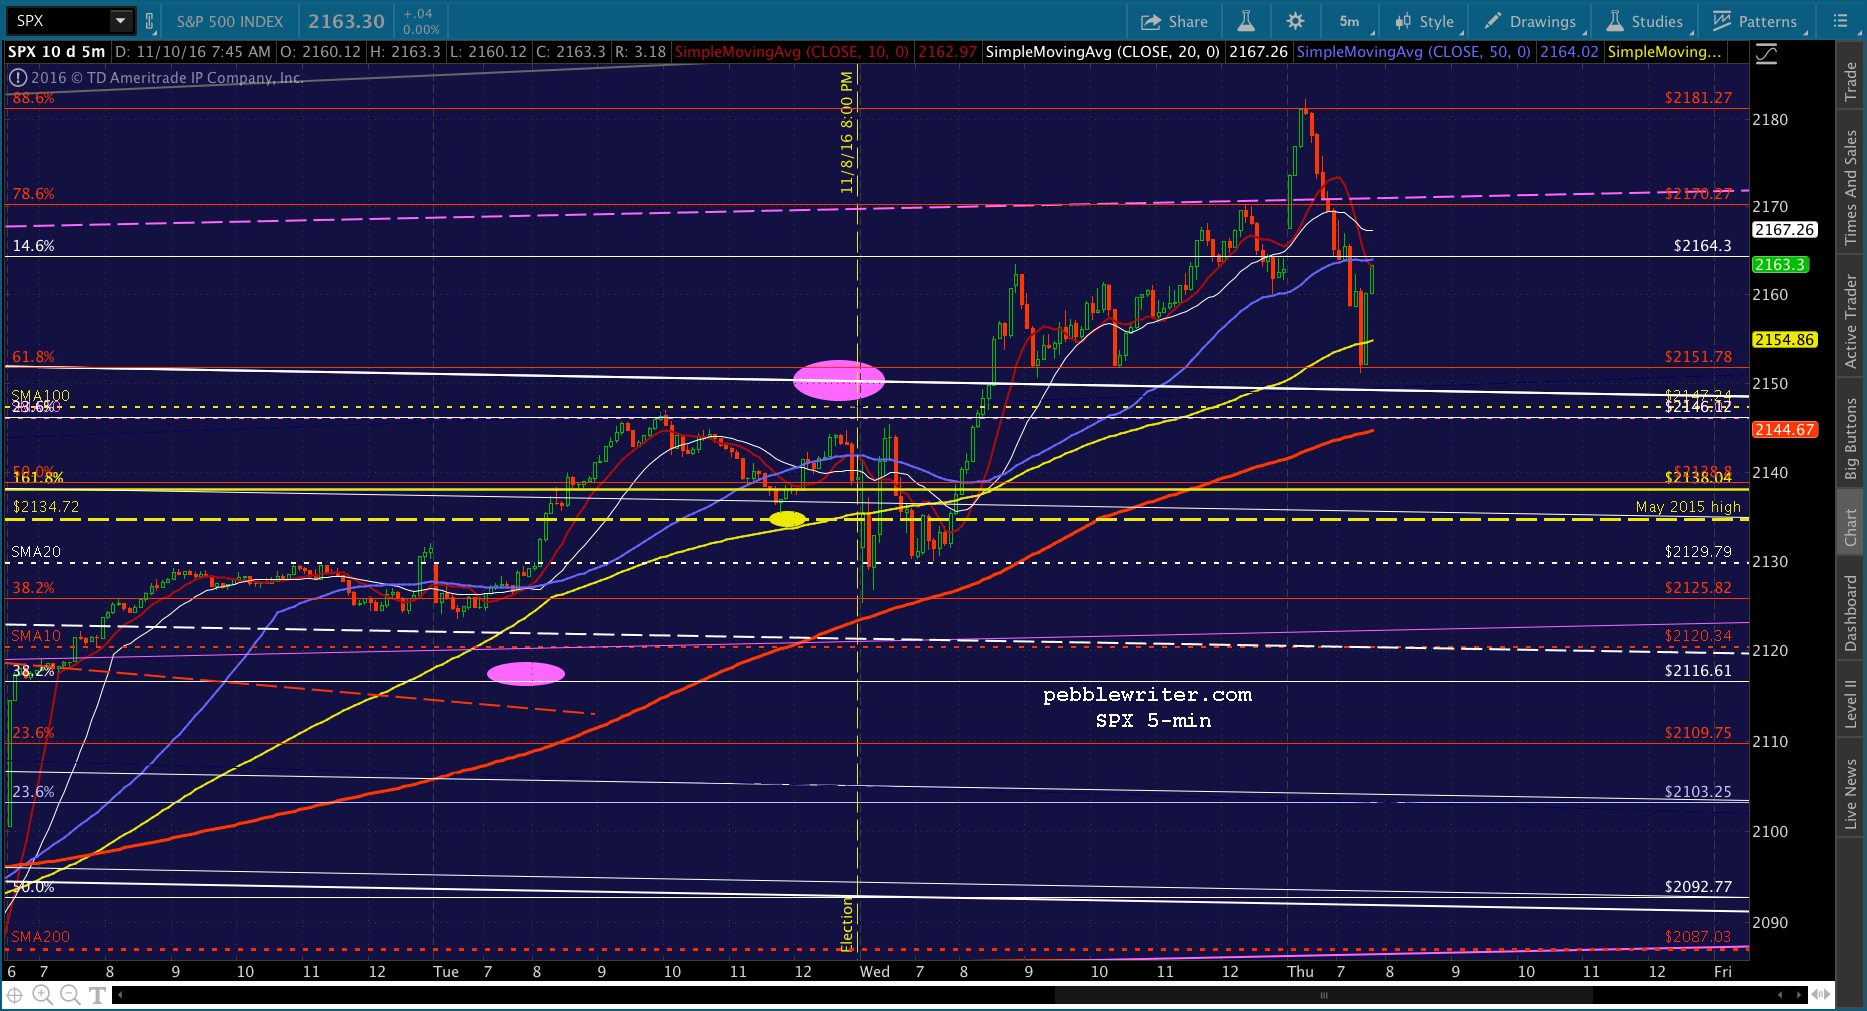
UPDATE: 11:01 AM
Looks like it’s going to hold for now. Probably best to cover here at 2153.48 and go to cash for the time being.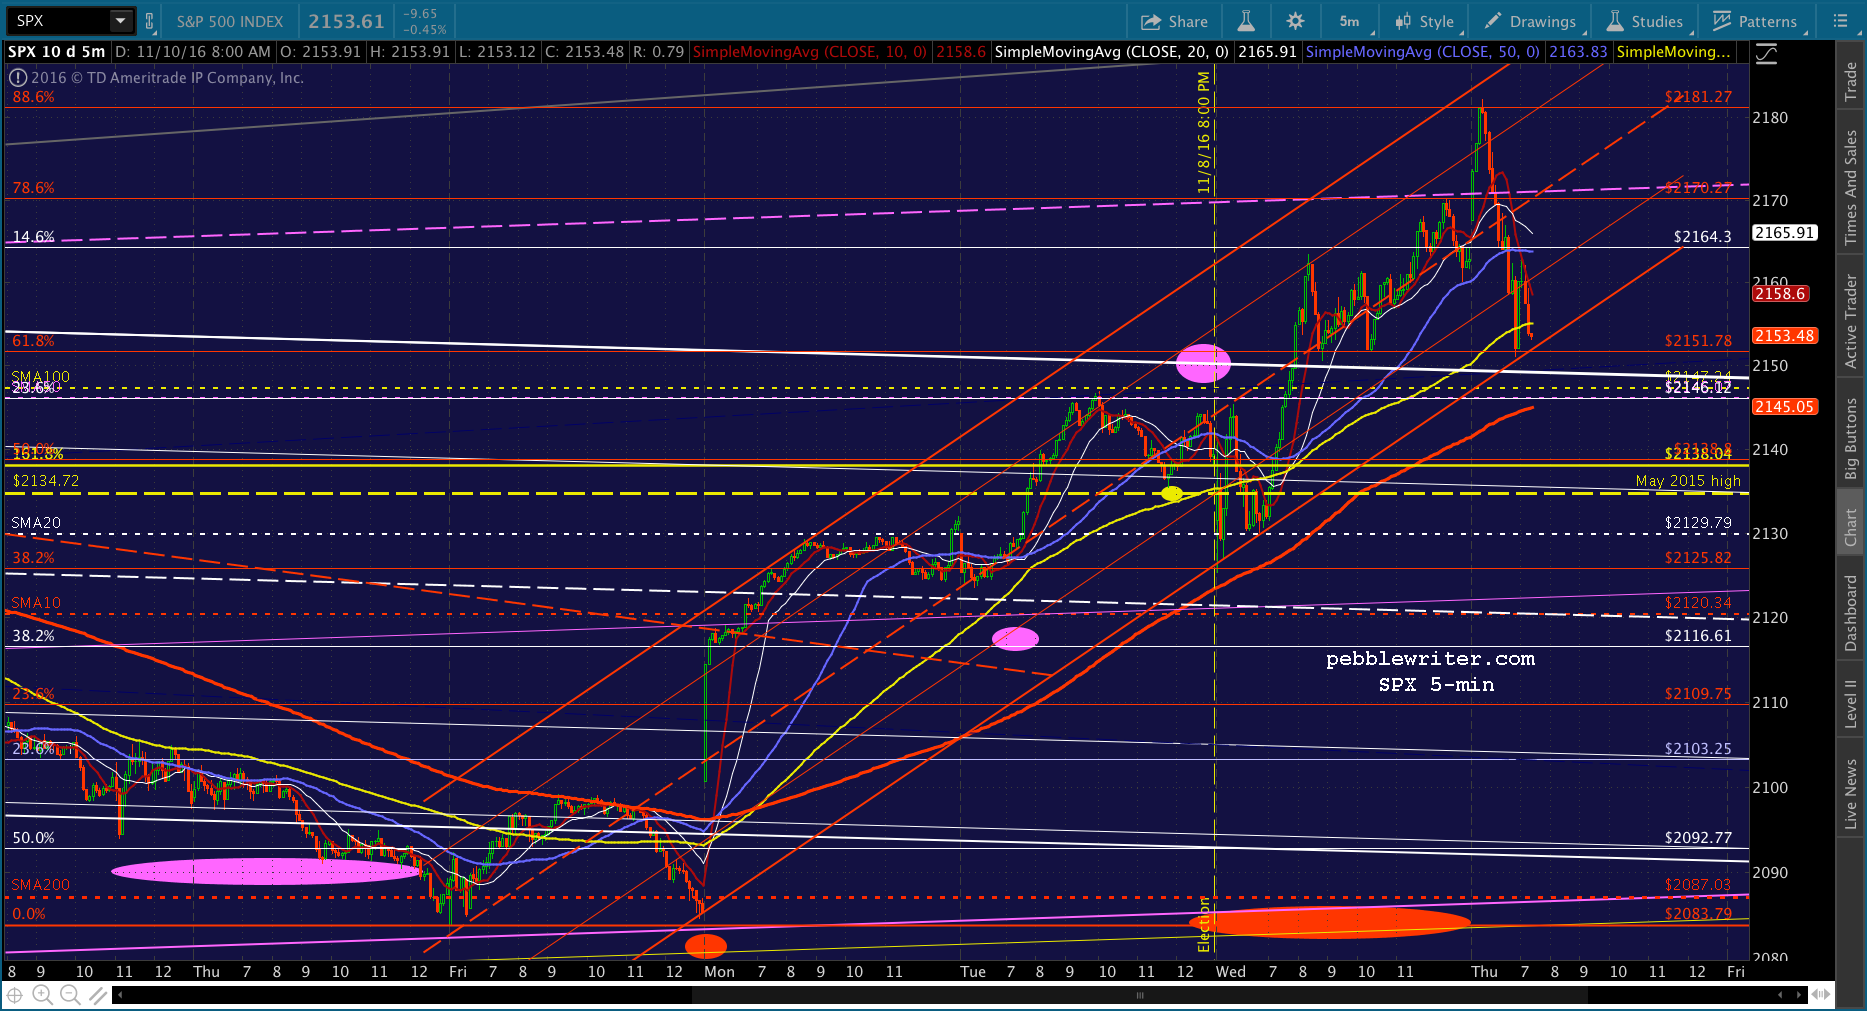
UPDATE: 11:06 AM
NKD, one of my favorite indicators, just signaled lower by dropping through its SMA5 200. Back to short here at 2157.17. Tight stops are advised, as NKD is also very good at head fakes.
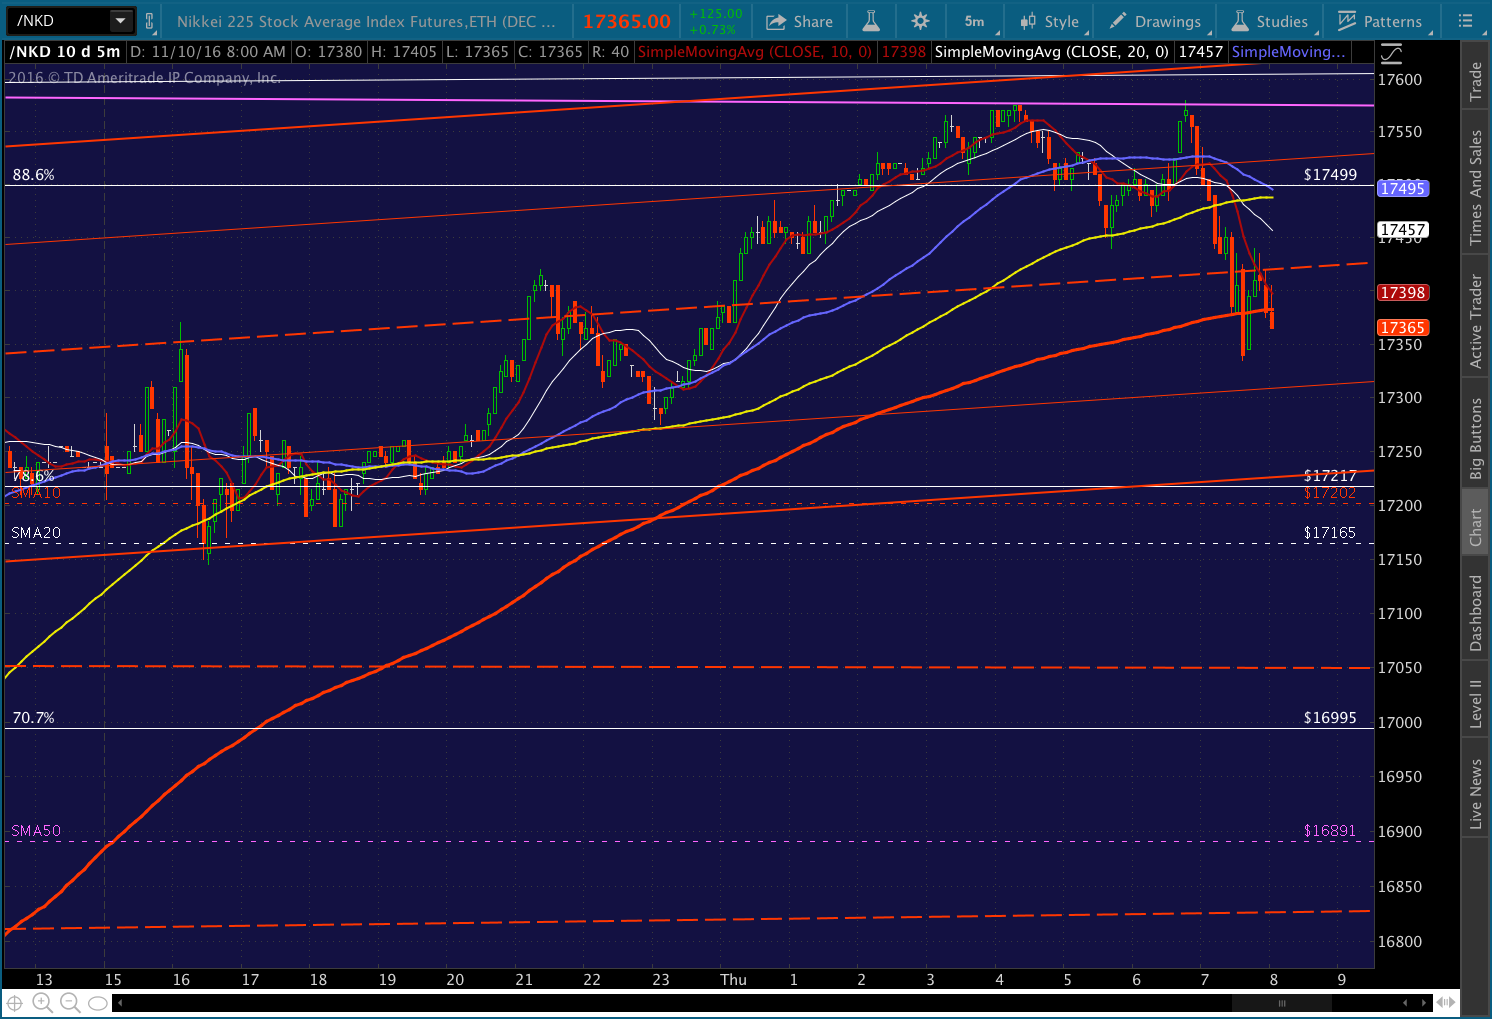
UPDATE: 11:15 AM
Looks like it’s could rally back up to the SMA5 20 into the euro close. Watch your stops if it pops up over the SMA5 10 at 2156.

UPDATE: 11:42 AM
SPX just popped through its SMA5 20 on a VIX slam. Back to cash, though I could be convinced to re-short if the SMA5 50 holds.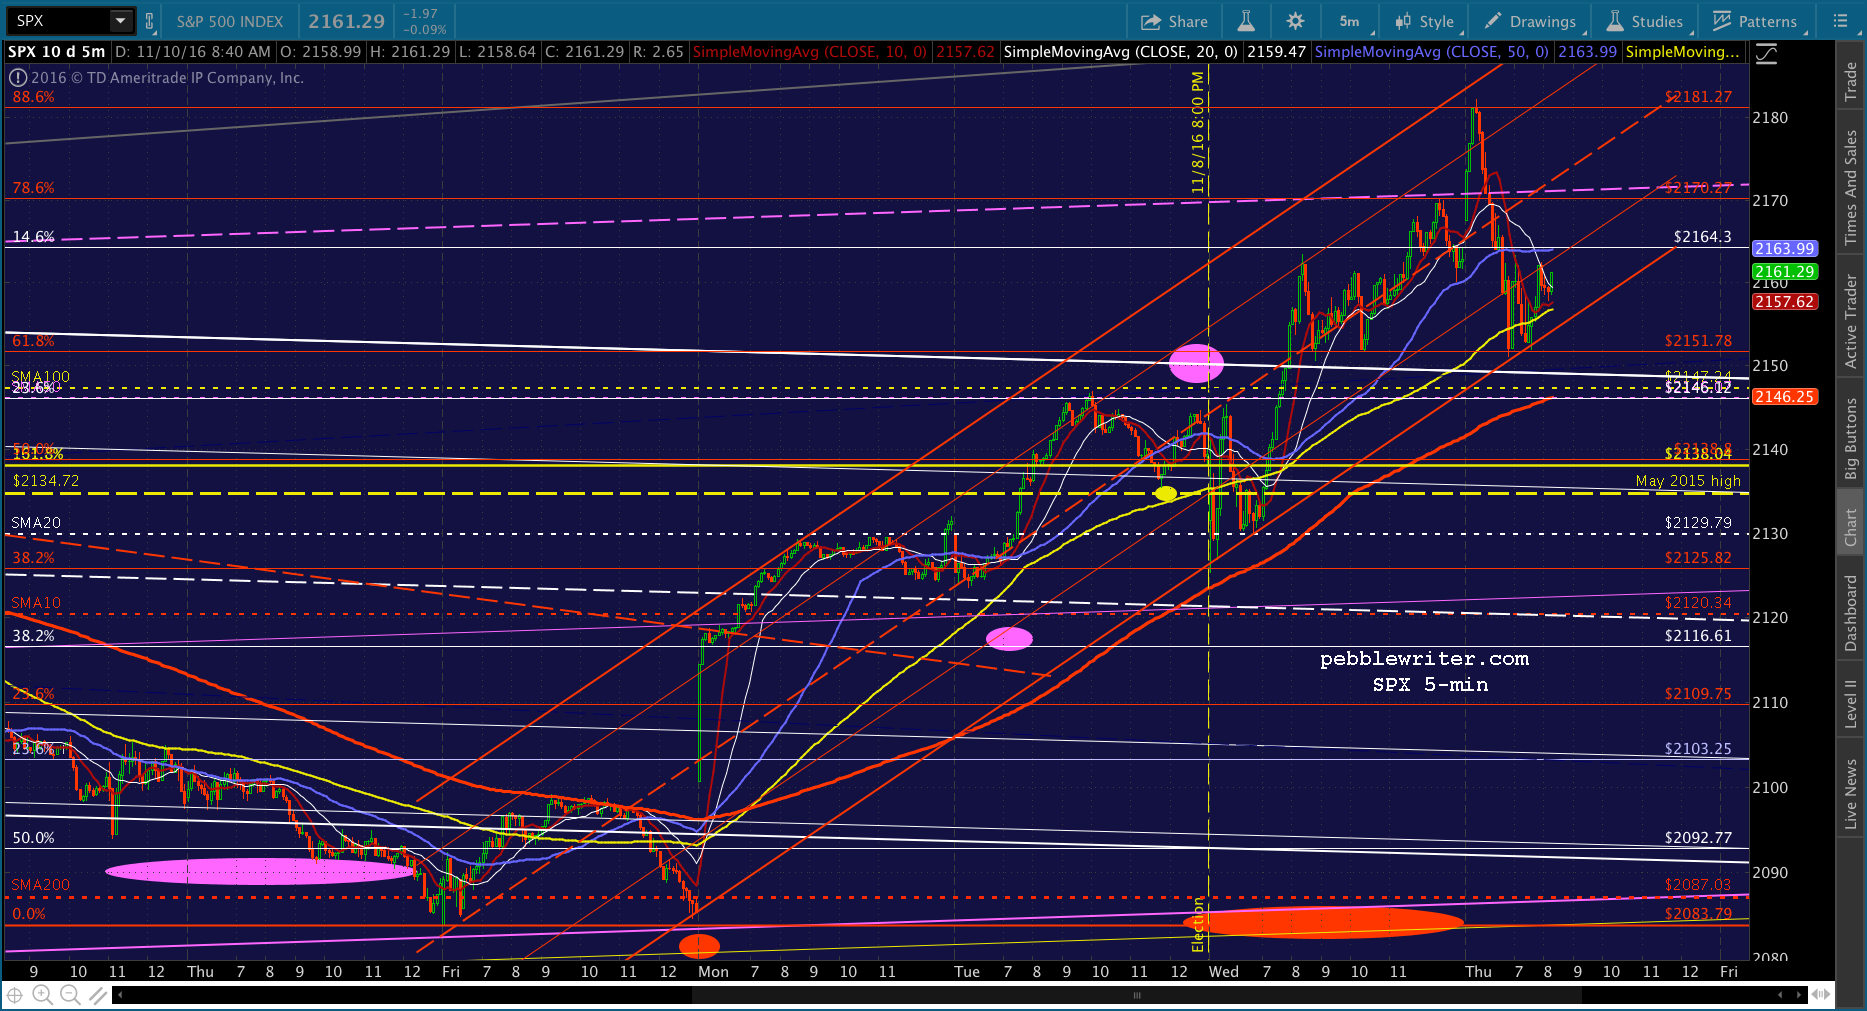
UPDATE: 11:50 AM
Back to short here at 2164.34 with very tight stops. If it doesn’t reverse here, it’s probably not going to — at least today. Coming up on my favorite reversal time of the day: 12:09. And, it looks like the SMA5 200 should reach 2147.24 right about then…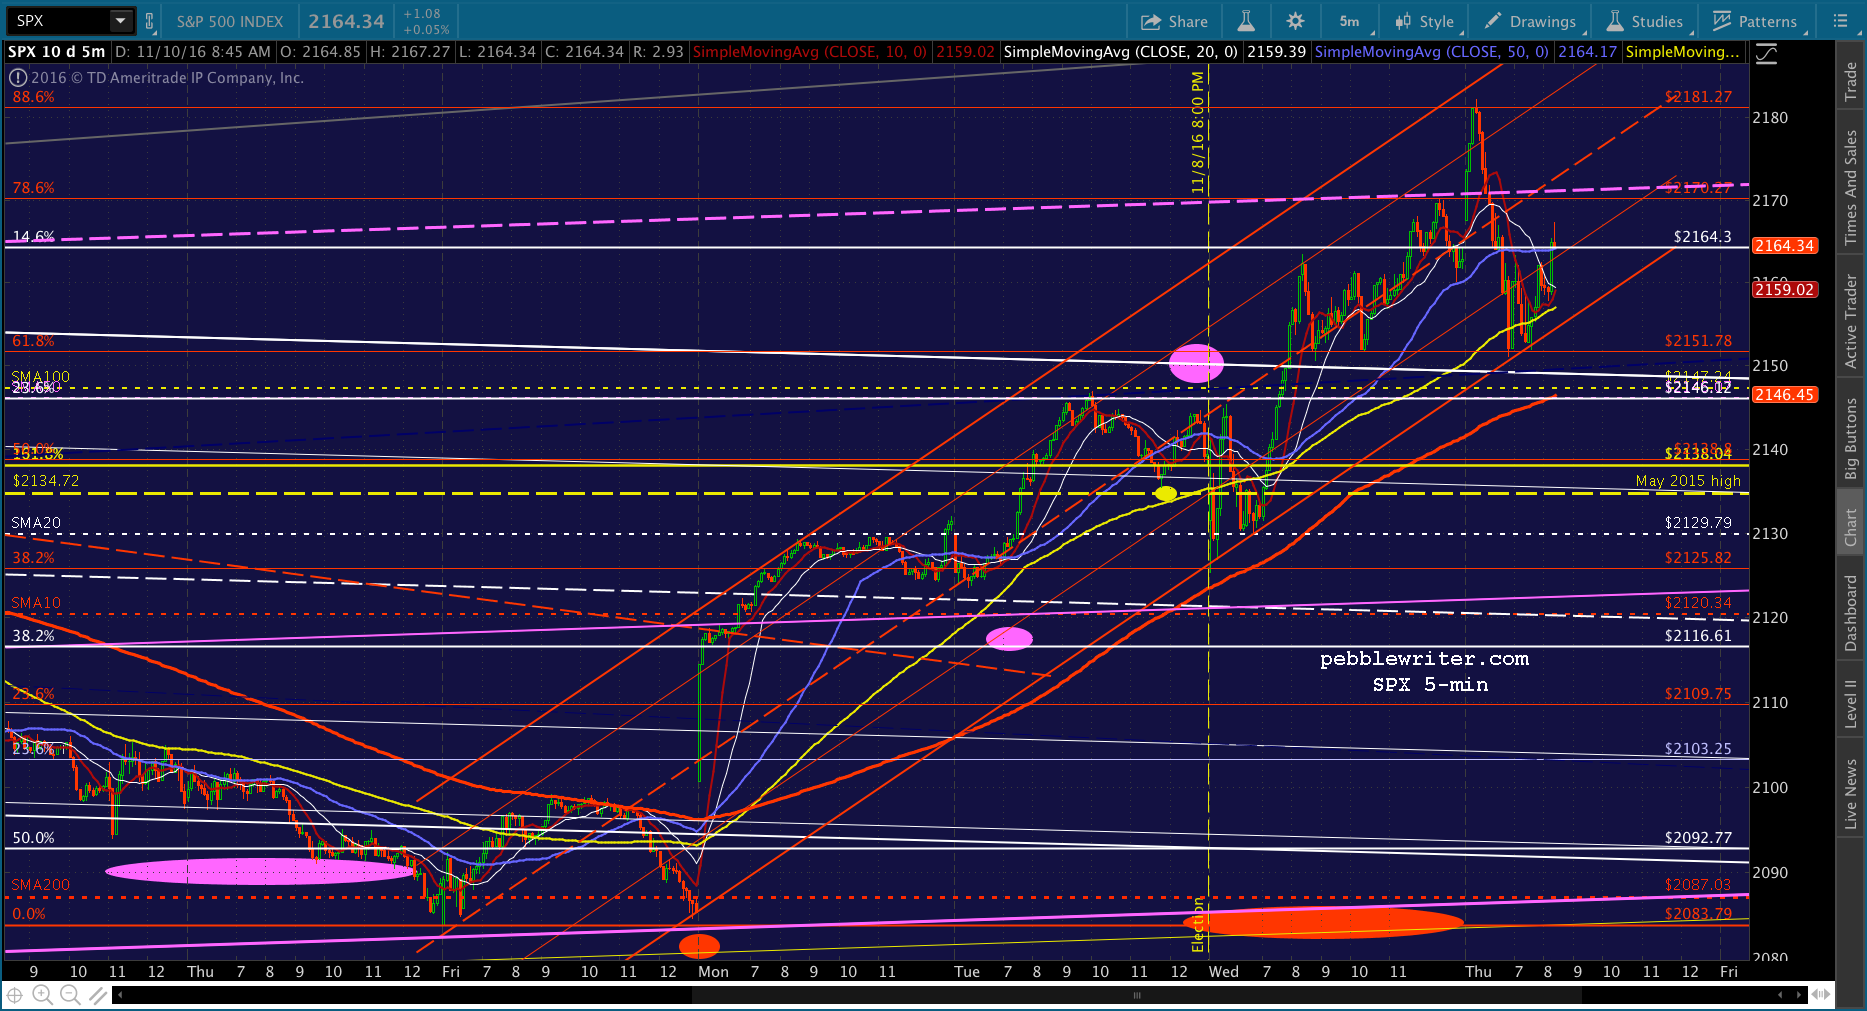
UPDATE: 12:32 PM
VIX just broke down through support and NKD is getting bid. I’ll assume they’re not going to let this channel break down. Back to cash at 2164.65.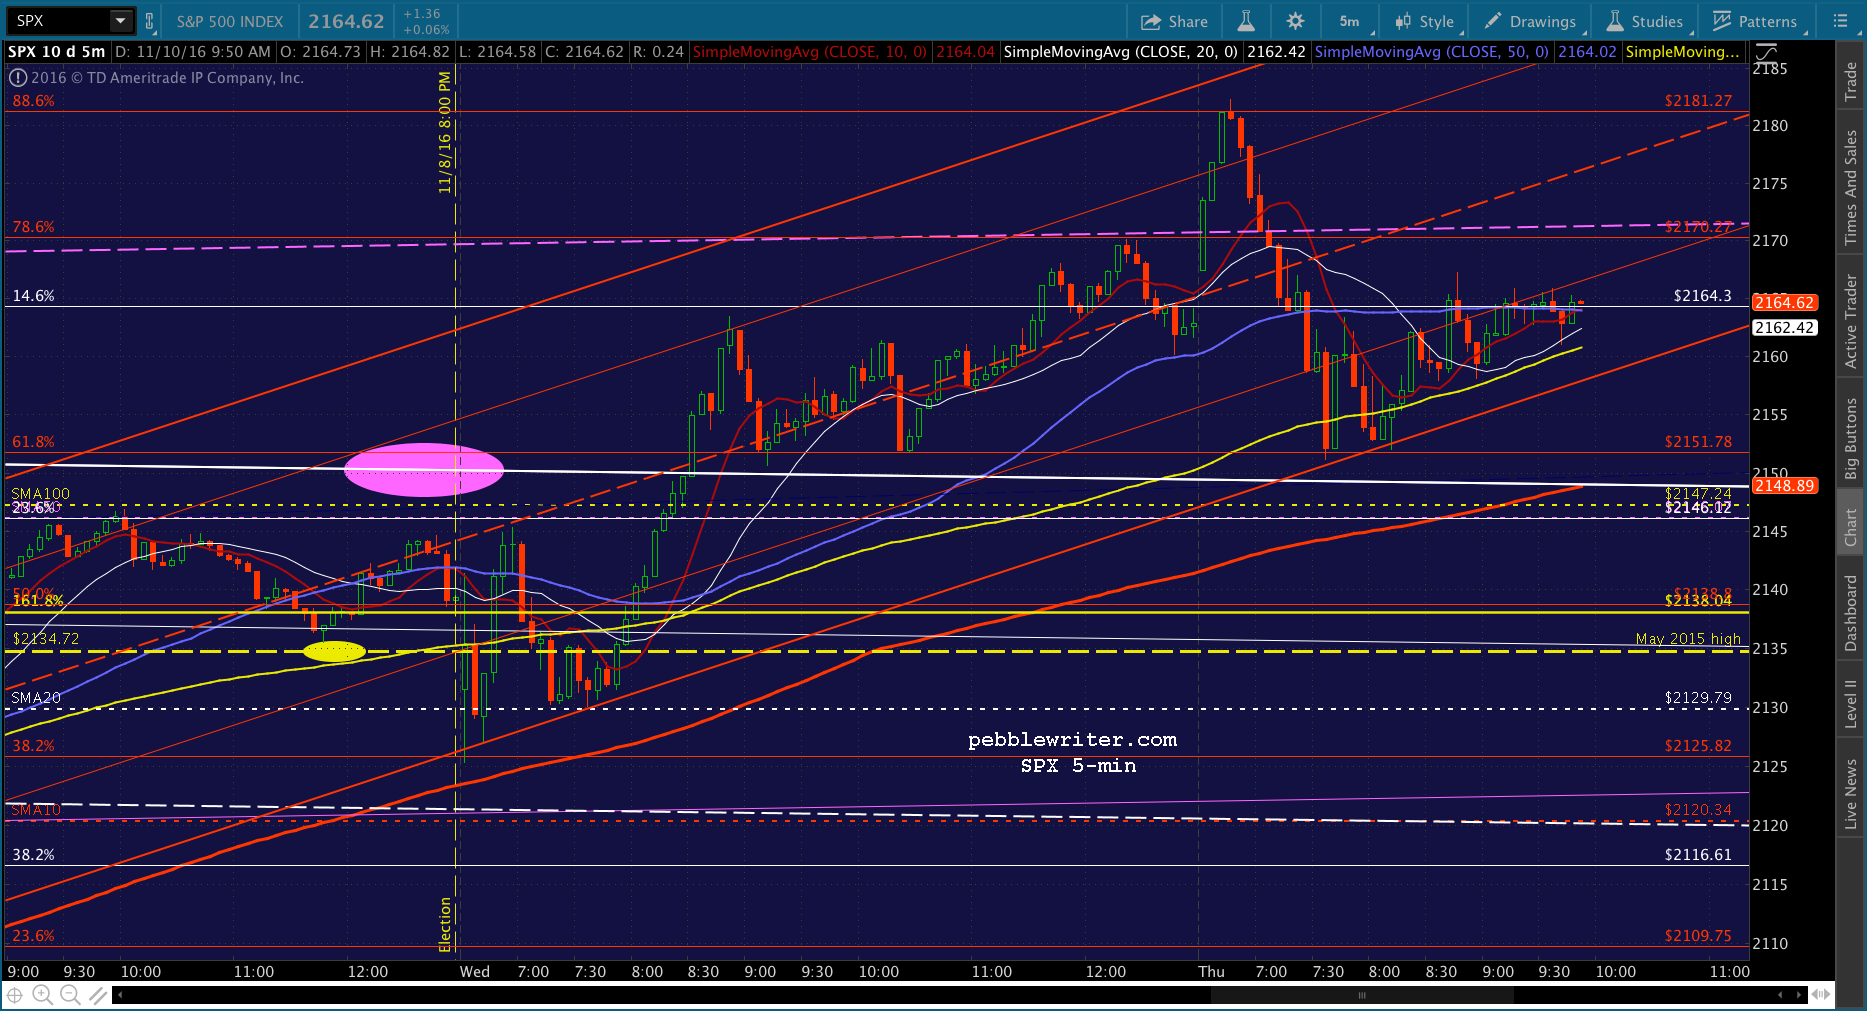
UPDATE: 1:46 PM
Might get another shot at 2178.75…
UPDATE: 1:56 PM
Probably close enough. ES just tagged its .886 from this morning. I’ll try a short position here at 2177.60. If it plays out, we’d have a C=A extension to 2147.13 — awfully darned close to the SMA100 at 2147.24 (which will probably be around 2148 tomorrow.) If they decide to hold off until tomorrow, the bottom of the red channel at today’s close is about 2166.37. Not a bad assumption for leg down from here…
UPDATE: 3:42 PM
Just reached the red channel bottom. If it’s done declining, it should rebound here at 2166.31. I’d cover the short unless you’re planning on holding short overnight and can hedge or otherwise watch your position. I expect SPX to continue falling to 2148 tomorrow, so would plan on holding short.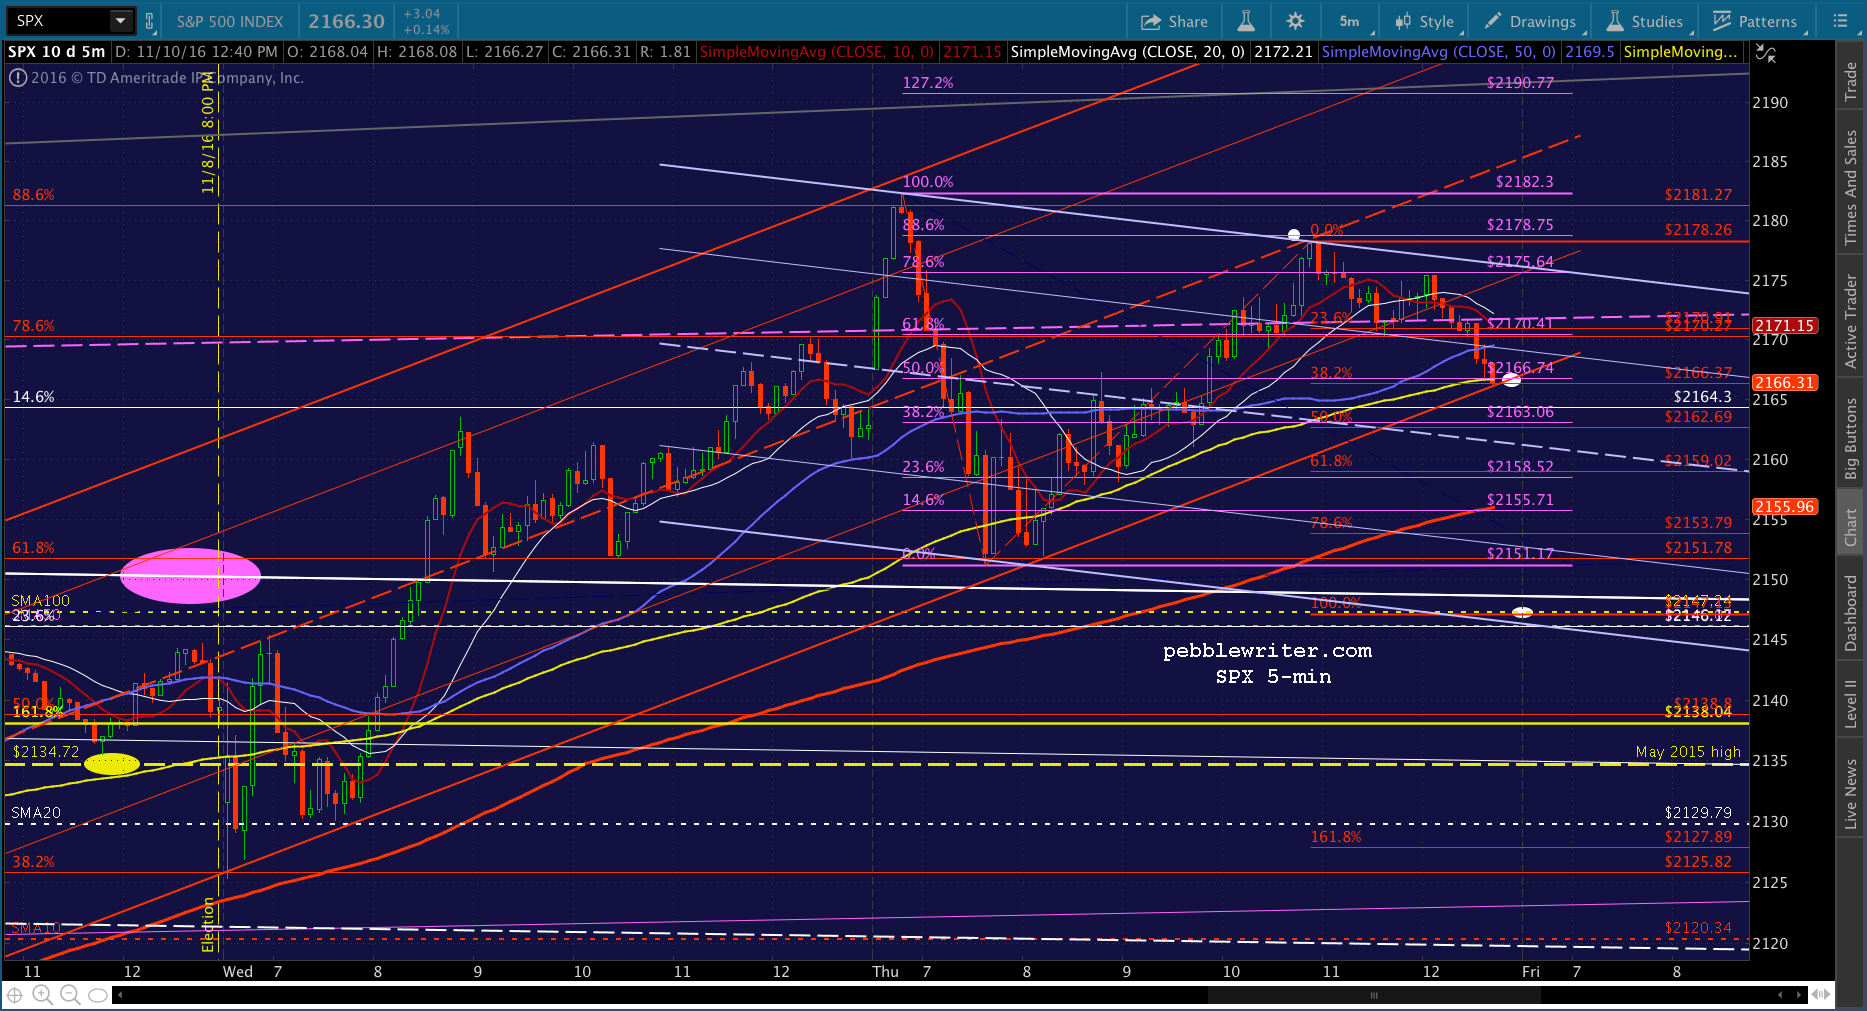
.
Comments
8 responses to “A Good Crisis Pays Off”
PW, is it just my impression that TPTB try to focus only Dow index?
It seems like there is a divergence between Dow and S&P.
It is (relatively) easier to manipulate the 30 stocks in Dow index, than the 500 stocks in S&P.
It is absolutely easier to manipulate the 30 stocks. It’s one of the reasons I detest charting the Dow. It’s extremely unreliable, as breakouts and breakdowns are frequently reversed and chart patterns so often don’t work out. Bottom line, lots of head fakes.
Amzn, Goog, FB are all rolling over hard. That’s the market indicator I’m looking at.
FB has support at its SMA200 at 118.48. Big trouble if it drops through. AMZN support isn’t until 700 — 44 points south of here. GOOG has support at 736, another 50 points lower. Netflix has potential support at 106.97, another 10% lower.
Thanks
Any time.
This thing is all over the place
looks like 2150 is support? Can’t seem to break through it