

No, I’m not talking about politicians. I’m talking about trend lines: the most basic of all chart patterns. Let me explain.
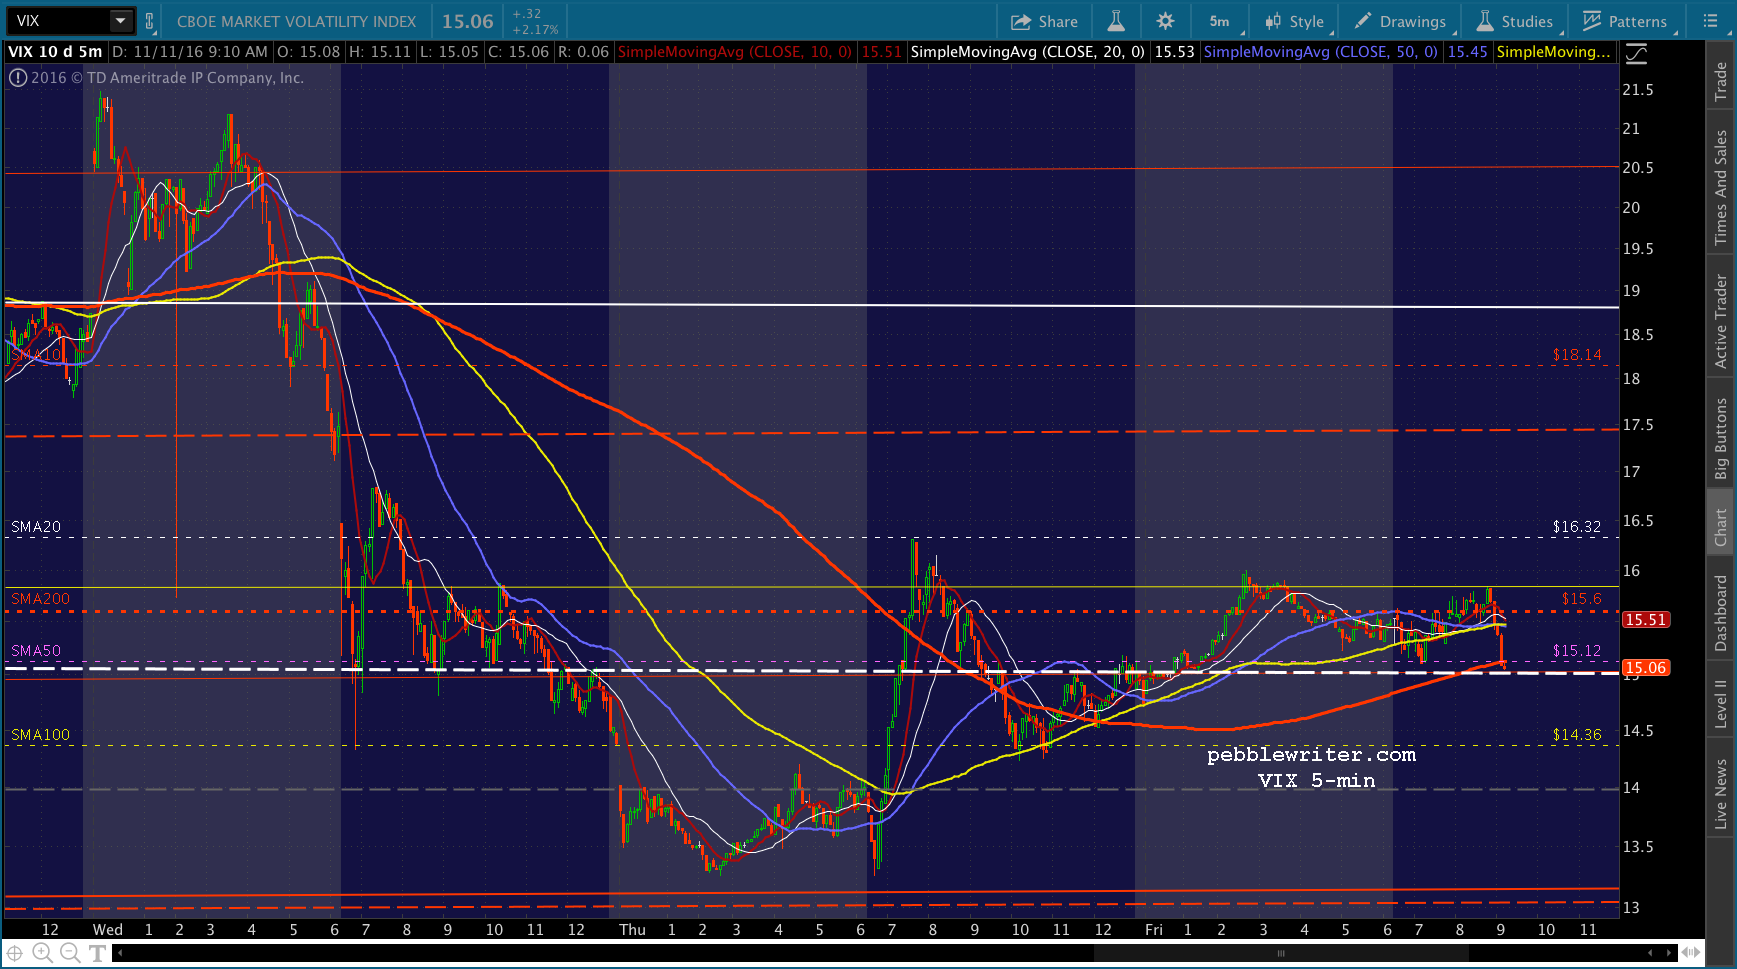
Everyone knows that VIX spikes when markets plunge, and plummets when they rally. In point of fact, it used to work that way. Increasingly, over the past few years, VIX spikes when markets plunge and plummets when central planners wish to support or drive stocks higher [if you have a hard time believing it’s a tool, just watch it dance around its SMA200 (15.6) today.]
It’s one of the subtleties lost on most investors who don’t fully appreciate the degree to which central bankers and their functionaries intervene in markets nearly every day. And, it’s one of the reasons S&P futures were able to execute a 152-pt turnaround Tuesday night.
Setting that aside for now, there’s a glaring discrepancy in the VIX charts at the moment. The huge yellow channel dating back to 2010 has done a pretty good job of forecasting VIX’s lows, but a less than stellar job with its highs.
The falling white channel, on the other hand, has done an excellent job with both highs and lows for the past year or so. And, last, the rising red channel has worked well since its August lows, the tail end of its effort to save the world from Brexit.
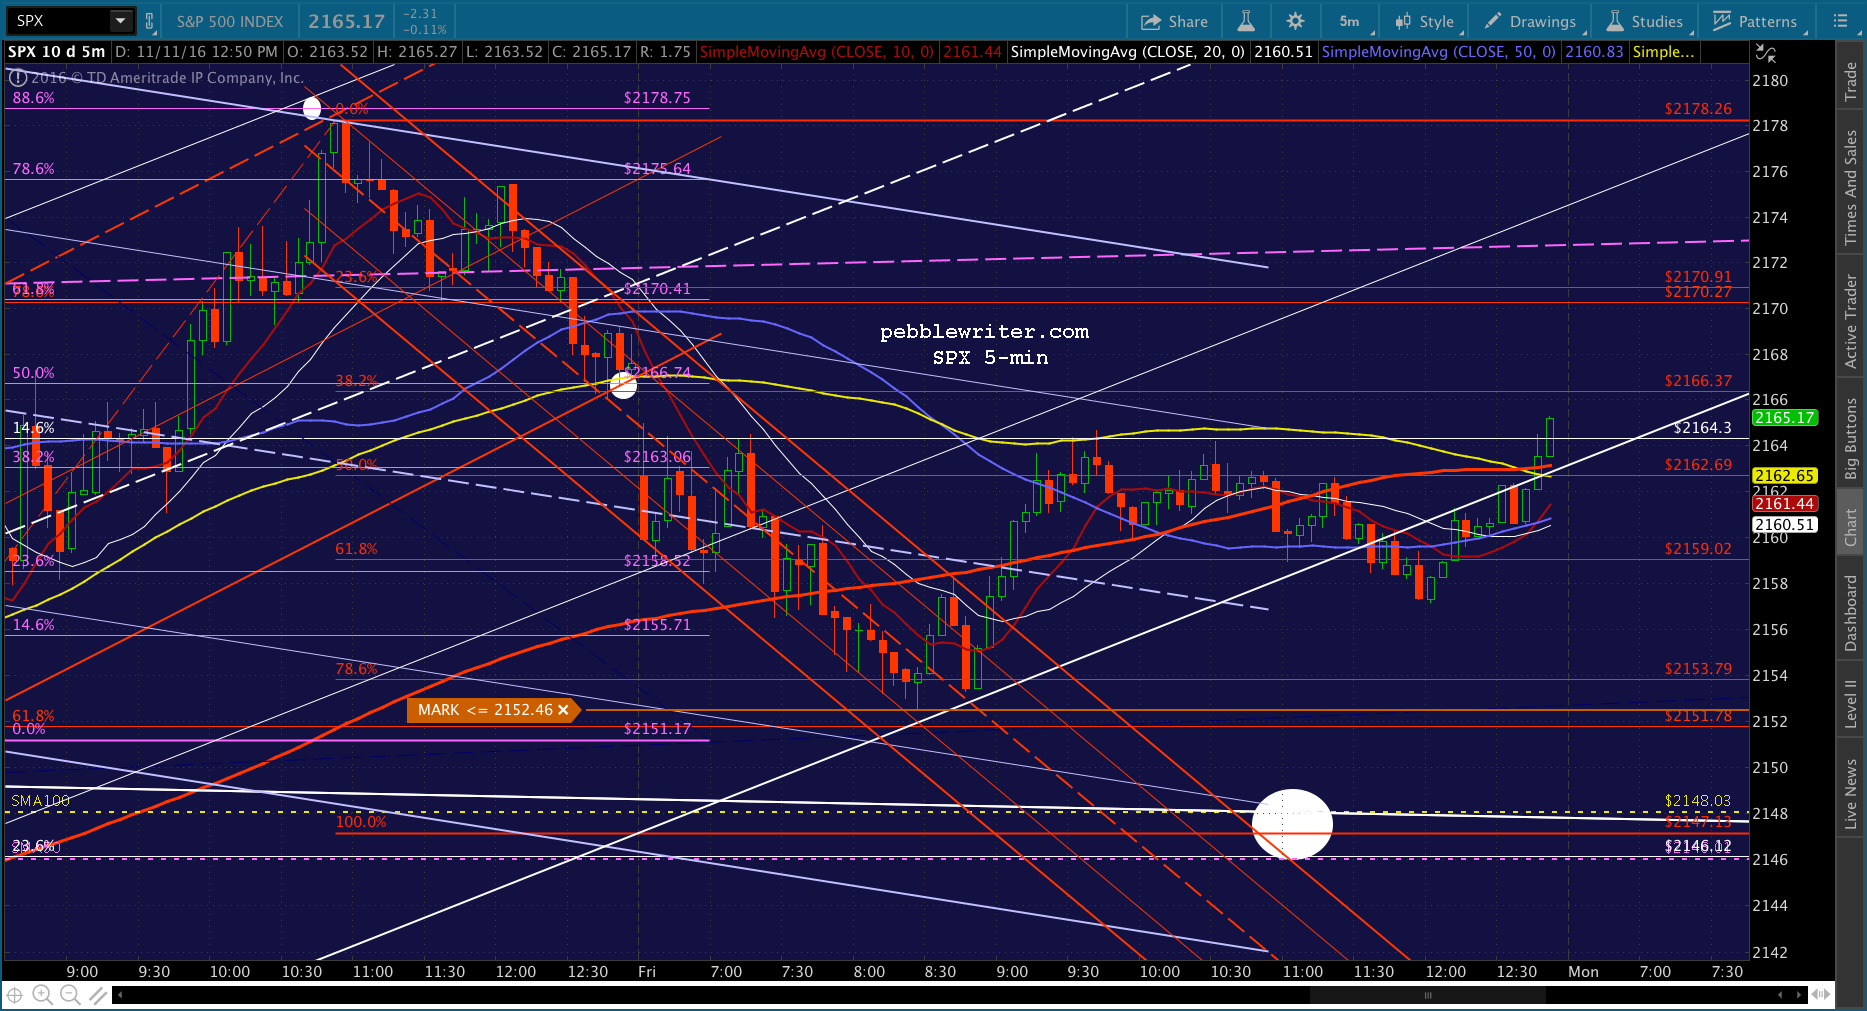
If we look at a closeup, however, we see a red trend line off the August lows that has done a very good job of providing support ever since. We can construct a channel from it if we like, as seen below.
It clearly corroborates SPX’s decline since mid-August. But, it’s in stark conflict with SPX’s breakout past the falling purple TL. One of these TLs is correct; and, one of them is a liar. The answer to which is which will determine whether the latest rally will last, or go down in flames.
BTW, we remain short from 2177.60 yesterday afternoon. Our downside targets remain unchanged.
continued for members…
Here’s a reminder of the initial downside target for SPX. As expected, the rising red channel broke down and the white one is in play. 2147.13 represents a backtest of the broken white channel and a C=A corrective wave. The SMA100 is just above at 2148.03. Anything below 2147 is cause for bears to celebrate.
CL has breeched its SMA200 again… …and USDJPY has continued to reverse off our recent target.
No guarantee that it won’t spurt back up over its SMA200 in order to put the brakes on any serious decline. The BoJ is funny that way…
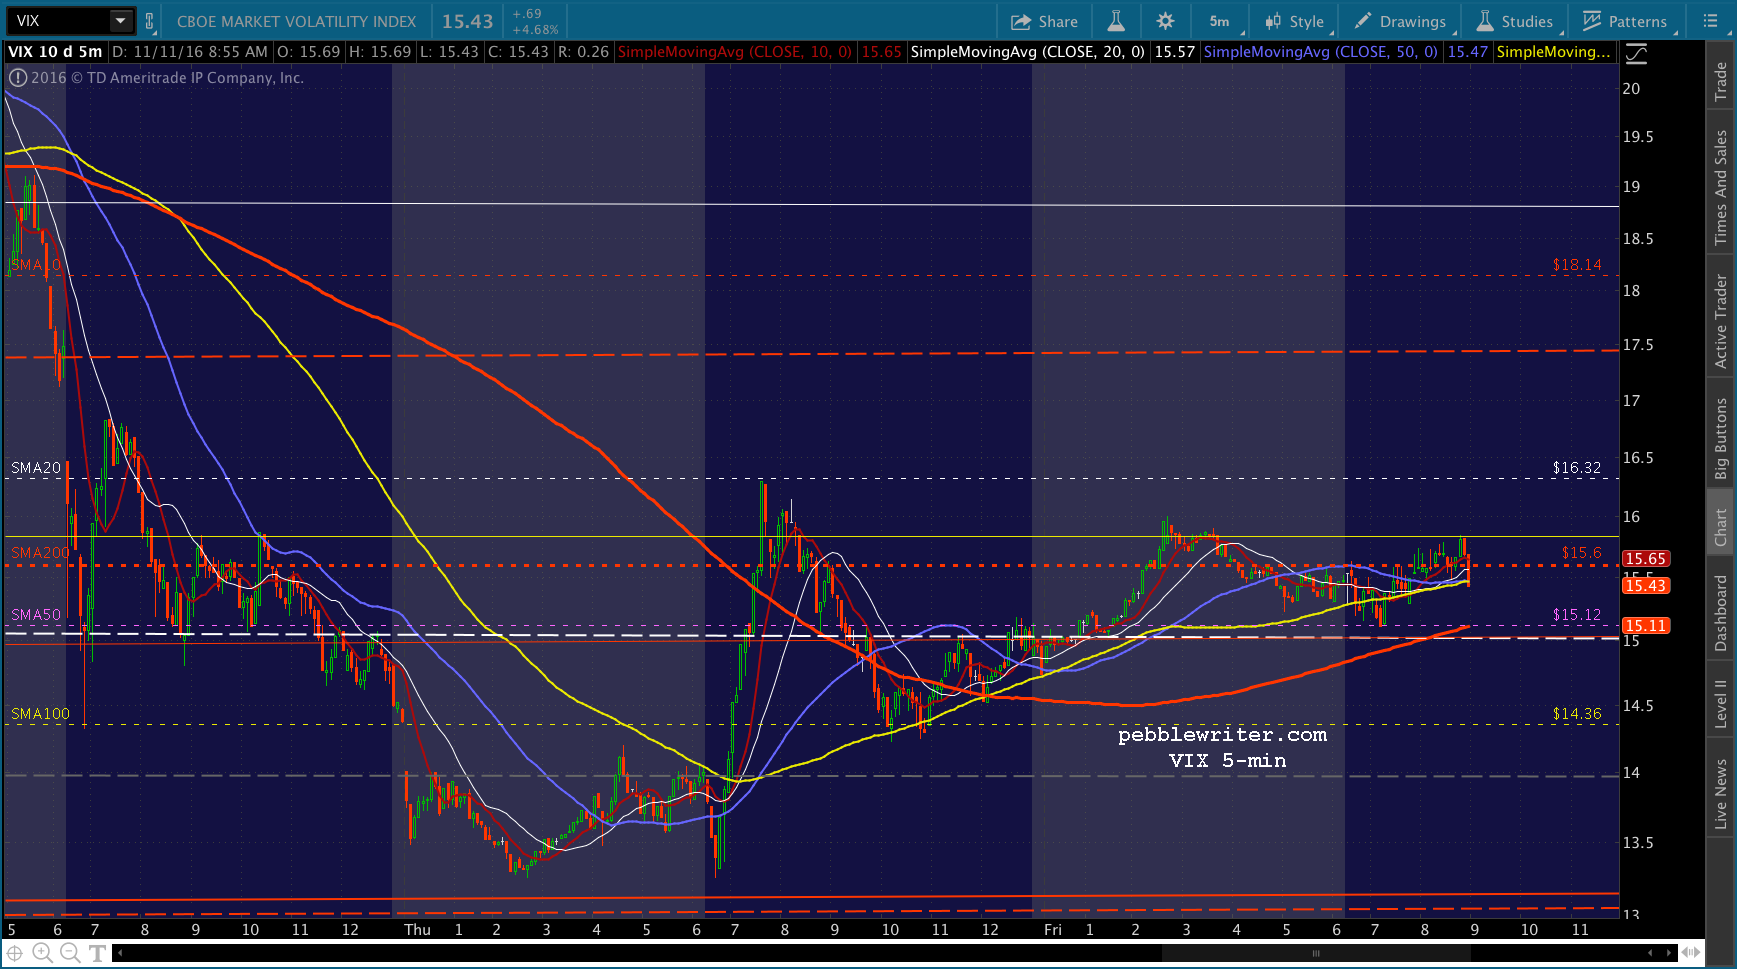
Likewise, any number of players could mess with VIX this morning. It rose up above the SMA200 overnight, and has now slumped back below it. Look for VIX to use it to make a statement about whether or not the downside is done.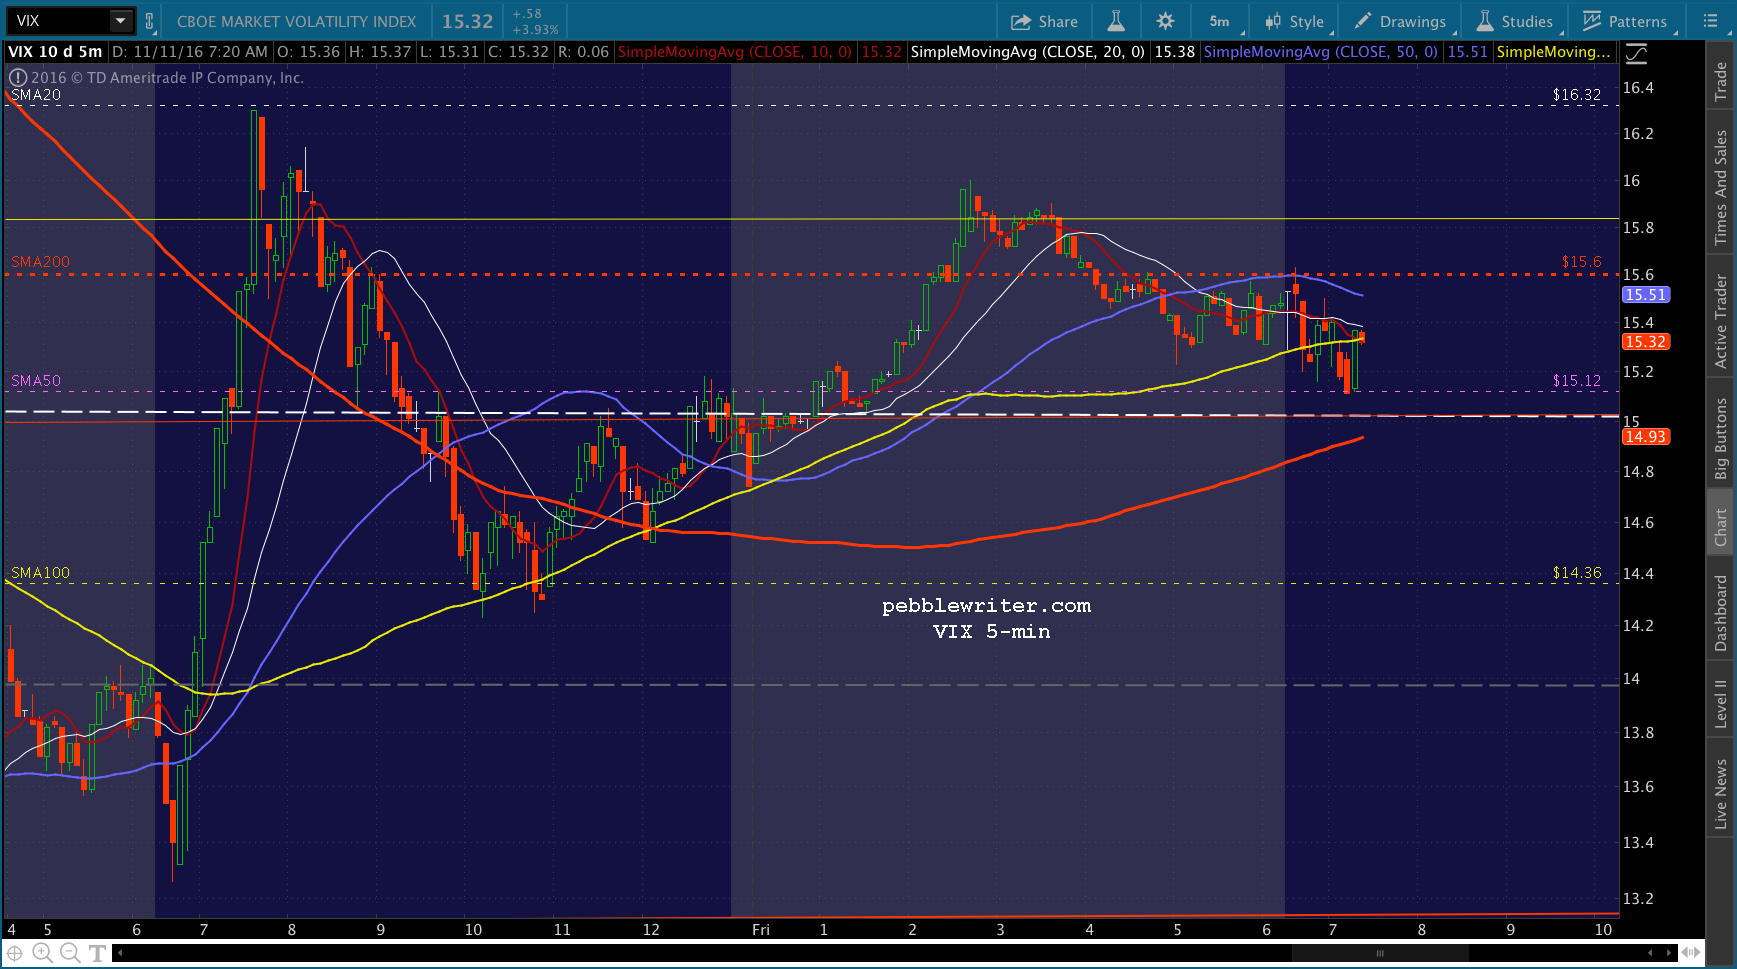
Ditto for CL and its SMA200…

UPDATE: 10:29 AM
Progress report…I’m sure a lot of traders were shocked that SPX didn’t pop up and close this morning’s gap right off the bat. We have a potentially messy situation on the downside.
By delaying this decline, there’s no longer a clean intersection between all the potential downside targets. I’ve drawn in one big target covering 2146-2148, and am hoping it’s more clear when we get there.
UPDATE: 11:51 AM
Quick update shows SPX about to test the white channel bottom again. If you really want to complicate things, consider that ES has a channel bottom down at 2134 and SPX at 2140. Wouldn’t it be fun if we tested the 2015 highs again?
Right about now, there are a lot of conversations — whether between real people or algos — regarding the risks of not putting in a higher low. Any lower, and there’s a small H&S Pattern that would complete.

UPDATE: 11:57 AM
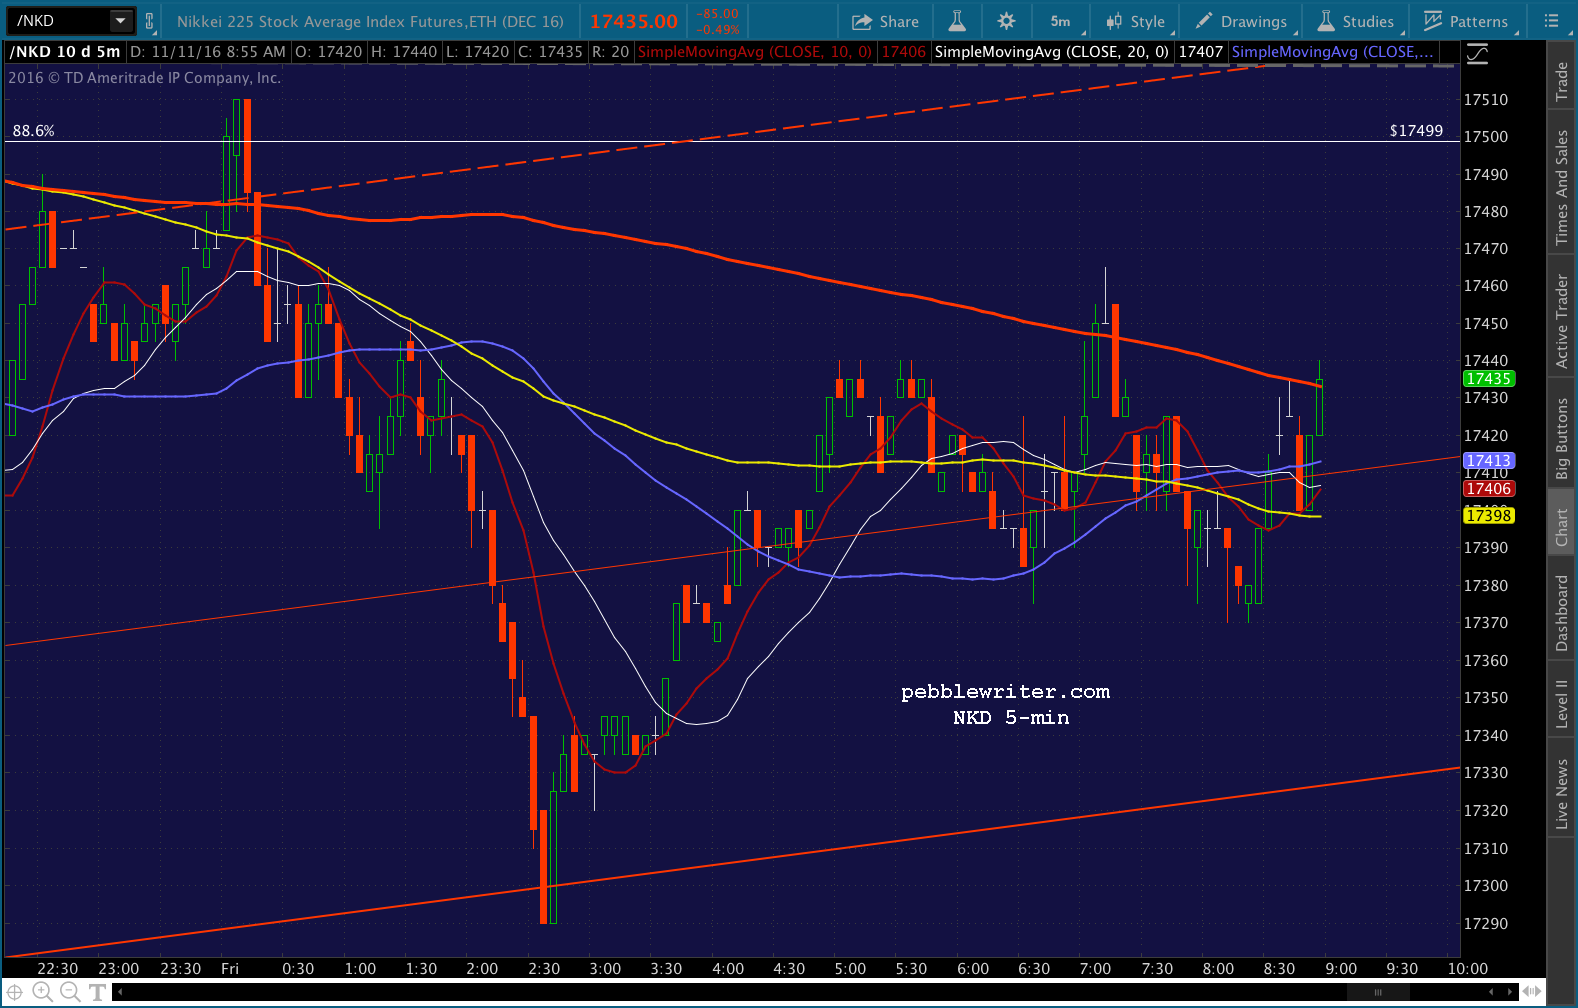
Watching NKD and USDJPY ticking slightly higher and VIX testing its SMA200 again, and I’m inclined to go ahead and cover here at 2155.79. If it reverses, there’s always time to re-short.
When the time comes, I’d look for a reversal by NKD below its SMA5 200 at 17432 and for VIX to pop back above its SMA200 at 15.6 Ideally, SPX wouldn’t push up past the purple midline — currently around 2159.


UPDATE: 12:09 PM
Back to short here at 2160.37. Tight stops are advised.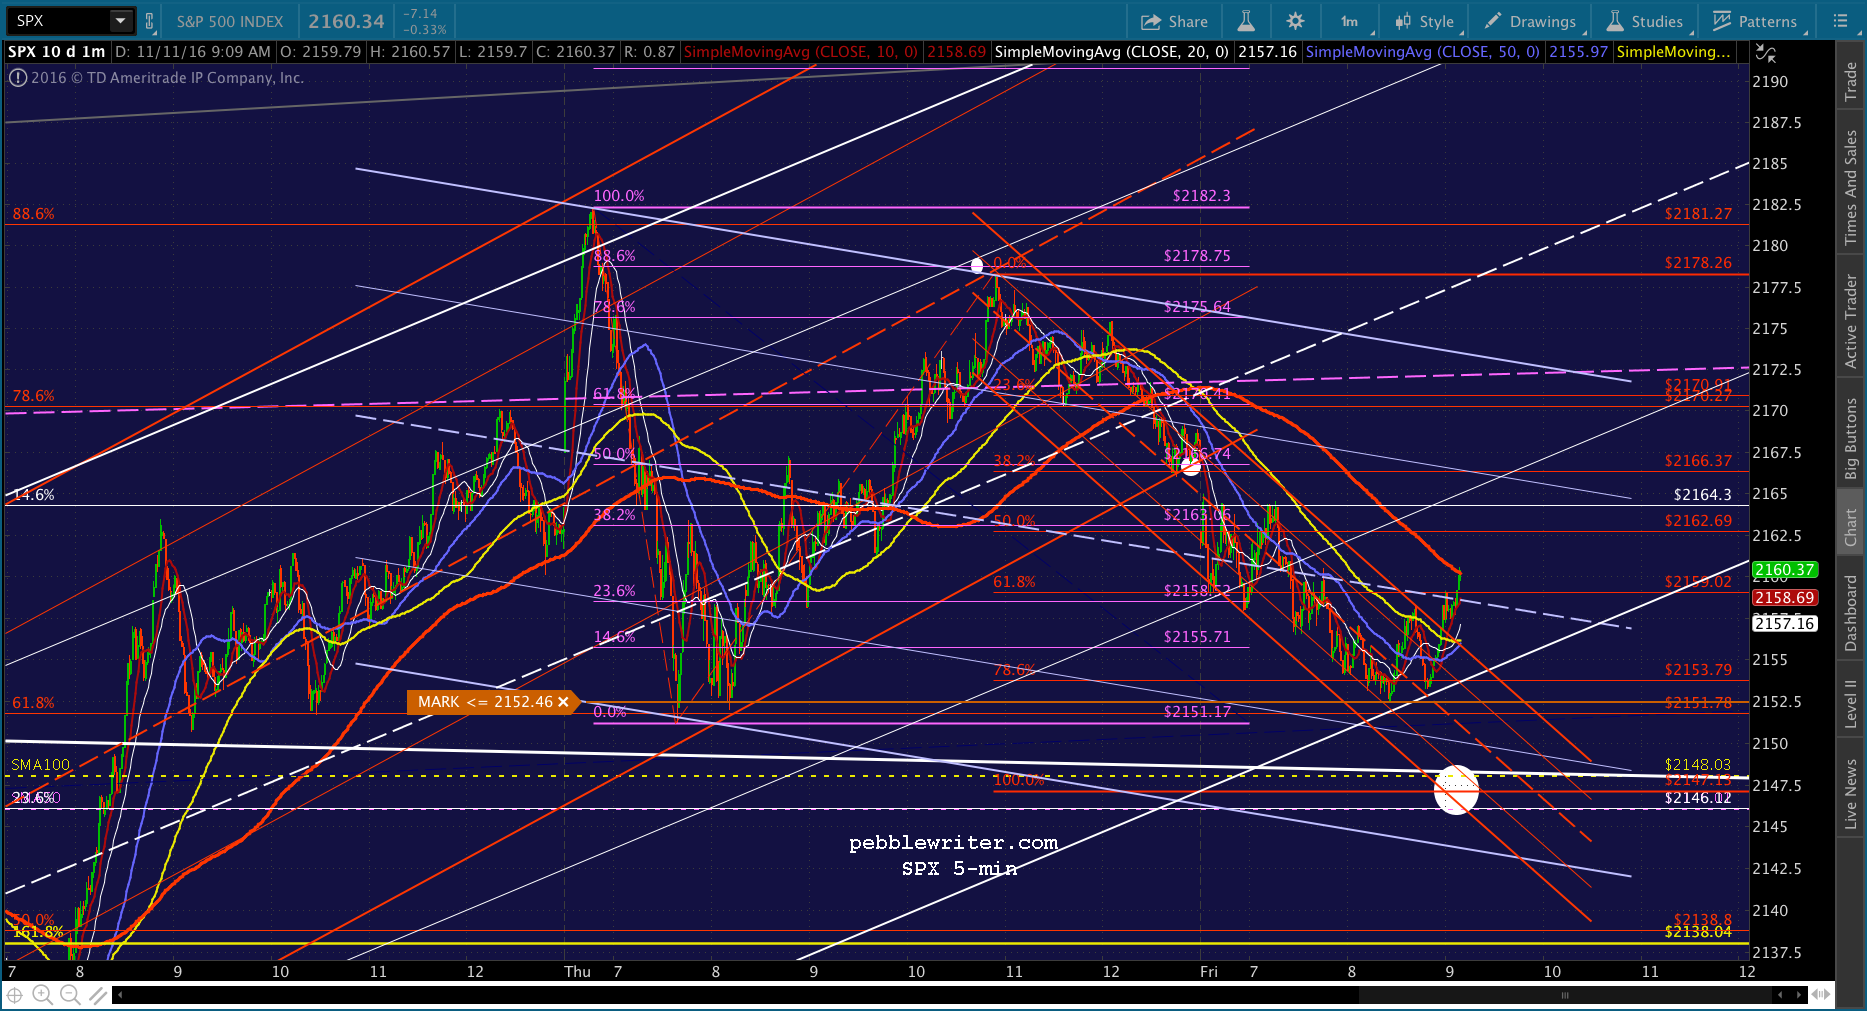
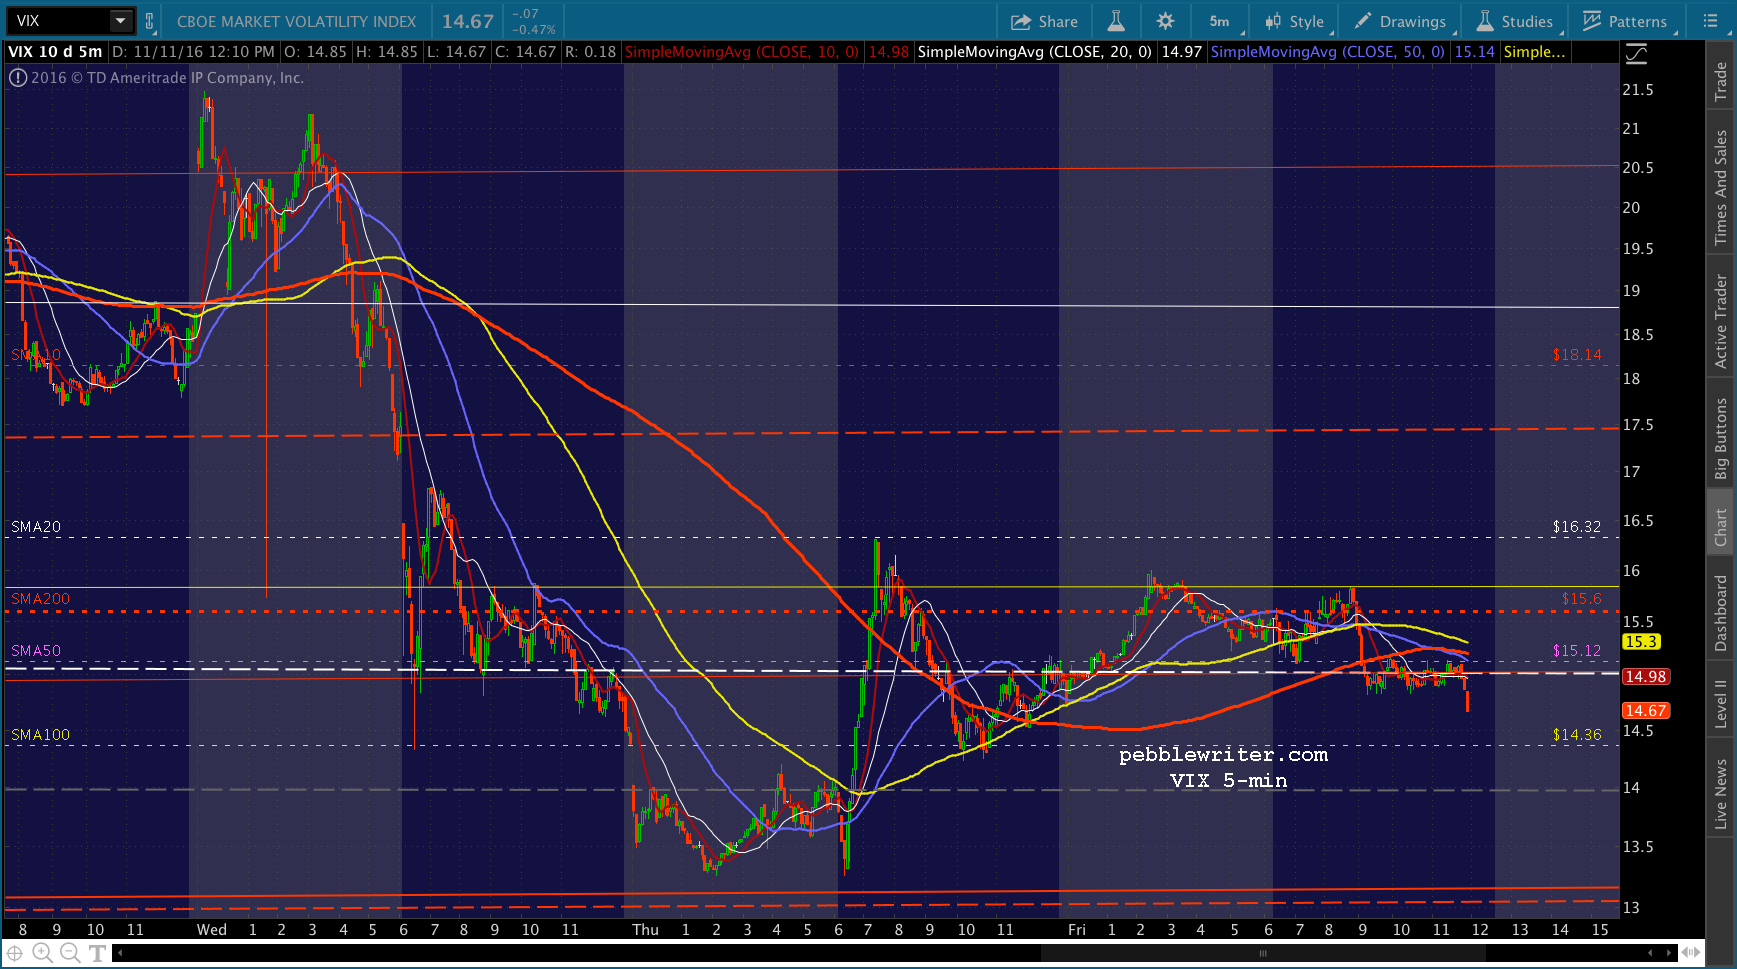
Note that VIX has finally backtested its SMA5 200 and the white channel midline. If this trade is to work, VIX must reverse post haste.
UPDATE: 12:17 PM
Bailing. Going to cash, will reconsider if VIX reverses. The next opportunity is when ES reaches its own SMA5 200 at 2160.88 — about 2164.50 for SPX.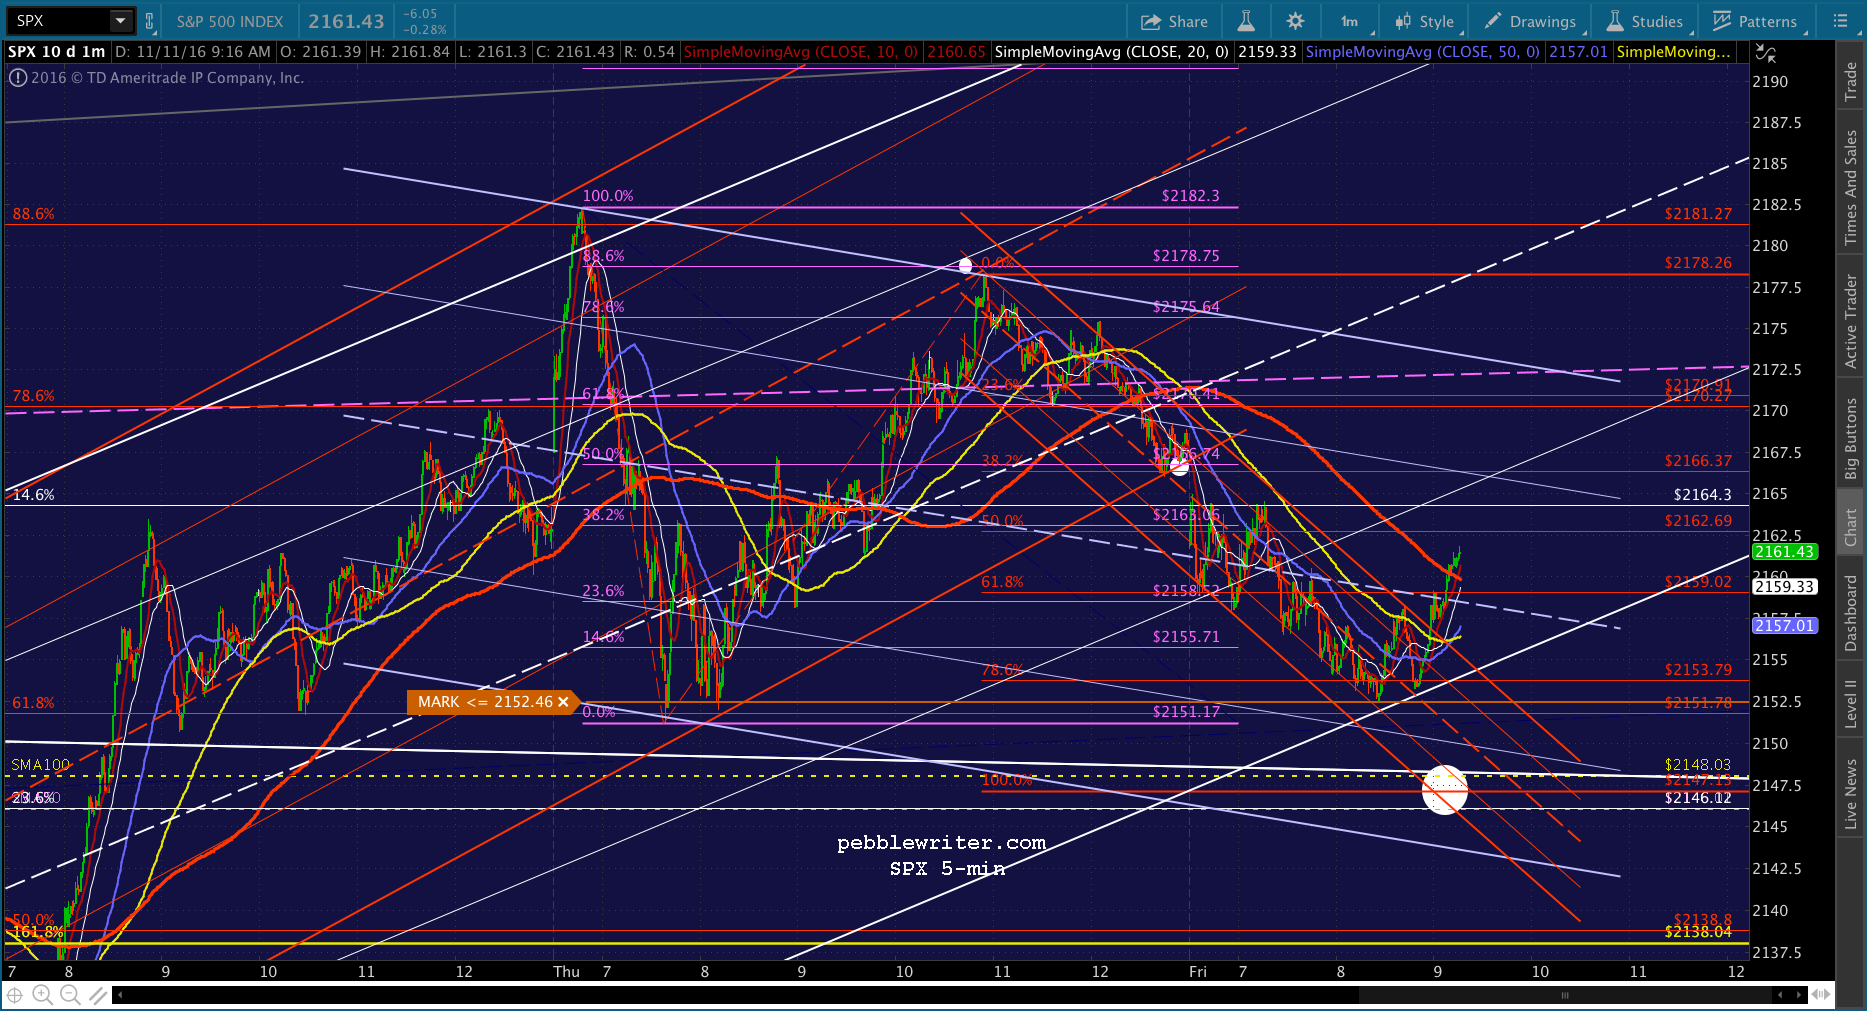
But, for now, it has put the brakes on further declines.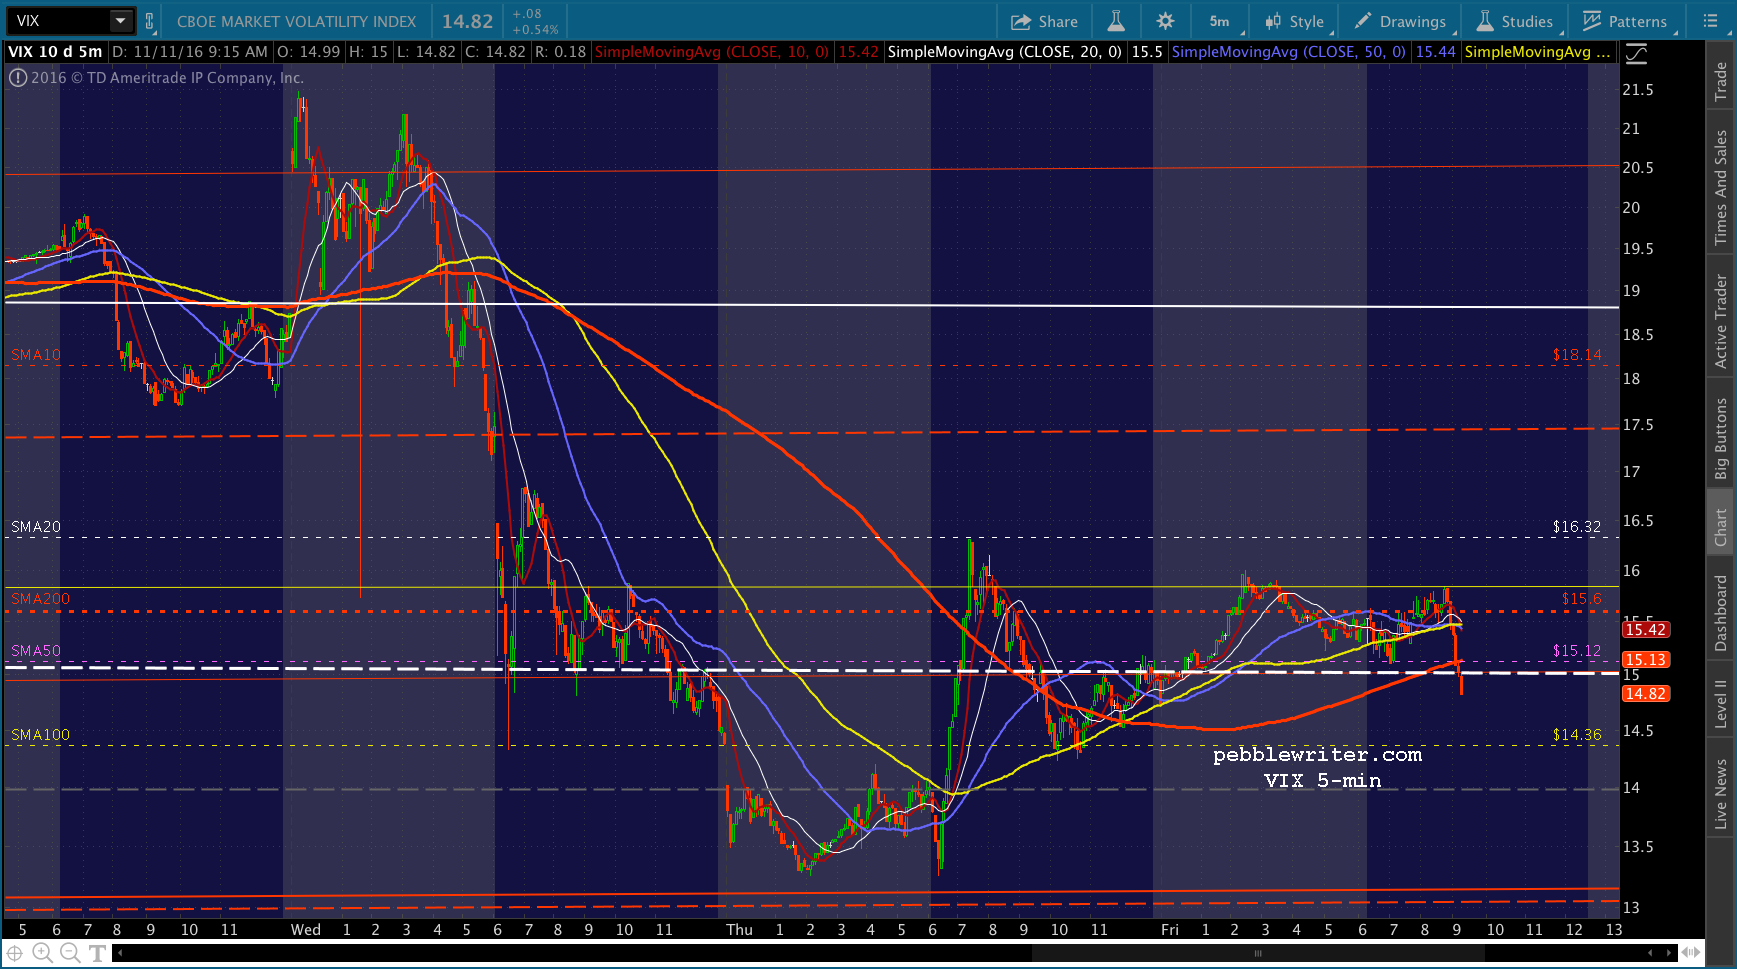
UPDATE: 12:32 PM
ES just reached its SMA5 200, presenting another opportunity. I’d short here at 2164.13 with very tight stops. Again, our target is 2148ish; but, watch out for support at the SMA5 200 at 2159.29.
Thanks to long-time member Tim Melger for the question on RUT. The rising white channel from Feb 11 finally broke down in mid-October, and RUT backtested the falling purple channel at the purple .618 on Nov 3. Like SPX, it came close but failed to tag its SMA200 before racing higher into and after the election. 
It has now reentered the broken white channel (this used to be taboo) and pushed above the purple .886. This is a very bullish move — much like other indices. It remains to be seen whether the ramp will continue to new highs or go down in flames.

I have to step away for 30 minutes. Watch your stops, as this could break either way. Any sustained push above ES2160 is reason to dump this short.
UPDATE: 2:01 PM
I’d close the short here at 2159.12 unless it’s able, later, to drop through the white channel bottom (2159) at which point I’d be happy to short it again. Note that this is the SMA1 200 as well as the SMA5 50.
UPDATE: 2:28 PM
CL just reversed off its SMA200 again. I’d try another short position here at 2161.08. Though, there’s a good possibility it’ll hold at the SMA5 50 and white channel bottom again. This is probably the last chance today for a drop to 2148.
A drop through 43 would probably do the job…

UPDATE: 3:12 PM
CL is rising, and VIX is dropping. I’ll assume they’re not going to let it play out today. I’d cover here at 2159.41 unless you plan on holding short over the weekend. I’d buy the idea of a backtest and, then, drop. But, VIX’s steady decline argues against it happening today. In fact, there’s a better chance that SPX will rise up to tag the SMA5 200 at 2163 at the close.
That way, they could hold off on 2148 until Monday morning, when cautious individual traders are unable to take advantage. Sure, you could hold short over the weekend, but this move is designed to put the fear into you of a 10-20 point gap higher. As always, only do it if you can hedge it or can stand the thought of a gap higher. You never know when they’ll pull that BS on a Sunday night.

USDJPY also appears unwilling to allow any downside at the moment. Gotta say, it really saddens me to see trillions in equities held hostage by these algo arses. Should be a nice short here for FX traders.
UPDATE: 3:51 PM
If SPX were just backtesting the SMA5 200 here at the close, I’d feel a lot better about taking a short position over the weekend. With this pop higher, it makes it that much less appealing. The clear signal is to stay in cash — though it’s 50:50 that it’s a head fake.
We talked earlier today about RUT. It’s now only 14 short of new all-time highs — another good argument for a gap higher on Monday.
I hope to get caught up with a lot more charts this weekend, including an update to the big picture.
Have a great weekend, everyone!
Comments
6 responses to “Which One is Lying?”
PW, as you work on the update of the Big Picture this weekend, would you include CL as well? Thanks!
Wouldn’t dream of not including it.
What’s going on with the RUT?
It’s smelling new highs. Will put a chart up in a moment.
PW, I would just like to take a moment to thank you for staying “on it”, and coming back with clear charting in the midst of this circus. I know I personally almost lost it for a second. So thank you.
You’re very welcome, Vadim. Re “losing it”, don’t let it get you down. I’ve had plenty of those moments myself! If my research is helpful, the best way you can say thanks is to spread the word.