

Oil and gas futures have both tagged our next downside targets from June [see: Update on Oil & Gas, June 6, 2024.].

 We’ll take a look at the road ahead and what it means for the equity and bond markets.
continued for members… (more…)
Oil and gas futures have both tagged our next downside targets from June [see: Update on Oil & Gas, June 6, 2024.].
We’ll take a look at the road ahead and what it means for the equity and bond markets.
continued for members… (more…)
This is the fourth time in a row that ES has pushed back into the rising channel from which it previously broke down. This one is more important, however, as it has the 50-day moving average in its sights.
 As we discussed last week, all the stars are aligned should the algos wish to pursue our upside targets.
continued for members… (more…)
In a repeat of the most effective algo move of the past 10+ years, VIX broke down following the Fed’s no-news rate decision and press conference yesterday.
 As always, this allowed equities to leapfrog an area of stubborn overhead resistance.
  continued for members… (more…)
WTI has reached our 200-day moving average target posted last month. This is a very significant move which, unfortunately, didn’t happen soon enough to affect June CPI or PPI.
Long-time readers know that I’ve been harping on inflation for a long time. The reason is simple: math.
Annual “headline” CPI, which is the one we all fret about, is based on the year-over-year increase in prices – which is why I started worry about inflation in March 2020 after oil and gas prices cratered.
 I did a deep dive on the historical relationship between oil and gas prices and inflation and quickly discovered that the incredibly strong correlation which we began writing about in 2018 was likely to produce some truly scary results.
Up until late 2018, falling oil and gas prices had been responsible for CPI generally remaining below 2%. This chart from Jan 15, 2019 [see: The Big Picture] illustrated how every time inflation got a little out of control (over 2%) gas prices cratered enough to bring it back in line.
 Interest rates had risen right along with inflation until October 4, 2018 at which point I called a top in both [see: The 10Y Breaks Out.] The fundamentals didn’t suggest it at all. In fact, more than a few observers questioned my sanity. But, I reasoned that the recent breakout in rates from a 20-yr channel would prompt the usual response: a sharp decline in oil and gas prices as shown above.
 Trump had been tweeting up a storm with no effect…
…until one day the Saudis handed him a gift. Journalist Jamal Khashoggi, a thorn in the side of the Saudi crown prince, was murdered and dismembered at what was obviously the direction of said prince. The world was pissed and MBS went from being the “cool Saudi” to an international pariah overnight. Trump suddenly had leverage. From Coincidences and Consequences:
 Many considered my connecting the dots in this way a bit of a leap, but it was confirmed by Trump himself while being interviewed by Bob Woodward for his book Rage.
 Long story short, oil and gas nosedived – along with stocks – until they both bottomed out in December. CPI, which had been as high as 2.95% a few months prior, had dropped to 1.55% by Jan 2019.
The story might have ended there, with oil and gas generally bouncing around as supply and demand and interest rate goal-seeking dictated, but the coronavirus had other ideas. By the time the dust had settled WTI had plunged below our 20 target and finally bottomed out below 0. This meant that year-over-year deltas would remain negative for quite a while. But, importantly, it also means that beginning in early 2021, year-over-year deltas would start soaring – which they did.
In Mar 2021, we laid out the case for a sharp uptick in inflation and interest rates [see: Big Picture: Oil and Gas] and asked:
Given that interest rates are close to zero and must remain near zero out of necessity and the dramatic increase in oil and gas prices since last April’s crash would result in at least a 40%+ YoY increase and CPI is very positively correlated with YoY increases in gas prices and interest rates are very positively correlated with CPI, will politicians and central bankers allow oil/gas prices to remain at these levels?
At the time, I thought not. CPI had reached 2.6% and the 10Y had reached 1.75%. I thought it a likely point for a pause lest CPI pop up over 3.5%.
But, the Fed — which had fallen under the spell of rapidly rising stock and housing prices — decided otherwise. They advised us to ignore what we could see with our own eyes and play along with their “transitory” fantasy.
They doubled down and sold Wall Street on the wonders of the reflation trade (remember when that was a good thing?) A month later, CPI topped 3%. Two months later, it topped 4%. Tuesday, we learned that has now reached 9.1% – seemingly out of control.
Many blame President Biden, arguing that his energy policies are responsible for the rise in oil prices and, thus, inflation. While it’s true that WTI rose from 53 to 93 in the first year of Biden’s presidency, the YoY delta in gas prices had peaked at 62% in Nov 2021 and was rapidly declining. By Feb 2022, it had fallen to 41% – historically commensurate with CPI around 5%.
It didn’t play out that way for four primary reasons:
Reasons 2-4 might indeed have been transitory. We’ll never know. But, it was Putin’s invasion of Ukraine that spoiled the Fed’s plans. Instead of reversing at a very logical Fibonacci level which coincided with the top of an obvious price channel, CL popped up and tagged a target on Mar 7 that we hadn’t expected to be reached until the end of the year.
 Had prices even stabilized at January’s levels, inflation likely would have fallen as the YoY delta fell back to under 20%.
 Even if prices had continued to rise at the 1.73% per month average seen in the first year of Biden’s presidency, it seems likely that CPI would have fallen.
 Take away the Fed’s profligate QE and Putin’s monumental miscalculation and we might never have seen 6%. Instead, we’ve got this.
 The Fed is finally on the case, raising interest rates and trimming back their balance sheet. But, it’s hard to know how large a decline in stock values they can stomach before at least signaling a pause.
It’s also difficult to know how deep a recession to expect. I believe we’re already in one. But, how far will the economy fall? Various sentiment surveys and the Atlanta Fed’s research indicate that the decline is gaining momentum.
Will it spill over into real estate as in 2008-2009? Will rapid wage inflation morph into rising unemployment prints? I think so, but suspect the Fed will blink at some point. The first test will likely be when stocks decline to pre-COVID levels – about 30% from the January highs.
Last, I’ve no clue when/if/how the war in Ukraine will end – just that it will eventually will. But, God knows how much damage will be done in the interim. Europe is in for a very tough 2022, with inflation spiraling higher thanks to surging energy costs, the plunging euro, and no wiggle room in a slowing economy to preemptively raise rates.
A broader war with Russia seems increasingly near-fetched. If they’re really lucky, they’ll merely experience a quarter or two of stagflation. If not, we could be looking at Great Financial Crisis II, with bank failures and spiraling interest rates thrown in for good measure.
And, don’t think for a moment that it wouldn’t affect the US. The Fed is gambling on a soft landing with nearly full employment. But, it never seems to work out that way, does it? And, would we even want that?
A soft landing would probably mean energy prices never get to clear. That the proverbial can gets kicked down the road for the next administration/Congress to not handle. I live in California, where gas prices are still well above $6/gallon. I’m okay paying that if it means forcing Putin to back down. It might even accelerate the development of alternative energy so my grandchildren will inherit a planet worth living in.
But, I’m well aware that I’m in the minority. So, the guys behind the curtain are going to need to come up with some pretty fancy footwork: a plan that keeps energy prices falling, inflation back under 4% and the 10Y back under 2.5% – all without bringing on a recession that sends stocks down 50% and real estate down 20%.
Personally, I don’t think it’s possible. I think the recession and falling asset prices are not only inevitable, but necessary. It’s also what our analog suggests. To that end, here are our expectations for the very exciting next few days.
continued for members… (more…)
I don’t usually pay much attention to the DJIA. It’s a nonsense index that’s manipulated six ways to Sunday and has little following in the investment community. Having said that, the financial press reports on it all the time and the average Joe, seeing this, seems to care.
As a result, we often see weird things happen in the markets when the Dow reaches significant inflection points. The last great example of this was in the depths of the pandemic crash in 2020. President Trump, who frequently cited the Dow as a measure of his success, was understandably concerned as markets tanked.
 Tweets such as this took on an ever more anxious tone as the plunging Dow approached the level it was when he took office in 2016, with tweets alternating between cheerleading the markets and goading the Fed and Congress into taking action.
When the Dow finally reached the levels at which it traded on election night 2016, the crash was miraculously over. From our March 20, 2020 post Time to Buy:
 As we all know, the market closed the following session at 18,591, a mere two points above its close on Nov 9, 2016. Some coincidence, huh?
Why does any of this matter right now? The Dow is closing in on another of those interesting inflection points: its 2020, pre-pandemic highs at 29,568. 
If the folks behind the curtain have decided that we can’t handle dipping below the “everything is alright” marker, then we could get a nice bounce here.
If, on the other hand, this time really is different, that support will be breached and investors might just start panicking a little more, down to around 28,800 or lower by mid-July.
 Stay tuned.
 Now, almost 25 million cases and over 400,000 deaths later, we stand by our comment at the time that such tweets were both irresponsible and dangerous. Eleven months later, we’re still paying the price for not taking things seriously.
Imagine if we had closed all borders at the time and asked everyone except essential workers to stay home for one month. Anyone who had been exposed at that point could have been quarantined and their contacts traced through a federally coordinated effort as was done in many other countries such as Australia, New Zealand, Singapore, etc.
Imagine having a chart shaped like either of these…
Now, almost 25 million cases and over 400,000 deaths later, we stand by our comment at the time that such tweets were both irresponsible and dangerous. Eleven months later, we’re still paying the price for not taking things seriously.
Imagine if we had closed all borders at the time and asked everyone except essential workers to stay home for one month. Anyone who had been exposed at that point could have been quarantined and their contacts traced through a federally coordinated effort as was done in many other countries such as Australia, New Zealand, Singapore, etc.
Imagine having a chart shaped like either of these…


 The cost for paying all those salaries for one month: about $400 billion. We could have reopened the country a month later with confidence. It has been estimated that we’ve spent over $16 trillion so far, and a full reopening is still months away at best.
Water under the bridge, of course. And maybe you’re one of the lucky ones who hasn’t yet been touched by COVID-19. Right now, one of every 34 Americans has an active case. One of every 13 people has been diagnosed. Former FDA Commissioner Scott Gottlieb said last month that about a third of Americans would ultimately be diagnosed. That was before the new, much more contagious strain was discovered.
Wouldn’t it be nice if we had taken it more seriously? Our current estimates call for over 450,000 deaths by the end of January and 500,000 by the end of February – at which point total cases should be around 30,000,000. Both might have already peaked; but, it will take a while for vaccines to get to market and for enough people to get vaccinated to make a difference.
Elsewhere in the world, things will unfortunately continue to get worse – especially for countries without the money and the healthcare infrastructure to stop the spread.
I’ll remove this “sticky” post from the front page for the time being. Coverage of the pandemic is very extensive now and there are many sources for great information. I’m praying there will be no need to return it to a place of any prominence.
UPDATE: October 20, 2020
The cost for paying all those salaries for one month: about $400 billion. We could have reopened the country a month later with confidence. It has been estimated that we’ve spent over $16 trillion so far, and a full reopening is still months away at best.
Water under the bridge, of course. And maybe you’re one of the lucky ones who hasn’t yet been touched by COVID-19. Right now, one of every 34 Americans has an active case. One of every 13 people has been diagnosed. Former FDA Commissioner Scott Gottlieb said last month that about a third of Americans would ultimately be diagnosed. That was before the new, much more contagious strain was discovered.
Wouldn’t it be nice if we had taken it more seriously? Our current estimates call for over 450,000 deaths by the end of January and 500,000 by the end of February – at which point total cases should be around 30,000,000. Both might have already peaked; but, it will take a while for vaccines to get to market and for enough people to get vaccinated to make a difference.
Elsewhere in the world, things will unfortunately continue to get worse – especially for countries without the money and the healthcare infrastructure to stop the spread.
I’ll remove this “sticky” post from the front page for the time being. Coverage of the pandemic is very extensive now and there are many sources for great information. I’m praying there will be no need to return it to a place of any prominence.
UPDATE: October 20, 2020
Herd Immunity: Doing the Math
In June, we observed that the US had embarked on a herd immunity approach to dealing with the COVID-19 pandemic.With little public discussion or debate, the US has embarked on a herd immunity approach to the coronavirus. No one’s really describing it as such, but the label is accurate just the same. Over the past month, scores of politicians and business leaders have declared (from the safety of their home offices) that “getting back to work” is more important than saving the maximum number of lives from COVID-19… Bottom line, the decision to reopen the country was made out of political and economic desperation with suspect motives and dubious scientific backing. While the strategy was purportedly for the benefit of the American worker, it is those very same workers who will end up paying the price.It was a provocative thing to say at the time, and I received a fair amount of blowback, most of it along the lines of “you’re exaggerating” or “not even Trump would do something like that.” At this point, it is patently obvious that the Trump administration has embraced herd immunity despite the enormous loss of life it would entail. Let’s do the math. Most advocates admit that herd immunity would require 60-70% of a country’s residents to become infected before protection would be afforded to the general population. In the United States, this would mean between 199-232M people becoming infected. We’ll go with the average of 215M. Compare this to the total known positive cases of about 8.5M and the likely 35M who have already been infected but not diagnosed, and the implication is that another 180M would have to be infected. The death rate has obviously fallen greatly over the past few months as those infected have tended to be younger and healthier and more effective therapeutics have been developed. But, it still hovers around 2.7% of diagnosed cases and 0.6% of probable cases. Applied to 180M infected, this would mean total deaths exceeding 1.1M. Unacceptable. The number of cases diagnosed each day is increasing at an increasing rate (i.e exponentially.) The 3-day moving average of new daily cases a month ago was 43,253. Today, it reached 58,133. A month from now it will reach 175,000 new cases and by the end of the year it will total well over 250,000 each and every day. The current 8.5M diagnosed will have grown to over 20M. Deaths now stand at 226,000. Daily deaths, which averaged less than 300 in June, are now topping 1,000 again and will reach 2,000 per day within the next month. By the end of the year, we will see over 310,000 total dead – more than were lost in The Gulf War, Spanish-American War, Iraq-Afghanistan, Mexican War, War of 1812, Revolutionary War, Korea, Vietnam and World War I put together. Sometime in February, total deaths will exceed the 405,000 lost in World War II. I know what you’re thinking. What about a vaccine? While it’s true that several companies are making excellent progress, it will be well into 2021 before any vaccine is widely available. It will be too late for the hundreds of thousands who will die needlessly between now and then. At 1 of every 10 Americans infected and 1 of every 740 Americans dead, it will be unusual not to know many who were sick and a few who died. It’s hard to talk about COVID-19 without talking about politics these days. Two days ago, new White House coronavirus advisor Dr. Scott Atlas tweeted that masks were not effective. It’s an opinion counter to that of the vast majority of scientists and doctors – including more than 100 of Atlas’ former colleagues at Stanford Medical School. President Trump’s rallies are testament to the disregard he has displayed for masks and social distancing. “It’s the last two weeks. Fuck it,” one Trump adviser said. People are indeed tired of the coronavirus – including masks, social distancing, remote learning, closed businesses, restaurants and stores, unemployment and staycationing. It’s getting old, it’s harming the economy, and it’s taking a toll on physical and mental health. But, for most of us, it beats dying. Even if you’re willing to take chances with your own life, it still beats killing grandma. In 1970 a Stanford psychologist studied the effect of delayed gratification by offering children a marshmallow. If they were able to abstain from eating it until he returned in 15 minutes, they were promised a second marshmallow. The study found that those who were able to delay gratification tended to have better life outcomes such as higher SAT scores and fewer behavioral problems. Though the study has been criticized over the years, its conclusion is worth taking to heart. It’s tempting to follow the advice of those “experts” and political “leaders” who insist we can ignore the risks and get back to normal life right now. It would be great. But, it would result in millions more sickened and hundreds of thousands dead. By taking modest precautions, exercising patience and delaying gratification, we can do better. Let’s not fail the marshmallow test. UPDATE: September 2, 2020 This is an excellent summary of where we are and why. More importantly, it offers simple, clear solutions to America’s coronavirus disaster. Reprinted from The New Yorker, September 2, 2020. We Can Solve the Coronavirus-Test Mess Now – If We Want To by: Atul Gawande
To get out of this pandemic, we need fast, easy coronavirus testing that’s accessible to everyone. From the way people often talk, you might think we need a technological breakthrough to achieve this. In fact, we don’t have a technological problem; we’ve got an implementation problem. We could have the testing capacity we need within weeks. The reason we don’t is not simply that our national leadership is unfit but also that our health-care system is dysfunctional.
Many developed countries have met their testing needs, and ready access to speedy tests has been key to containing outbreaks and resuming social and economic activity. Whether you live in England or South Korea, scheduling is straightforward. No doctor’s order is required. Tests, where indicated, are free. And you typically get results within forty-eight hours. UPDATE: June 17, 2020
On March 12, our local school district closed its doors after a fifth presumed case of coronavirus was detected in our Boston suburb of 28,000. At the time, 108 total cases had been identified in Massachusetts. No deaths had yet occurred. The US totals were 1,630 cases and 41 deaths (31 of which had occurred in Washington.) Within the next week, most Massachusetts businesses and schools had been shut down.
Three months later, Massachusetts has reached 105,885 cases and 7,665 deaths. We see another 300-500 new cases and 40-50 new deaths every day. US cases are increasing at a rate of 20-25,000 per day and total over 1,225,000 – more than the next 4 countries on the list combined. About 1,000 lives are lost every day for a total of 120,000.
UPDATE: June 17, 2020
On March 12, our local school district closed its doors after a fifth presumed case of coronavirus was detected in our Boston suburb of 28,000. At the time, 108 total cases had been identified in Massachusetts. No deaths had yet occurred. The US totals were 1,630 cases and 41 deaths (31 of which had occurred in Washington.) Within the next week, most Massachusetts businesses and schools had been shut down.
Three months later, Massachusetts has reached 105,885 cases and 7,665 deaths. We see another 300-500 new cases and 40-50 new deaths every day. US cases are increasing at a rate of 20-25,000 per day and total over 1,225,000 – more than the next 4 countries on the list combined. About 1,000 lives are lost every day for a total of 120,000.
 Three months later, most businesses have reopened in Massachusetts and around the country. Wearing masks is passé, especially if you’re under 50 or a Republican. The administration insists there won’t be a second wave – that it’s just the media trying to scare people (but, sign a waiver if you’re attending one of their rallies, just in case.)
If 1,630 cases and 41 deaths were enough to essentially close down the entire country, why are the politicians and titans of finance so excited about opening it up with 1,225,000 cases and 120,000 deaths?
UPDATE: June 12, 2020
With little public discussion or debate, the US has embarked on a herd immunity approach to the coronavirus. No one’s really describing it as such, but the label is accurate just the same. Over the past month, scores of politicians and business leaders have declared (from the safety of their home offices) that “getting back to work” is more important than saving the maximum number of lives from COVID-19.
Three months later, most businesses have reopened in Massachusetts and around the country. Wearing masks is passé, especially if you’re under 50 or a Republican. The administration insists there won’t be a second wave – that it’s just the media trying to scare people (but, sign a waiver if you’re attending one of their rallies, just in case.)
If 1,630 cases and 41 deaths were enough to essentially close down the entire country, why are the politicians and titans of finance so excited about opening it up with 1,225,000 cases and 120,000 deaths?
UPDATE: June 12, 2020
With little public discussion or debate, the US has embarked on a herd immunity approach to the coronavirus. No one’s really describing it as such, but the label is accurate just the same. Over the past month, scores of politicians and business leaders have declared (from the safety of their home offices) that “getting back to work” is more important than saving the maximum number of lives from COVID-19.
 “We cannot let the cure be worse than the problem itself” tweeted President Trump. Before long, supporters appeared in statehouses across the country, sometimes toting weapons and often without masks or social distancing, protesting states’ shutdown orders and demanding their right to return to work, frequent their favorite restaurant, or host a pool party.
How most of us feel about this probably depends on their health, wealth or politics. Some consider reopening the country an economic and civil rights imperative that justifies the risk. While others, particularly those in front line jobs who can’t obtain or live on unemployment insurance, have little choice but to return to work, regardless of the risks involved. Many health care workers who have lived through the hell of a local outbreak are alarmed.
As one governor after another caved to the protestors and economic pressures, the nation held its breath. Would there be a resurgence in cases? Would areas which hadn’t previously experienced serious outbreaks be affected?
Now that all 50 states have reopened to at least some extent, the answer is clear: there has been a resurgence of cases, particularly in those states that took fewer precautions in the early days of the pandemic, closed down late, or opened up early.
“We cannot let the cure be worse than the problem itself” tweeted President Trump. Before long, supporters appeared in statehouses across the country, sometimes toting weapons and often without masks or social distancing, protesting states’ shutdown orders and demanding their right to return to work, frequent their favorite restaurant, or host a pool party.
How most of us feel about this probably depends on their health, wealth or politics. Some consider reopening the country an economic and civil rights imperative that justifies the risk. While others, particularly those in front line jobs who can’t obtain or live on unemployment insurance, have little choice but to return to work, regardless of the risks involved. Many health care workers who have lived through the hell of a local outbreak are alarmed.
As one governor after another caved to the protestors and economic pressures, the nation held its breath. Would there be a resurgence in cases? Would areas which hadn’t previously experienced serious outbreaks be affected?
Now that all 50 states have reopened to at least some extent, the answer is clear: there has been a resurgence of cases, particularly in those states that took fewer precautions in the early days of the pandemic, closed down late, or opened up early. Some states such as Washington, Vermont and Alaska, which had early success in limiting spread, are now seeing a resurgence. Others such as North Carolina, California, Texas and Arizona, which had been relatively unaffected a month or two ago, are now seeing rapid growth and new highs in cases.


 The implicit bet being placed is that Americans, with more money in their pockets, will ignore the rising infections and deaths in their midst.
If the numbers become too alarming, the blame can be placed on Black Lives Matter protesters instead of those protesting to reopen the country or attending political rallies.
The implicit bet being placed is that Americans, with more money in their pockets, will ignore the rising infections and deaths in their midst.
If the numbers become too alarming, the blame can be placed on Black Lives Matter protesters instead of those protesting to reopen the country or attending political rallies.
Sweden’s chief epidemiologist Anders Tegnell recently admitted that “there [was] potential for improvement in [Sweden’s herd immunity approach], quite clearly.” Asked if the country’s high death toll has made him reconsider having attempted herd immunity, Tegnell replied, “Yes, absolutely.” Looking at the continuing climb in Sweden’s new cases, it’s not hard to see why…
 …particularly when compared to its Scandinavian neighbors.

 Two days later, I watched incredulously as she was handed a swab and told to collect her own specimen by sticking it an inch or so into her nose.
Based on what I had seen, a proper nasopharyngeal specimen requires inserting the swab several inches into someone’s nose, so far back that it reaches the back of their throat. If a person isn’t very uncomfortable, it hasn’t been done correctly.
Her results were negative but, given that the specimen wasn’t collected properly, I assumed that she could easily be one of the 30% of those who were given false negative results. It’s now a month later, and for better or worse, I’m finally beginning to believe the test results.
But, there are two important takeaways from our experience. First, the US has utterly failed in its efforts thus far. By March 8, it had conducted a total of 1,707 tests. By contrast, Italy and South Korea had each tested hundreds of thousands.
Given that up to 50-60% of all infections are asymptomatic, how many of the current 1,350,000 known cases (1,035,000 of which are still active), 166,000 of whom were hospitalized and 80,000 of whom died could have been spared had widespread testing and contract tracing been more widely available?
My daughter had a persistent cough and arrived from a country with the second highest number of infections in the world, yet no one even jotted her name down for follow up. Nor was she able to get tested until 34 days later – 36 days after Trump insisted tests were available to anybody who wanted one.
The day she returned home, China led the world with 80,735 reported cases. Italy and South Korea were in a close race for second and the US was far behind. Two months later, the US is very far ahead of the others on both an absolute and relative basis. According to experts, US cases could be 10-20 times greater as the shortage of available testing has contributed to a significant undercount.
Two days later, I watched incredulously as she was handed a swab and told to collect her own specimen by sticking it an inch or so into her nose.
Based on what I had seen, a proper nasopharyngeal specimen requires inserting the swab several inches into someone’s nose, so far back that it reaches the back of their throat. If a person isn’t very uncomfortable, it hasn’t been done correctly.
Her results were negative but, given that the specimen wasn’t collected properly, I assumed that she could easily be one of the 30% of those who were given false negative results. It’s now a month later, and for better or worse, I’m finally beginning to believe the test results.
But, there are two important takeaways from our experience. First, the US has utterly failed in its efforts thus far. By March 8, it had conducted a total of 1,707 tests. By contrast, Italy and South Korea had each tested hundreds of thousands.
Given that up to 50-60% of all infections are asymptomatic, how many of the current 1,350,000 known cases (1,035,000 of which are still active), 166,000 of whom were hospitalized and 80,000 of whom died could have been spared had widespread testing and contract tracing been more widely available?
My daughter had a persistent cough and arrived from a country with the second highest number of infections in the world, yet no one even jotted her name down for follow up. Nor was she able to get tested until 34 days later – 36 days after Trump insisted tests were available to anybody who wanted one.
The day she returned home, China led the world with 80,735 reported cases. Italy and South Korea were in a close race for second and the US was far behind. Two months later, the US is very far ahead of the others on both an absolute and relative basis. According to experts, US cases could be 10-20 times greater as the shortage of available testing has contributed to a significant undercount.
 Likewise, deaths in the US have multiplied much more rapidly than in Italy or South Korea.
 On both an absolute and population-weighted basis, South Korea’s aggressive testing, tracking, and quarantining measures have made a huge difference with 212 cases and 5 deaths respectively per million citizens. There have been many days over the past two weeks when South Korea reported no new cases and no new deaths.


 There is some good news related to flattening the curve. The daily rate of growth in US cases and deaths continues to slow. The 10-day moving average is about 2.5% for cases and 3% for deaths. At this rate, cases will reach 1,500,000 around May 14 and deaths will reach 100,000 around May 18.
Global cases should reach the 5 million milestone by May 20 and deaths should reach 300,000 by May 14. Of course, the progression of global cases will depend largely on the US’ success or lack thereof in reopening the country.
Much has been discussed about the tradeoffs between saving the economy and saving lives. I’m neither a philosopher nor a religious scholar, so I won’t wade into the moral argument. I am troubled, however, by much of what I hear on the economic front.
To a family struggling to buy groceries or pay the rent, reopening the country is a matter of necessity rather than choice. Through no fault of their own, they must bear the economic brunt of their government’s failure to act in a timely manner to forestall the epidemic.
For many, working from home is not an option and buying groceries means exposing oneself and one’s family to serious illness and death. One particular story caught my eye this past week.
There is some good news related to flattening the curve. The daily rate of growth in US cases and deaths continues to slow. The 10-day moving average is about 2.5% for cases and 3% for deaths. At this rate, cases will reach 1,500,000 around May 14 and deaths will reach 100,000 around May 18.
Global cases should reach the 5 million milestone by May 20 and deaths should reach 300,000 by May 14. Of course, the progression of global cases will depend largely on the US’ success or lack thereof in reopening the country.
Much has been discussed about the tradeoffs between saving the economy and saving lives. I’m neither a philosopher nor a religious scholar, so I won’t wade into the moral argument. I am troubled, however, by much of what I hear on the economic front.
To a family struggling to buy groceries or pay the rent, reopening the country is a matter of necessity rather than choice. Through no fault of their own, they must bear the economic brunt of their government’s failure to act in a timely manner to forestall the epidemic.
For many, working from home is not an option and buying groceries means exposing oneself and one’s family to serious illness and death. One particular story caught my eye this past week.
 Sixty-four year-old Rafael Benjamin worked at a Cargill meat-processing plant in Pennsylvania. Many of his coworkers were falling ill, so on March 25 a daughter gave him a face mask to wear at work. Two days later, a supervisor ordered him to remove it as it made other plant employees nervous. On April 4, Rafael called in sick. The following day, unable to move, he was taken by ambulance to the hospital. He died on April 19.
On April 24, President Trump classified meat plants as critical infrastructure, preventing local and state health authorities from closing them down regardless of health concerns. The business community is working with the White House and Congress to protect companies like Cargill from customer and employee lawsuits related to coronavirus.
If passed, such legislation would allow bad actors to pressure workers to report to work regardless of their health conditions and without providing common sense safeguards. Because it would ultimately result in more illness and death, it would ironically apply additional economic pressures on the very companies seeking liability protection.
Another industry singled out for special treatment is the oil industry. If the White House and Congress were primarily concerned with unemployment in the sector, they could more vigorously subsidize payrolls instead of artificially driving the price of oil and gas higher. First, artificial price support will do nothing to correct the imbalance between supply and demand. Second, higher fuel prices are a regressive tax on those who can least afford them.
As a disciple of the Cynical School of Economic Thought, I find the entreaties by many major corporations and billionaires (most of which have cheap, ready access to capital markets) to reopen the country now to be self-serving — focused more on inflating excessive equity valuations than ensuring full employment and economic well-being for society’s most vulnerable.
Perhaps quantitative easing and financial engineering have become so effective that the economic well-being of ordinary citizens is no longer relevant. Things certainly seem to be headed in that direction.
UPDATE: Apr 17, 2020
Word on the street is that the remdesivir story was planted by a rumor-for-hire outfit and that the drug has failed in previous trials in China. Gilead has since walked back the hype.
The other COVID-19 story to hit the wires this morning is that Moderna received $483 million from the government to fast track its vaccine efforts. It’s great news, as is all the other vaccine research going on at an unprecedented pace. In listening to the CEO’s interview, however, it’s obvious that this, like every other vaccine being developed, won’t be widely available until 2021.
I’m as hopeful as anyone else. But, in the absence of a therapeutic or vaccine, I believe opening the country back up will absolutely result in a resurgence of community transmission and a sharp rise in the number of deaths – particularly in those parts of the country which have yet to be affected in great numbers.
The problem continues to be testing. If all of us pack in to a basketball game or concert and even one of us is infected, many of us will become infected. We’ll then head home and infect our loved ones and go in to the office and infect our coworkers. Since 25-50% of infected people have little or no symptoms, there is absolutely no way to prevent this from happening unless we get a vaccine.
In the US, only 13% of the 680,000 diagnosed cases have been closed – meaning either a person got better or died. Of those which were closed, nearly 40% resulted in someone dying – 34,700 of them.
Sixty-four year-old Rafael Benjamin worked at a Cargill meat-processing plant in Pennsylvania. Many of his coworkers were falling ill, so on March 25 a daughter gave him a face mask to wear at work. Two days later, a supervisor ordered him to remove it as it made other plant employees nervous. On April 4, Rafael called in sick. The following day, unable to move, he was taken by ambulance to the hospital. He died on April 19.
On April 24, President Trump classified meat plants as critical infrastructure, preventing local and state health authorities from closing them down regardless of health concerns. The business community is working with the White House and Congress to protect companies like Cargill from customer and employee lawsuits related to coronavirus.
If passed, such legislation would allow bad actors to pressure workers to report to work regardless of their health conditions and without providing common sense safeguards. Because it would ultimately result in more illness and death, it would ironically apply additional economic pressures on the very companies seeking liability protection.
Another industry singled out for special treatment is the oil industry. If the White House and Congress were primarily concerned with unemployment in the sector, they could more vigorously subsidize payrolls instead of artificially driving the price of oil and gas higher. First, artificial price support will do nothing to correct the imbalance between supply and demand. Second, higher fuel prices are a regressive tax on those who can least afford them.
As a disciple of the Cynical School of Economic Thought, I find the entreaties by many major corporations and billionaires (most of which have cheap, ready access to capital markets) to reopen the country now to be self-serving — focused more on inflating excessive equity valuations than ensuring full employment and economic well-being for society’s most vulnerable.
Perhaps quantitative easing and financial engineering have become so effective that the economic well-being of ordinary citizens is no longer relevant. Things certainly seem to be headed in that direction.
UPDATE: Apr 17, 2020
Word on the street is that the remdesivir story was planted by a rumor-for-hire outfit and that the drug has failed in previous trials in China. Gilead has since walked back the hype.
The other COVID-19 story to hit the wires this morning is that Moderna received $483 million from the government to fast track its vaccine efforts. It’s great news, as is all the other vaccine research going on at an unprecedented pace. In listening to the CEO’s interview, however, it’s obvious that this, like every other vaccine being developed, won’t be widely available until 2021.
I’m as hopeful as anyone else. But, in the absence of a therapeutic or vaccine, I believe opening the country back up will absolutely result in a resurgence of community transmission and a sharp rise in the number of deaths – particularly in those parts of the country which have yet to be affected in great numbers.
The problem continues to be testing. If all of us pack in to a basketball game or concert and even one of us is infected, many of us will become infected. We’ll then head home and infect our loved ones and go in to the office and infect our coworkers. Since 25-50% of infected people have little or no symptoms, there is absolutely no way to prevent this from happening unless we get a vaccine.
In the US, only 13% of the 680,000 diagnosed cases have been closed – meaning either a person got better or died. Of those which were closed, nearly 40% resulted in someone dying – 34,700 of them. The chart below shows that the death rate (the orange line) has remained very steady since March 26, bouncing back and forth between 35% and 43%. This is not progress, and it hardly argues for easing up on efforts to prevent community transmission.
 The US remains in 44th place in the world in testing per 1mm people. The chart below, sorted by tests per 1mm, shows some of the countries which have done much more. Not a great argument for opening up the country. The raw number of tests, BTW, is irrelevant.
  In total cases per 1mm population, the US is in 20th place…
 …while in deaths per 1mm, the US is in 14th place. Again, not a great argument for opening up the country.
  We have had periodic declines in new deaths and cases and the rate of growth in each has definitely subsided. But, both are still occurring at an alarming rate.
 If the proportions hold, 1,500 of the 30,000 people diagnosed today will die — and that’s without opening up the country.
Compare the data to a country such as Germany, which imposed a stronger quarantine much earlier than the US. Sixty-two percent of all diagnosed cases have been closed, and deaths account for a mere 4% of those. Remember, the US is running about 40%.
If the proportions hold, 1,500 of the 30,000 people diagnosed today will die — and that’s without opening up the country.
Compare the data to a country such as Germany, which imposed a stronger quarantine much earlier than the US. Sixty-two percent of all diagnosed cases have been closed, and deaths account for a mere 4% of those. Remember, the US is running about 40%.
 Even though active cases have clearly rolled over…
  …Germany is still seeing 3,000 new cases per day…
  …and deaths are still ticking higher.
 By comparison, the number of active cases in the US is beginning to flatten, but is far from rolling over.
 The most frightening report I’ve seen in the past week was this one from the UN which reveals that 74 million people in the Arab region lack access to a basic handwashing facility (i.e. clean running water.) It’s safe to say that most of those 74 million also don’t have a bottle of Purell handy.
Consider the 1.2 billion people in Africa who have been so susceptible to past epidemics which were much easier to detect. The 2013-2016 Ebola outbreak in West Africa infected 28,646 and killed 11,323. Almost 20,000 cases of COVID-19 have been detected so far, and it’s still early days.
I give President Trump’s political advisors credit for convincing him to give governors the responsibility for deciding when/how to reopen their states. Those who are aggressive about it will pay the price, while those who don’t reopen things quickly will continue to pay an enormous financial price. Without widespread testing and an effective therapeutic/vaccine very soon, there will be no happy ending for either.
UPDATE: Apr 13, 2020
I’ll start with the bad news, just to change things up. The US now has almost 600,000 cases, 1 out of every 587 people and almost as many as the next 4 countries combined. Deaths, now 3.9% of all diagnosed cases, total over 23,000. Sadly, 40% of all closed cases result in someone dying.
The most frightening report I’ve seen in the past week was this one from the UN which reveals that 74 million people in the Arab region lack access to a basic handwashing facility (i.e. clean running water.) It’s safe to say that most of those 74 million also don’t have a bottle of Purell handy.
Consider the 1.2 billion people in Africa who have been so susceptible to past epidemics which were much easier to detect. The 2013-2016 Ebola outbreak in West Africa infected 28,646 and killed 11,323. Almost 20,000 cases of COVID-19 have been detected so far, and it’s still early days.
I give President Trump’s political advisors credit for convincing him to give governors the responsibility for deciding when/how to reopen their states. Those who are aggressive about it will pay the price, while those who don’t reopen things quickly will continue to pay an enormous financial price. Without widespread testing and an effective therapeutic/vaccine very soon, there will be no happy ending for either.
UPDATE: Apr 13, 2020
I’ll start with the bad news, just to change things up. The US now has almost 600,000 cases, 1 out of every 587 people and almost as many as the next 4 countries combined. Deaths, now 3.9% of all diagnosed cases, total over 23,000. Sadly, 40% of all closed cases result in someone dying.
 Fatal outcomes now account for 4% of all diagnosed cases. Another way of looking at it: for every 100 people who have been diagnosed, 90 are still sick. Of the remaining ten, 6 recovered and 4 died. Were these percentages to hold, we might expect the 26,641 new cases diagnosed just today to result in 1,065 deaths.
 But, since deaths lag new diagnoses, it would be 4% of a larger number. And, since the mortality rate is climbing every day (it was 1.2% on March 22) it would probably be a larger percentage of a larger number of people. If one of those were a friend or relative, you’d might disagree with opening up the country just yet – regardless of the trends.
Many countries have had much better outcomes, such as Switzerland where deaths are only 7% of closed cases and testing has been conducted on 22,993 per million citizens versus 8,816 per million (43rd in the world) in the US. Even Italy, to which the US is often compared, has tested 17,315 per million.
Now, for the good news. The daily rate of growth (ROG) in cases has slowed significantly – presumably as a result of quarantining (aka social distancing.) The 10-day moving average for case growth has slowed from 15% a week ago to about 10%. The 10-day moving average for the daily ROG in deaths has slowed from 22% to about 14%.
But, since deaths lag new diagnoses, it would be 4% of a larger number. And, since the mortality rate is climbing every day (it was 1.2% on March 22) it would probably be a larger percentage of a larger number of people. If one of those were a friend or relative, you’d might disagree with opening up the country just yet – regardless of the trends.
Many countries have had much better outcomes, such as Switzerland where deaths are only 7% of closed cases and testing has been conducted on 22,993 per million citizens versus 8,816 per million (43rd in the world) in the US. Even Italy, to which the US is often compared, has tested 17,315 per million.
Now, for the good news. The daily rate of growth (ROG) in cases has slowed significantly – presumably as a result of quarantining (aka social distancing.) The 10-day moving average for case growth has slowed from 15% a week ago to about 10%. The 10-day moving average for the daily ROG in deaths has slowed from 22% to about 14%.
 More testing and continued quarantining should continue to bring the growth rates down. Opening up the country without more testing, however, will only serve to increase them. At a ROG of 14%, deaths will reach 100,000 by April 24. Slowing the rate to 10% (i.e. flattening the curve) would delay that milestone to Apr 28 and to 5% would delay it to May 13. This would buy scientists more time to come up with effective therapeutics.
Getting tested? It’s easier now but, based on my experience, not very accurate. I took my daughter (who returned from Italy with a bad cough) to a drive-through testing site run by CVS. It was fast and free, but they handed my daughter the swab and asked her to collect her own specimen.
She inserted the swab about 1 – 1.5 inches into each nostril, at which point the tech said “good job” and put the sample into a bag for assessment. This was completely inadequate and is probably responsible for the 30%+ false negative results being obtained.
An accurate nasopharyngeal specimen collection means sticking the swab so far back that most people would gag and tear up in the process. Here’s a video of the correct process. Bottom line, don’t assume that a negative test is correct. Continue to exercise caution – particularly if someone is exhibiting symptoms.
More testing and continued quarantining should continue to bring the growth rates down. Opening up the country without more testing, however, will only serve to increase them. At a ROG of 14%, deaths will reach 100,000 by April 24. Slowing the rate to 10% (i.e. flattening the curve) would delay that milestone to Apr 28 and to 5% would delay it to May 13. This would buy scientists more time to come up with effective therapeutics.
Getting tested? It’s easier now but, based on my experience, not very accurate. I took my daughter (who returned from Italy with a bad cough) to a drive-through testing site run by CVS. It was fast and free, but they handed my daughter the swab and asked her to collect her own specimen.
She inserted the swab about 1 – 1.5 inches into each nostril, at which point the tech said “good job” and put the sample into a bag for assessment. This was completely inadequate and is probably responsible for the 30%+ false negative results being obtained.
An accurate nasopharyngeal specimen collection means sticking the swab so far back that most people would gag and tear up in the process. Here’s a video of the correct process. Bottom line, don’t assume that a negative test is correct. Continue to exercise caution – particularly if someone is exhibiting symptoms.
 And, even if some politician gives you the all clear, remember that nearly 30,000 new cases will be diagnosed today. Don’t be one of them.
UPDATE: April 3, 2020
Out of curiosity, I took a look at mortality rate trends in a few other countries. While some are clearly better than others, every single one is rising consistently over the past week.
And, even if some politician gives you the all clear, remember that nearly 30,000 new cases will be diagnosed today. Don’t be one of them.
UPDATE: April 3, 2020
Out of curiosity, I took a look at mortality rate trends in a few other countries. While some are clearly better than others, every single one is rising consistently over the past week.
 And, deaths are consistently rising faster than cases. Cases have risen an average of 2x over the past week, while deaths have risen an average of 3.4x. In the US, the numbers are 2.9x and 4.7x – a ratio of 1.64 deaths per every new case diagnosed. In Germany, deaths are rising over twice as fast as cases.
I have very little medical training, but I believe this is why we’re hearing so much about flattening the curve. The experts know that our hospitals will be overwhelmed if the ROG doesn’t slow dramatically. Overwhelmed hospitals and shortages of ICU beds and ventilators will translate into higher mortality rates.
In some cases, however, the higher mortality rate can be attributed to a drop in the rate of growth in new cases. Due to the lag between diagnosis and death, case growth can roll over as deaths are still rising. A good example is Austria. New cases peaked on March 26 while deaths peaked on March 30.
And, deaths are consistently rising faster than cases. Cases have risen an average of 2x over the past week, while deaths have risen an average of 3.4x. In the US, the numbers are 2.9x and 4.7x – a ratio of 1.64 deaths per every new case diagnosed. In Germany, deaths are rising over twice as fast as cases.
I have very little medical training, but I believe this is why we’re hearing so much about flattening the curve. The experts know that our hospitals will be overwhelmed if the ROG doesn’t slow dramatically. Overwhelmed hospitals and shortages of ICU beds and ventilators will translate into higher mortality rates.
In some cases, however, the higher mortality rate can be attributed to a drop in the rate of growth in new cases. Due to the lag between diagnosis and death, case growth can roll over as deaths are still rising. A good example is Austria. New cases peaked on March 26 while deaths peaked on March 30.

 This has allowed its mortality rate to almost flatten: from 1.3% on March 31 to only 1.5% on April 3. And, its curve is definitely flattening. Note that Austria enacted nationwide restrictions on travel and gatherings on March 16 when there were 1,018 total cases and 3 deaths. This was 18 days after the first community transmission case was detected and two days after the first death.
 The US, by contrast, has still not enacted a nationwide lockdown despite over 300,000 cases and 8,000 deaths since the virus arrived over two months ago on January 20.
 The 10-day moving average of the daily rate of growth in deaths in the US dipped slightly to 27.3%. But at this rate we would still reach 10,000 deaths this weekend, 100,000 by April 14, and 1 million by April 24.
  Some might feel this rate is too pessimistic, that something will happen to change the trajectory. I hope so. But, even if the rate were to plunge to 20%, we would still have over 1 million deaths before the end of April – one in every 323 people in the US. And, remember, this number is understated – though not as dramatically as the number of cases.
Don’t wait for the government to tell you what we already know: the only way to be completely safe is to stay at home, away from anyone who might be infected (including asymptomatic family members) and to wear a mask if you absolutely must go out – especially around other people. Assume that everything you touch might harbor the virus.
Yes, you might feel like you look really paranoid. But, your family will thank you. And, God willing, you can all laugh about it some day.
For those staying in this weekend, I just read that HBO is releasing 500 hours of programming for free, including every including every episode of The Sopranos, Veep, The Wire, Barry and Ballers. You can download the HBO NOW or HBO GO apps or visit HBONOW.com or HBOGO.com. #StayHomeBoxOffice.
Stay safe everyone.
UPDATE: March 31, 2020
Italy’s mortality rate continues climbing steadily: from 2.0% on March 1 to 11.4% as of March 30. I never see this data reported anywhere, but believe it’s very important as it confirms what should be obvious: An overwhelmed health system is not as effective in saving the lives of sick COVID-19 patients.
Those in the US who take comfort in its current 2% mortality rate probably shouldn’t. Reported cases – still an understatement of actual cases due to the continuing shortage of test kits – continue to increase at an average (10-day SMA) of 24% per day. But, deaths are climbing at about 30% per day – much faster in some states. Inexplicably, many states have yet to issue stay-at-home orders.
Some might feel this rate is too pessimistic, that something will happen to change the trajectory. I hope so. But, even if the rate were to plunge to 20%, we would still have over 1 million deaths before the end of April – one in every 323 people in the US. And, remember, this number is understated – though not as dramatically as the number of cases.
Don’t wait for the government to tell you what we already know: the only way to be completely safe is to stay at home, away from anyone who might be infected (including asymptomatic family members) and to wear a mask if you absolutely must go out – especially around other people. Assume that everything you touch might harbor the virus.
Yes, you might feel like you look really paranoid. But, your family will thank you. And, God willing, you can all laugh about it some day.
For those staying in this weekend, I just read that HBO is releasing 500 hours of programming for free, including every including every episode of The Sopranos, Veep, The Wire, Barry and Ballers. You can download the HBO NOW or HBO GO apps or visit HBONOW.com or HBOGO.com. #StayHomeBoxOffice.
Stay safe everyone.
UPDATE: March 31, 2020
Italy’s mortality rate continues climbing steadily: from 2.0% on March 1 to 11.4% as of March 30. I never see this data reported anywhere, but believe it’s very important as it confirms what should be obvious: An overwhelmed health system is not as effective in saving the lives of sick COVID-19 patients.
Those in the US who take comfort in its current 2% mortality rate probably shouldn’t. Reported cases – still an understatement of actual cases due to the continuing shortage of test kits – continue to increase at an average (10-day SMA) of 24% per day. But, deaths are climbing at about 30% per day – much faster in some states. Inexplicably, many states have yet to issue stay-at-home orders.
 The top 25 states in terms of cases are shown below. Note that Louisiana, a relative newcomer to the top 10, is already at a mortality rate of 4.6% – topping Washington’s 4%. Virginia’s governor finally issued a stay-at-home order yesterday, as that state’s mortality rate reached 2.5%.
Several cities and counties in Georgia, which faces a 3.4% mortality rate, have issued orders; but, the governor has yet to announce a statewide order. Arizona’s governor, who had issued an order restricting the ability of cities and counties to issue their own orders without his approval, finally caved yesterday when cases topped 1,000.
The top 25 states in terms of cases are shown below. Note that Louisiana, a relative newcomer to the top 10, is already at a mortality rate of 4.6% – topping Washington’s 4%. Virginia’s governor finally issued a stay-at-home order yesterday, as that state’s mortality rate reached 2.5%.
Several cities and counties in Georgia, which faces a 3.4% mortality rate, have issued orders; but, the governor has yet to announce a statewide order. Arizona’s governor, who had issued an order restricting the ability of cities and counties to issue their own orders without his approval, finally caved yesterday when cases topped 1,000.
 As more hospitals across the nation are overwhelmed by cases that outnumber the available ICU beds and ventilators, the mortality rate is bound to rise. Those that restrict transmissions before cases get out of hand stand the best chance of not being overwhelmed. The rest will suffer the consequences. As Dr. Georges Benjamin, executive director of the American Public Health Association, said: “Waiting until you get a lot of cases is the wrong strategy.”
Currently, about 1/3 of closed cases – someone being either discharged or dying – result in a death. But, only 5% of total reported cases have been closed – again, a factor of the rapid growth in cases. In Italy, where 26% of all cases have been closed, deaths account for 44% of all closed cases and, as mentioned above, 11.4% of total cases.
Applying the same percentages to US cases would indicate that 2,313 of the 20,297 new cases reported just on March 30 will result in someone dying. At the current daily rate of increase, the US will reach 10,000 deaths by April 4 and 100,000 on or around Easter. My projections indicate total cases could reach 2.4 million by then, swamping the 924,000 beds in the 5,198 community hospitals across the nation.
If even 5% of those cases were serious/critical, the resulting 120,000 cases would far outnumber the 77,000 ICU beds in the US.
As more hospitals across the nation are overwhelmed by cases that outnumber the available ICU beds and ventilators, the mortality rate is bound to rise. Those that restrict transmissions before cases get out of hand stand the best chance of not being overwhelmed. The rest will suffer the consequences. As Dr. Georges Benjamin, executive director of the American Public Health Association, said: “Waiting until you get a lot of cases is the wrong strategy.”
Currently, about 1/3 of closed cases – someone being either discharged or dying – result in a death. But, only 5% of total reported cases have been closed – again, a factor of the rapid growth in cases. In Italy, where 26% of all cases have been closed, deaths account for 44% of all closed cases and, as mentioned above, 11.4% of total cases.
Applying the same percentages to US cases would indicate that 2,313 of the 20,297 new cases reported just on March 30 will result in someone dying. At the current daily rate of increase, the US will reach 10,000 deaths by April 4 and 100,000 on or around Easter. My projections indicate total cases could reach 2.4 million by then, swamping the 924,000 beds in the 5,198 community hospitals across the nation.
If even 5% of those cases were serious/critical, the resulting 120,000 cases would far outnumber the 77,000 ICU beds in the US.
 Bloomberg pubished an interesting article earlier today citing an Italian study that offered a theory as to why Italy’s mortality rate is so high. The study suggested that because Italy had such a mild winter, many of the deaths that might ordinarily have occurred due to flu were brought on instead by the coronavirus. The inference is that the mortality rate is much higher than it would otherwise be had the winter been colder.
While I certainly find the premise plausible, it doesn’t do much to move the needle. The study suggests that “the total number of older Italians spared death directly from the flu this season may have been in the hundreds, based on an annual average of 8,000 nationwide flu deaths cited in the paper.”
Italy has seen over 12,000 deaths. Subtracting 500, for instance, would lower its mortality rate from 11.4% a still very high 10.9%. Having had a daughter in Italy between late January and March 8, I followed the situation very closely. I think the high death rate is much more likely to have been the result of some bad luck (getting hit with the first burst of infections) and a failure to lock down the entire country.
Early on, several small towns in northern Italy were quarantined. Many who were able to simply left the area, returning to their homes in southern Italy or elsewhere in Europe. As cases spread, Milan was included in the quarantine. Again, this didn’t stop anyone from returning to their home. As I wrote at the time, 20,000 people were taking a train from Milan to Rome every day.
Eventually, the entire country was put on lockdown. But, by then, the spread had occurred and quickly overwhelmed the available hospital facilities. While cases increased 59X between Mar 1 and Mar 30, deaths increased 341X.
This is why I believe a nationwide lockdown is essential for the US. We all know someone who left a heavily infected area to go someplace “safe” such as a friend or relative’s house, a second home or just a hotel. Unfortunately, some of those people are infected and transmit the disease to people in the other location. It only takes a few to get the community spread ball rolling. This is precisely what happened in Europe.
True, there are some very efficient and tightly controlled countries in Europe with low mortality rates (so far) such as Switzerland (2.7%), Austria (1.4%) and Germany (1.1%). But, each of these took early, aggressive measures to limit the spread. Many other countries are slightly behind but on the same track as Italy: France (6.8%), Spain (8.9%), UK (7.8%), and Netherlands (8.6%.)
A March 30 study from Imperial College of London researchers draws a direct correlation between the number of deaths and the speed with which various countries took steps to intervene in the virus’ spread. All but one (Sweden) ultimately ordered a lockdown – typically as each country’s leaders realized they would not be spared.
Bloomberg pubished an interesting article earlier today citing an Italian study that offered a theory as to why Italy’s mortality rate is so high. The study suggested that because Italy had such a mild winter, many of the deaths that might ordinarily have occurred due to flu were brought on instead by the coronavirus. The inference is that the mortality rate is much higher than it would otherwise be had the winter been colder.
While I certainly find the premise plausible, it doesn’t do much to move the needle. The study suggests that “the total number of older Italians spared death directly from the flu this season may have been in the hundreds, based on an annual average of 8,000 nationwide flu deaths cited in the paper.”
Italy has seen over 12,000 deaths. Subtracting 500, for instance, would lower its mortality rate from 11.4% a still very high 10.9%. Having had a daughter in Italy between late January and March 8, I followed the situation very closely. I think the high death rate is much more likely to have been the result of some bad luck (getting hit with the first burst of infections) and a failure to lock down the entire country.
Early on, several small towns in northern Italy were quarantined. Many who were able to simply left the area, returning to their homes in southern Italy or elsewhere in Europe. As cases spread, Milan was included in the quarantine. Again, this didn’t stop anyone from returning to their home. As I wrote at the time, 20,000 people were taking a train from Milan to Rome every day.
Eventually, the entire country was put on lockdown. But, by then, the spread had occurred and quickly overwhelmed the available hospital facilities. While cases increased 59X between Mar 1 and Mar 30, deaths increased 341X.
This is why I believe a nationwide lockdown is essential for the US. We all know someone who left a heavily infected area to go someplace “safe” such as a friend or relative’s house, a second home or just a hotel. Unfortunately, some of those people are infected and transmit the disease to people in the other location. It only takes a few to get the community spread ball rolling. This is precisely what happened in Europe.
True, there are some very efficient and tightly controlled countries in Europe with low mortality rates (so far) such as Switzerland (2.7%), Austria (1.4%) and Germany (1.1%). But, each of these took early, aggressive measures to limit the spread. Many other countries are slightly behind but on the same track as Italy: France (6.8%), Spain (8.9%), UK (7.8%), and Netherlands (8.6%.)
A March 30 study from Imperial College of London researchers draws a direct correlation between the number of deaths and the speed with which various countries took steps to intervene in the virus’ spread. All but one (Sweden) ultimately ordered a lockdown – typically as each country’s leaders realized they would not be spared.
 While identifying and limiting the spread of US cases is incredibly important, note that I have focused mostly on the trend in deaths — which distills all the theories and practices into one defining, indisputable and depressing number every day. It’s where the rubber meets the road.
I printed a list of the top 25 states in terms of cases as of March 30 above. Mortality rates ranged from 0.5% to 4.6% with a median of 1.7% and a mean of 1.9%.
At the end of today, March 31, the range was from 1.1% to 4.6% with a median of 2.1% and a mean of 2.2%. While total deaths grew by 31% in that one 24-hour period, the average daily rate of increase among the 25 states was a stunning 47%.
While identifying and limiting the spread of US cases is incredibly important, note that I have focused mostly on the trend in deaths — which distills all the theories and practices into one defining, indisputable and depressing number every day. It’s where the rubber meets the road.
I printed a list of the top 25 states in terms of cases as of March 30 above. Mortality rates ranged from 0.5% to 4.6% with a median of 1.7% and a mean of 1.9%.
At the end of today, March 31, the range was from 1.1% to 4.6% with a median of 2.1% and a mean of 2.2%. While total deaths grew by 31% in that one 24-hour period, the average daily rate of increase among the 25 states was a stunning 47%.
 Note that the order of the top 25 has changed. Florida has moved into the #5 slot, Illinois has moved ahead of Washington to #7, Louisiana moved from #10 to #9, Georgia moved ahead of Texas to #11, etc. I’ll continue to track these same 25 so we can stay abreast of the trend.
The important thing to realize is that deaths continue to rise sharply. As in Europe, the growth has tended to accelerate faster in states which were late to start testing, close schools and businesses, and issue stay-at-home orders. Those that have not restricted movement should expect to see deaths continue to outpace those that have.
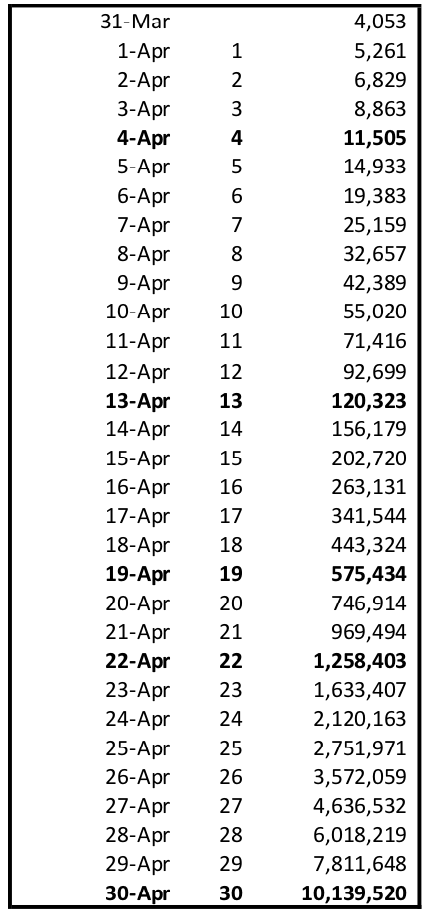
With a total of 4,053 deaths as we goes to press, rising at a 10-day moving average of 29.8% per day, total US deaths should reach 10,000 by Saturday April 4, 100,000 by April 13, 500,000 by April 19 and 1 million by April 22.
Note that the order of the top 25 has changed. Florida has moved into the #5 slot, Illinois has moved ahead of Washington to #7, Louisiana moved from #10 to #9, Georgia moved ahead of Texas to #11, etc. I’ll continue to track these same 25 so we can stay abreast of the trend.
The important thing to realize is that deaths continue to rise sharply. As in Europe, the growth has tended to accelerate faster in states which were late to start testing, close schools and businesses, and issue stay-at-home orders. Those that have not restricted movement should expect to see deaths continue to outpace those that have.
With a total of 4,053 deaths as we goes to press, rising at a 10-day moving average of 29.8% per day, total US deaths should reach 10,000 by Saturday April 4, 100,000 by April 13, 500,000 by April 19 and 1 million by April 22.
 I believe that this fate can be avoided only if: (a) everyone who should be tested is tested, (b) the entire nation is locked down, and (c) scientists can develop effective treatments in the next week or so. I hope to God I’m wrong.
A few reminders that I haven’t seen circulated nearly enough: Studies indicate that up to 50% of transmissions are from people who have little or no symptoms. Your kid or your neighbor who appears perfectly healthy can give you the virus.
And, studies now indicate that the coronavirus can remain aerosolized for up to three hours. You could be walking down a deserted aisle at the grocery store and stroll right through the viral mist emitted by someone who sneezed there 20 minutes ago. Wear a mask when out in public places and assume that everything you touch is infected.
I believe that this fate can be avoided only if: (a) everyone who should be tested is tested, (b) the entire nation is locked down, and (c) scientists can develop effective treatments in the next week or so. I hope to God I’m wrong.
A few reminders that I haven’t seen circulated nearly enough: Studies indicate that up to 50% of transmissions are from people who have little or no symptoms. Your kid or your neighbor who appears perfectly healthy can give you the virus.
And, studies now indicate that the coronavirus can remain aerosolized for up to three hours. You could be walking down a deserted aisle at the grocery store and stroll right through the viral mist emitted by someone who sneezed there 20 minutes ago. Wear a mask when out in public places and assume that everything you touch is infected.
* * *
UPDATE: March 22, 2020 Italy’s mortality rate increased to 9.3% on March 22, a steady increase from 2.0% on Mar 1. Though, on a positive note, the daily rate of growth in cases and deaths has ebbed somewhat: Neither has exceeded 20% since March 13. On a not so positive note, both are still doubling every 6-7 days. The daily ROG in US deaths ticked lower on March 20-21, but pushed back up to 39% on March 22. At this rate, the 419 US deaths as of March 22 would exceed 1,000 by March 25, 10,000 by April 1, and 100,000 by April 8. Take a moment and let those numbers sink in.
 Italy still has many active cases, 80% of the total. Fortunately, most are resolving as “recovered/discharged.” But, the 9.3% mortality rate – up from only 2% on March 1 – means that nearly as many die as are discharged/recovered.
 Only a very small fraction of US cases are closed. Unfortunately, about 73% of closed cases have resulted in death rather than recovery.
 This is up from 60% of cases just 4 days ago. Serious/critical cases as a percentage of active cases have more than quadrupled in that time. In other words, things are getting worse at an accelerating rate.
 I regret to report that our original models posted on March 13-14 have not kept up with the actual results. The model which used the then 10-DMAs of daily rates of growth for cases and deaths (34% and 18%) had forecast 23,410 cases and 247 deaths for March 22.
The model which borrowed the 10-DMA of Italy’s daily ROG with an 11-day lag had forecast 23,410 cases and 481 deaths.
As of last night, total acknowledged US cases totaled 33,546 (still undercounted) and deaths totaled 419.
I regret to report that our original models posted on March 13-14 have not kept up with the actual results. The model which used the then 10-DMAs of daily rates of growth for cases and deaths (34% and 18%) had forecast 23,410 cases and 247 deaths for March 22.
The model which borrowed the 10-DMA of Italy’s daily ROG with an 11-day lag had forecast 23,410 cases and 481 deaths.
As of last night, total acknowledged US cases totaled 33,546 (still undercounted) and deaths totaled 419.
* * *
UPDATE: Mar 17, 2020 For those interested, here is an update on the current case and death data for Italy and the US as of Mar 16. In Italy, the current mortality rate has ticked up even higher to 7.7%. The 10-day moving average for mortality rate has increased to 6.3%. The 10-DMA for the ROG in cases and deaths has eased slightly to 21% and 28%.| Italy | ||
| date | cases | deaths |
| 21-Feb | 21 | 1 |
| 22-Feb | 79 | 2 |
| 23-Feb | 152 | 2 |
| 24-Feb | 229 | 6 |
| 25-Feb | 322 | 11 |
| 26-Feb | 400 | 12 |
| 27-Feb | 655 | 17 |
| 28-Feb | 889 | 21 |
| 29-Feb | 1,128 | 29 |
| 1-Mar | 1,701 | 34 |
| 2-Mar | 2,036 | 52 |
| 3-Mar | 2,502 | 79 |
| 4-Mar | 3,089 | 107 |
| 5-Mar | 3,858 | 148 |
| 6-Mar | 4,636 | 197 |
| 7-Mar | 5,883 | 233 |
| 8-Mar | 7,375 | 366 |
| 9-Mar | 9,172 | 463 |
| 10-Mar | 10,149 | 631 |
| 11-Mar | 12,462 | 827 |
| 12-Mar | 15,113 | 1,016 |
| 13-Mar | 17,660 | 1,266 |
| 14-Mar | 21,157 | 1,441 |
| 15-Mar | 24,747 | 1,809 |
| 16-Mar | 27,980 | 2,158 |
| 17-Mar | ||
| 18-Mar | ||
| 19-Mar |
 The US, unfortunately, has managed to keep pace with our forecast from March 13 which was based on a moving average of growth rates. On March 13, our model predicted 5,444 cases and 80 deaths for March 16. Actual results were 4,663 cases and 86 deaths.
Again, the continuing lack of testing kits renders the number of cases essentially meaningless. Many experts feel it could be off by a factor of at least 10X, possibly much more.
The number of deaths, unfortunately, is probably accurate. The 10-DMA for daily ROG in deaths has risen from 18% on March 13 to 19.2%. The chart below reflects these data and uses the most recent 10-DMA in daily ROG for each category to forecast future results (in italics.)
The US, unfortunately, has managed to keep pace with our forecast from March 13 which was based on a moving average of growth rates. On March 13, our model predicted 5,444 cases and 80 deaths for March 16. Actual results were 4,663 cases and 86 deaths.
Again, the continuing lack of testing kits renders the number of cases essentially meaningless. Many experts feel it could be off by a factor of at least 10X, possibly much more.
The number of deaths, unfortunately, is probably accurate. The 10-DMA for daily ROG in deaths has risen from 18% on March 13 to 19.2%. The chart below reflects these data and uses the most recent 10-DMA in daily ROG for each category to forecast future results (in italics.)
| US: 10-DMA | ||
| date | cases | deaths |
| 3-Mar | 124 | 9 |
| 4-Mar | 158 | 11 |
| 5-Mar | 221 | 12 |
| 6-Mar | 319 | 15 |
| 7-Mar | 435 | 19 |
| 8-Mar | 541 | 22 |
| 9-Mar | 704 | 26 |
| 10-Mar | 994 | 30 |
| 11-Mar | 1,301 | 38 |
| 12-Mar | 1,697 | 41 |
| 13-Mar | 2,269 | 48 |
| 14-Mar | 2,943 | 57 |
| 15-Mar | 3,680 | 68 |
| 16-Mar | 4,663 | 86 |
| 17-Mar | 6,102 | 103 |
| 18-Mar | 7,984 | 122 |
| 19-Mar | 10,448 | 146 |
| 20-Mar | 13,672 | 174 |
| 21-Mar | 17,890 | 207 |
| 22-Mar | 23,410 | 247 |
| 23-Mar | 30,632 | 294 |
| 24-Mar | 40,084 | 351 |
| 25-Mar | 52,451 | 418 |
| 26-Mar | 68,635 | 499 |
| 27-Mar | 89,812 | 595 |
| 28-Mar | 117,523 | 709 |
| 29-Mar | 153,784 | 845 |
| 30-Mar | 201,232 | 1,008 |
| US: It ROG | ||
| date | cases | deaths |
| 3-Mar | 124 | 9 |
| 4-Mar | 158 | 11 |
| 5-Mar | 221 | 12 |
| 6-Mar | 319 | 15 |
| 7-Mar | 435 | 19 |
| 8-Mar | 541 | 22 |
| 9-Mar | 704 | 26 |
| 10-Mar | 994 | 30 |
| 11-Mar | 1,301 | 38 |
| 12-Mar | 1,697 | 41 |
| 13-Mar | 2,269 | 48 |
| 14-Mar | 2,943 | 57 |
| 15-Mar | 3,680 | 68 |
| 16-Mar | 4,663 | 86 |
| 17-Mar | 6,102 | 114 |
| 18-Mar | 7,984 | 135 |
| 19-Mar | 10,448 | 213 |
| 20-Mar | 13,672 | 269 |
| 21-Mar | 17,890 | 367 |
| 22-Mar | 23,410 | 481 |
| 23-Mar | 30,632 | 590 |
| 24-Mar | 40,084 | 736 |
| 25-Mar | 52,451 | 837 |
| 26-Mar | 68,635 | 1,051 |
| 27-Mar | 89,812 | 1,254 |
| 28-Mar | ||
| 29-Mar | ||
| 30-Mar |

 As in Italy, once hospital beds and ventilators are impacted the mortality rate will go up. By slowing admissions, we can reduce overcrowded conditions and keep the mortality rate lower. At least, that’s the theory.
It’s important to note that even a slight increase has a huge impact on resulting cases and deaths. The chart below shows deaths at Day 5, 10 and 30 for different daily rates of growth.
As in Italy, once hospital beds and ventilators are impacted the mortality rate will go up. By slowing admissions, we can reduce overcrowded conditions and keep the mortality rate lower. At least, that’s the theory.
It’s important to note that even a slight increase has a huge impact on resulting cases and deaths. The chart below shows deaths at Day 5, 10 and 30 for different daily rates of growth.
| ROG | Day 1 | Day 5 | Day 10 | Day 30 |
| 5% | 86 | 110 | 140 | 372 |
| 10% | 86 | 139 | 223 | 1,501 |
| 15% | 86 | 173 | 348 | 5,694 |
| 20% | 86 | 214 | 532 | 20,414 |
| 25% | 86 | 262 | 801 | 69,470 |
| 30% | 86 | 319 | 1,186 | 225,320 |
* * *
March 13, 2020 I saw something quite stunning this morning: Treasury Secretary Mnuchin describing the COVID-19 pandemic as “a great investment opportunity.” Tone deaf as ever, but no surprise there. He then went on to draw comparisons to South Korea’s experience where 200,000 people have been tested – only 4% of which were found to be infected, as though this meant there was nothing to worry about. Let’s unpack this, shall we? Actually, 222,000 people in South Korea have been tested — about .44%, or one in every 225 people. In the US, the number of people who have been tested was recently removed from the CDC website. But, many academics put it at approximately 13,600, about .0042%, or one in every 24,200 Americans. In South Korea, the government can access data – CCTV footage, GPS tracking data from phones and cars, credit cards transactions, immigration records and other data to deduce who might be at risk of contracting the disease or passing it to others. Anyone who wants testing can get it, with drive-through testing in place since March 2.
The names of those Koreans found to be infected are made public so friends and relatives who might have been exposed can get themselves tested. Anyone who tests positive is self-quarantined and monitored through an app or by phone until a bed is available, at which point an ambulance delivers them to a hospital with air-sealed isolation rooms.
In the US, an acquaintance recently told me of arriving from an extended trip to Italy and breezing through customs with a noticeable, persistent cough. No one took their temperature, asked their health status or jotted their name down for follow-up. When they called their US doctor, they were told they couldn’t be tested unless their fever topped 100.4 degrees due to a shortage of test kits. The drive-through idea was just announced today.
In South Korea, the government can access data – CCTV footage, GPS tracking data from phones and cars, credit cards transactions, immigration records and other data to deduce who might be at risk of contracting the disease or passing it to others. Anyone who wants testing can get it, with drive-through testing in place since March 2.
The names of those Koreans found to be infected are made public so friends and relatives who might have been exposed can get themselves tested. Anyone who tests positive is self-quarantined and monitored through an app or by phone until a bed is available, at which point an ambulance delivers them to a hospital with air-sealed isolation rooms.
In the US, an acquaintance recently told me of arriving from an extended trip to Italy and breezing through customs with a noticeable, persistent cough. No one took their temperature, asked their health status or jotted their name down for follow-up. When they called their US doctor, they were told they couldn’t be tested unless their fever topped 100.4 degrees due to a shortage of test kits. The drive-through idea was just announced today.
All things considered, I consider South Korea a very poor comparison. For the past several weeks, I have focused instead on Italy. Like the US, they have a modern health care system, but were caught completely off guard when COVID-19 arrived from China. Italians are also used to a certain degree of autonomy and would presumably bristle at the intrusiveness of South Korea’s response.
About 11,500 Chinese travel to Italy each day compared to 14,000 who travel to the US. The US instituted a travel ban (with some exceptions) from China on February 4. Foreigners were mostly turned away, but others had their temperature taken and were asked to self-quarantine. Italy instituted a travel ban with no exceptions, and no flights whatsoever, four days earlier.
 Italy locked down the northern part of the country, putting 16 million people on lockdown on March 8. The lockdown was extended to the entire country – 60 million people – on Tuesday, with essentially every establishment except grocery stores and pharmacies closed.
In the US, not a single city or state has been quarantined. Over the past few days, many schools, sporting events, concerts, conventions and the like have made the decision to close or operate online. I am not aware of a single enforced quarantine other than those who returned from a cruise or trip overseas and were clearly infected. Americans are asked to self-quarantine, which is fine in concept but doesn’t work very well given that the incubation period can be two weeks or longer, and few can afford to ditch their jobs for two weeks.
Italy has essentially been shut down, even though its response has arguably been much more robust than America’s. In my opinion, this doesn’t bode well for the US. I have been making predictions for the past several weeks based upon comparisons between the two: schools closing, stores closing, travel restrictions, runs on cleaning supplies and groceries. Many readers, not to mention friends and family, who initially scoffed are no longer scoffing. I get many texts and emails every day saying something along the lines of “can you believe they just cancelled…?”
I’m a numbers guy, so I’ve been working diligently to come up with a formula that expressed the path the number of cases and deaths was taking. The problem is that only a small number of cases have resolved in both Italy and the US.
Total cases in the US are (supposedly) 2,269. This is no doubt very far short of the actual number due to the lack of available testing. But, the outcome data are telling. Only 79 of these 2,269 are closed: 39% due to the patients’ recovery and 61% due to their death. This leaves 2,190 in limbo, whose fate is as yet undetermined. But, we can make some educated guesses.
While the cases are almost certainly undercounted, the number of deaths is probably fairly accurate. At 48 total deaths, the current mortality rate is 2.1%. Some might take solace in such a low number. But, that would probably be a mistake. The Italy data are below.
Italy locked down the northern part of the country, putting 16 million people on lockdown on March 8. The lockdown was extended to the entire country – 60 million people – on Tuesday, with essentially every establishment except grocery stores and pharmacies closed.
In the US, not a single city or state has been quarantined. Over the past few days, many schools, sporting events, concerts, conventions and the like have made the decision to close or operate online. I am not aware of a single enforced quarantine other than those who returned from a cruise or trip overseas and were clearly infected. Americans are asked to self-quarantine, which is fine in concept but doesn’t work very well given that the incubation period can be two weeks or longer, and few can afford to ditch their jobs for two weeks.
Italy has essentially been shut down, even though its response has arguably been much more robust than America’s. In my opinion, this doesn’t bode well for the US. I have been making predictions for the past several weeks based upon comparisons between the two: schools closing, stores closing, travel restrictions, runs on cleaning supplies and groceries. Many readers, not to mention friends and family, who initially scoffed are no longer scoffing. I get many texts and emails every day saying something along the lines of “can you believe they just cancelled…?”
I’m a numbers guy, so I’ve been working diligently to come up with a formula that expressed the path the number of cases and deaths was taking. The problem is that only a small number of cases have resolved in both Italy and the US.
Total cases in the US are (supposedly) 2,269. This is no doubt very far short of the actual number due to the lack of available testing. But, the outcome data are telling. Only 79 of these 2,269 are closed: 39% due to the patients’ recovery and 61% due to their death. This leaves 2,190 in limbo, whose fate is as yet undetermined. But, we can make some educated guesses.
While the cases are almost certainly undercounted, the number of deaths is probably fairly accurate. At 48 total deaths, the current mortality rate is 2.1%. Some might take solace in such a low number. But, that would probably be a mistake. The Italy data are below.
| Italy | ||
| date | cases | deaths |
| 21-Feb | 21 | 1 |
| 22-Feb | 79 | 2 |
| 23-Feb | 152 | 2 |
| 24-Feb | 229 | 6 |
| 25-Feb | 322 | 11 |
| 26-Feb | 400 | 12 |
| 27-Feb | 655 | 17 |
| 28-Feb | 889 | 21 |
| 29-Feb | 1,128 | 29 |
| 1-Mar | 1,701 | 34 |
| 2-Mar | 2,036 | 52 |
| 3-Mar | 2,502 | 79 |
| 4-Mar | 3,089 | 107 |
| 5-Mar | 3,858 | 148 |
| 6-Mar | 4,636 | 197 |
| 7-Mar | 5,883 | 233 |
| 8-Mar | 7,375 | 366 |
| 9-Mar | 9,172 | 463 |
| 10-Mar | 10,149 | 631 |
| 11-Mar | 12,462 | 827 |
| 12-Mar | 15,113 | 1,016 |
| 13-Mar | 17,660 | 1,266 |
| US | ||
| date | cases | deaths |
| 3-Mar | 124 | 9 |
| 4-Mar | 158 | 11 |
| 5-Mar | 221 | 12 |
| 6-Mar | 319 | 15 |
| 7-Mar | 435 | 19 |
| 8-Mar | 541 | 22 |
| 9-Mar | 704 | 26 |
| 10-Mar | 994 | 30 |
| 11-Mar | 1,301 | 38 |
| 12-Mar | 1,697 | 41 |
| 13-Mar | 2,269 | 48 |
| US – #1 | ||
| date | cases | deaths |
| 3-Mar | 124 | 9 |
| 4-Mar | 158 | 11 |
| 5-Mar | 221 | 12 |
| 6-Mar | 319 | 15 |
| 7-Mar | 435 | 19 |
| 8-Mar | 541 | 22 |
| 9-Mar | 704 | 26 |
| 10-Mar | 994 | 30 |
| 11-Mar | 1,301 | 38 |
| 12-Mar | 1,697 | 41 |
| 13-Mar | 2,269 | 48 |
| 14-Mar | 3,038 | 57 |
| 15-Mar | 4,066 | 67 |
| 16-Mar | 5,444 | 80 |
| 17-Mar | 7,288 | 94 |
| 18-Mar | 9,756 | 112 |
| 19-Mar | 13,061 | 132 |
| 20-Mar | 17,485 | 157 |
| 21-Mar | 23,407 | 185 |
| 22-Mar | 31,336 | 219 |
| 23-Mar | 41,950 | 260 |
| 24-Mar | 56,160 | 308 |
 At today’s press conference / pep rally, President Trump insisted on shaking hands with nearly every one of the corporate executives who got up to tout his company’s efforts – each of whom also reached out and adjusted the potentially infected microphone.
Trump then refused to admit he had shaken hands with or palled around with several individuals who were known to have tested positive, and was nonchalant about getting tested himself. Not a great example, to say the least. Do yourself a favor: Listen to the scientists and doctors and ignore the politicians.
I’ll continue to update the above numbers as conditions warrant. I hope I’m very, very wrong – but fear I’m not. Watch this space, and please be careful out there.
At today’s press conference / pep rally, President Trump insisted on shaking hands with nearly every one of the corporate executives who got up to tout his company’s efforts – each of whom also reached out and adjusted the potentially infected microphone.
Trump then refused to admit he had shaken hands with or palled around with several individuals who were known to have tested positive, and was nonchalant about getting tested himself. Not a great example, to say the least. Do yourself a favor: Listen to the scientists and doctors and ignore the politicians.
I’ll continue to update the above numbers as conditions warrant. I hope I’m very, very wrong – but fear I’m not. Watch this space, and please be careful out there.
The trade deal: the gift that keeps on giving.
The August trade deficit came in at $67.1 billion, the largest since 2006 – partly a reflection of the pandemic but exacerbated by a 9.3% collapse in the value of the DXY since its March highs.
 At the same time, oil and gas prices have spiked sharply higher since reaching our downside targets on Oct 2. So, bond traders can be forgiven for bidding up the 10Y to nearly 0.80%.
 If the past is any indication, DXY has much further to go and trade deficits will continue to rise – hardly the outcome the White House promised amid the destructive trade talks in 2018. Remember when the market rallied on every rumored breakthrough?
No worries, though, as VIX “coincidentally” collapsed by 10% in a matter of seconds, thus preserving a positive open. continued for members… (more…)
Many seasoned investors are surprised to see how positively correlated stock returns have been to oil prices. Energy stocks make up 8% of the overall market, so you’d expect them to have some influence. But, thanks to the increasing prominence of algorithms and quantitative trading, the impact has grown well beyond what 8% should contribute – with most of the market’s significant highs and lows perfectly aligned with oil’s over the years. A 2017 study by JP Morgan estimated that only 10% of trading volume is by discretionary investors who focus on fundamentals. This means that 90% of all volume is driven by passive and quantitative techniques including everything from index funds and ETFs to high-frequency trading and corporate buybacks.
The tail that wags the quantitative dog is algorithmic trading, where hundreds or even thousands of factors are constantly monitored and provide instant input for trading decisions. While these factors include big picture economic data such as interest rates, inflation or employment figures, the Big Three that consistently drive big moves on a daily basis are VIX, the USDJPY and the price of oil – specifically WTI futures [CL.]
Oil is the only one of the Big Three which has an almost immediate and substantial impact on the US economy. So, when prices are manipulated higher or lower, we see a change in inflation data, interest rates and, of course, stock prices.
This is why we were able to call the top on October 3, 2018:
CL and RB…not only reached overhead resistance by our measure, but must deal with inflation that’s too high, bearish API data, another round of Trump tweeting, and a large build in EIA inventory. I think the time has finally come to revert to short…
CPI had recently reached almost 3%, dragging interest rates higher as well. The 10-YR reached 3.25% on Oct 5, threatening to break out of a channel dating back over 20 years at a time when debt was exploding higher.
 Trump had been jawboning and tweeting his desire for lower oil prices. But, his entreaties had fallen on deaf ears until Oct 3, when journalist Jamal Khashoggi was brutally murdered and dismembered by agents of Saudi Arabia for criticizing Saudi Crown Prince Mohammad Bin Salman (MBS.)
As details emerged and MBS’ complicity became evident, Saudi Arabia suddenly needed friends in high places. Trump was happy to oblige, but had one condition: oil prices needed to decline immediately – which they did. CL plunged 45% over the next 11 weeks. The YoY drop in oil and gas prices was immediately reflected in inflation. CPI dropped from 2.52% in October to 2.18% in November and a low of 1.52% by February 2019.
 The 10-YR dropped from 3.25% in October 2018 to 2.36% by March 2019. Prices at the pump plunged as well, and Americans rejoiced at more affordable commuting costs.
 Remember, oil is one of the Big Three drivers of stock prices. So stocks plunged as well – shedding about 20% by December, when Treasury Secretary Mnuchin convened the Plunge Protection Team to prop up the market – enabling stocks to reach new highs while CL merely enjoyed an extended bounce.
 Saudi Arabia needed the bounce every bit as much as did stocks. The troubled Aramco share offering had been delayed time and again, and higher oil prices made a larger raise possible. The plunge resumed within a few weeks of the IPO.
 Then came the slowdown. Demand had already been ebbing and prices had been settling lower for weeks. But, after a very brief bounce, oil prices plunged when COVID-19 came onto the scene. Suddenly, fundamentals mattered again.
Prices plunged to the bottom of a falling channel from 2008 over 3 years ahead of schedule per the cycle study we first posted in March 2019 [see: Macro Cycles and Regime Shifts.] This added fuel to the fire for stocks, which already had plenty of reason to plunge as global economic activity screeched to a halt. Algos, which might normally have been employed to prop up stocks, were pressuring them lower. At the same time, the USDJPY was falling as the Japanese yen rallied and VIX spiked higher on greatly increased volatility.
Note that long-term trends in gasoline prices were also in danger of breaking down.
 Perhaps more alarming to Team Trump, the Dow had fallen to levels not seen since the 2016 election.
  The energy industry is vitally important to the US, with millions of jobs and billions in loans dependent on prices stabilizing. It’s no surprise that the federal government would support it as it has many other industries which have been decimated by the global pandemic. Many majors oppose price supports, perhaps hoping to scoop up highly-leveraged players at a bargain price when they failed.
However, instead of making low or no-interest loans available to tide the industry over as it has with every other affected industry, Trump has focused on artificially inflating prices — first with a series of Tweets and lately with a threat to impose tariffs on imported oil.
 As a result, oil has spiked over 50% higher in a mere 4 sessions…
 …facilitating a 24% bounce in the Dow.
 While some are thrilled with the outcome, there are winners and losers. The biggest losers are those who can least afford it: consumers. Higher oil and gas prices are a regressive tax on those consumers who must still drive (disproportionately those less affluent) or buy heating oil or natural gas to keep their families warm during the waning days of cold weather.
It’s important to recognize that Trump’s insistence on higher oil prices might be partly about saving oil industry jobs, but it’s really about saving the stock market which has learned to take its cues from oil prices.
If Trump’s “friend” Mohammad Bin Salman — a “man of the people” — still owes any chits from 2018, oil prices could be well supported going forward. But, of course, it will require the assistance of Trump’s other friend, Vladimir Putin, whose willingness to cut back production involves slightly different priorities.
With COVID-19 deaths in the US topping 10,000, Putin’s response will be important in crafting the next headline-stealing development. But, most studies I’ve seen indicate that supply now exceeds demand by at least 25 million bpd. So, even the 10-15 million cut suggested by Trump would do nothing to erase the massive oversupply but would merely slow the rate at which the excess is building.
Rumor has it that Russia will play ball as long as every other oil producing nation is willing to share the pain – including US shale producers, many of were already on life support before COVID-19 (and expect a decent return on their political donations.)
If I sell you 100 barrels at $30 instead of 200 at $15, have I made any more money? Will I now be able to pay back that overdue loan? Will the market reward my stock? Unfortunately, it only works if the pain is borne by the other guys — which will likely boil down to good, old-fashioned horse trading. Trump’s opening ante is throwing down-and-out Americans under the bus. We’ll see if it’s enough.
continued for members… (more…)
In our last dedicated update on the Dow [see: July 2019 Update], we noted the intersection of a number of overhead resistance features in its chart and offered some thoughts on its downside potential if it managed to reverse.
Note that our 18974 target represents a backtest of the red channel from which DJIA broke out and backtested between 2014-2016 as well as the white 1.618. A May 2020 bottom at 18974ish would align nicely with the SPX 2138 target indicated by our analog.
 I posted my charts on July 29 (the yellow arrow) and was roundly cheered when he Dow cratered 7% over the next two weeks, even closing below its 200-DMA…
 …and was loudly jeered when it made that up and went on to new all-time highs. I’ve seen this sort of thing so often from the Dow that I was pretty hot under the collar. I’m pretty sure an older (yes, there are a few) wiser colleague took me aside and muttered “Forget it, Pebble, it’s the Dow.”
So, I did. You see, when it comes to manipulation the Dow is the all-time champ: share price weighted, with the ability to kick out losers and slide in winners whenever you like? How is this even an index?
When the market reversed on cue in mid-February [see: A New Day, Same Old Nonsense] I don’t think I even checked to see where the Dow was (the blue arrow below.) I’ll admit I got curious when it closed below its 200-DMA on Feb 25. But, I didn’t inhale. I stayed focused on real indices, cratering oil prices and the bond market. Well…guess where it landed today? Go ahead. I’ll wait.
You guessed it. Right where our July 2019 forecast said: the bottom of the falling red channel where it intersected with the top of the rising red channel and the 1.618 Fib extension at 18974. It’s a 33% drop from stem to stern. You can’t make this stuff up.
 Knowing we have a global pandemic on our hands and a minimum of a quarter of negative GDP ahead of us, surely it’ll keep going, right? I mean, did you hear Bill Ackman today? Hell is coming! So, the Dow is positioned for a bounce. That’s right. IF oil and gas can continue bouncing, and IF USDJPY can pop up through its SMA200 and IF VIX breaks down and IF the 2s10s craters back below 48 bps, then DJIA will definitely probably bounce. At least a little.
continued for members… (more…)
It was October 1989 and the stock market was in trouble. Two years after crashing 36% (including 20% in a single session) the S&P 500 had made a comeback and had climbed back to new all-time highs. But high inflation, slipping junk bond prices and failing S&Ls were in the headlines daily. On October 13, stocks slid nearly 7% – back below the 1987 highs. It was time for action.
 Two weeks later, recently-retired Fed Governor Robert Heller penned an op-ed in the Wall Street Journal that advocated a more active approach than simply tinkering with money supply and interest rates.
The Fed, which “already play[ed] an important indirect role in the stock market”…”could buy the broad market composites in the futures market. The increased demand would normalize trading and stabilize prices. Stabilizing the derivative markets would tend to stabilize the primary market.”
The Fed apparently didn’t take his advice, as it continued to whipsaw for another 15 months before finally breaking above the 1987 highs to stay, relying on an barrage of rate cuts, crashing oil prices, aggressively bullish Fedspeak, and a cut in capital gains taxes. Thirty years on, there is much circumstantial evidence that the Fed has bought into Heller’s suggestions. JPMorgan estimates that “fundamental discretionary traders” account for only about 10 percent of trading volume in stocks. This means that 90% of trading either keys off of quantitative techniques or is passive (i.e. follows the quants’ lead.)
The upshot? Triggering a few big quant managers to buy stocks can cause an avalanche of buying by index funds, ETFs, smart beta funds, etc. Picture a $50 billion tail wagging a $30 trillion dog.
If it seems complicated, I assure you it’s not. It often occurs overnight, when low-volume equity markets readily respond to, say, sharp declines in VIX futures or a spike in the USDJPY — tried and true signals that rarely fail to ignite rallies. We had a prime example today in the wake of Iran’s attack on US air bases in Iraq [see: We’ve Seen This Movie Before.]
VIX, which closed flat yesterday, rose sharply after the close until 7:41PM ET, at which point S&P 500 futures reached an important level of technical support. From there, VIX began an orderly decline, spurring ES to new all-time highs when it dropped below its recent lows. We’ll never know whether the Fed itself is triggering algorithms to buy until it accedes to being audited. Unlike the Bank of Japan or the Swiss National Bank, the Fed doesn’t share its trading activity. The instigator could very well be another central bank, a proxie, or just a large quantitative player caught too far out over their skis when markets got dicey.
I’m not sure it matters all that much. The fact is that it’s happening, and happening more and more frequently — which smacks of a very directionally-biased player with access to plenty of cheap capital [of course, central banks sporting negative interest rates actually get paid to prop up stocks.]
Heller recognized the risks in such an approach, arguing that “the Fed’s stock market role ought not to be very ambitious. It should seek only to maintain the functioning of markets — not to prop up the Dow Jones or New York Stock Exchange averages at a particular level.”
Perhaps he didn’t appreciate, however, just how addictive support can become to both markets and politicians who rely on them for reelection. Consider how often stocks have rallied to new all-time highs on the breathless announcement of a breakthrough in the China trade wars.
As Dallas Fed President Richard Fisher said about QE in 2016, “the Fed front-loaded an enormous market rally in order to create a wealth effect… We injected cocaine and heroin into the system…and now we are maintaining it with Ritalin.” Central bankers would do well to remember that although addictions are tough to kick, they can be fatal if left untreated.
No one knows how much bigger the latest equity balloon can be blown. But, when markets lose their ability to fairly reflect the risk inherent in speculative investments, it’s time to start paying very close attention.
Here, in all its glory, is Heller’s op-ed from 1989. The highlights are mine.
* * *
Have Fed Support Stock Market, Too
By Robert Heller
27 October 1989
The Wall Street Journal
(Copyright (c) 1989, Dow Jones & Co., Inc.)
The stock market correction of Oct. 13, 1989, was a grim reminder of the Oct. 19, 1987 market collapse. Since, like earthquakes, stock market disturbances will always be with us, it is prudent to take all possible precautions against another such market collapse.
In general, markets function well and adjust smoothly to changing economic and financial circumstances. But there are times when they seize up, and panicky sellers cannot find buyers. That’s just what happened in the October 1987 crash. As the market tumbled, disorderly market conditions prevailed: The margins between buying bids and selling bids widened; trading in many stocks was suspended; orders took unduly long to be executed; and many specialists stopped trading altogether.
These failures in turn contributed to the fall in the market averages: Uncertainty extracted an extra risk premium and margin-calls triggered additional selling pressures.
The situation was like that of a skier who is thrown slightly off balance by an unexpected bump on the slope. His skis spread farther and farther apart — just as buy-sell spreads widen during a financial panic — and soon he is out of control. Unable to stop his accelerating descent, he crashes.
After the 1987 crash, and as a result of the recommendations of many studies, “circuit breakers” were devised to allow market participants to regroup and restore orderly market conditions. It’s doubtful, though, whether circuit breakers do any real good. In the additional time they provide even more order imbalances might pile up, as would-be sellers finally get their broker on the phone.
Instead, an appropriate institution should be charged with the job of preventing chaos in the market: the Federal Reserve. The availability of timely assistance — of a backstop — can help markets retain their resilience. The Fed already buys and sells foreign exchange to prevent disorderly conditions in foreign-exchange markets. The Fed has assumed a similar responsibility in the market for government securities. The stock market is the only major market without a market-maker of unchallenged liquidity or a buyer of last resort.
This does not mean that the Federal Reserve does not already play an important indirect role in the stock market. In 1987, it pumped billions into the markets through open market operations and the discount window. It lent money to banks and encouraged them to make funds available to brokerage houses. They, in turn, lent money to their customers — who were supposed to recognize the opportunity to make a profit in the turmoil and buy shares.
The Fed also has the power to set margin requirements. But wouldn’t it be more efficient and effective to supply such support to the stock market directly? Instead of flooding the entire economy with liquidity, and thereby increasing the danger of inflation, the Fed could support the stock market directly by buying market averages in the futures market, thus stabilizing the market as a whole.
The stock market is certainly not too big for the Fed to handle. The foreign-exchange and government securities markets are vastly larger. Daily trading volume in the New York foreign exchange market is $130 billion. The daily volume for Treasury Securities is about $110 billion.
The combined value of daily equity trading on the New York Exchange, the American Stock Exchange and the NASDAQ over-the-counter market ranges between $7 billion and $10 billion. The $13 billion the Fed injected into the money markets after the 1987 crash is more than enough to buy all the stocks traded on a typical day. More carefully targeted intervention might actually reduce the need for government action. And taking more direct action has the advantage of avoiding sharp increases in the money supply, such as happened in October 1987.
The Fed’s stock market role ought not to be very ambitious. It should seek only to maintain the functioning of markets — not to prop up the Dow Jones or New York Stock Exchange averages at a particular level. The Fed should guard against systemic risk, but not against the risks inherent in individual stocks. It would be inappropriate for the government or the central bank to buy or sell IBM or General Motors shares. Instead, the Fed could buy the broad market composites in the futures market. The increased demand would normalize trading and stabilize prices. Stabilizing the derivative markets would tend to stabilize the primary market. The Fed would eliminate the cause of the potential panic rather than attempting to treat the symptom — the liquidity of the banks.
Disorderly market conditions could be observed quite frequently in foreign exchange markets in the 1960s and 1970s. But since the member countries of the International Monetary Fund agreed to the “Guidelines to Floating” in 1974, such difficulties have been avoided. I cannot recall any disorder in currency markets since the 1974 guidelines were adopted. Thus, the mere existence of a market-stabilizing agency helps to avoid panic in emergencies.
The old saying advises: “If it ain’t broke, don’t fix it.” But this could be a case where we all might go broke if it isn’t fixed.