Month: April 2020

  • Futures Rally on Abysmal Economic Data

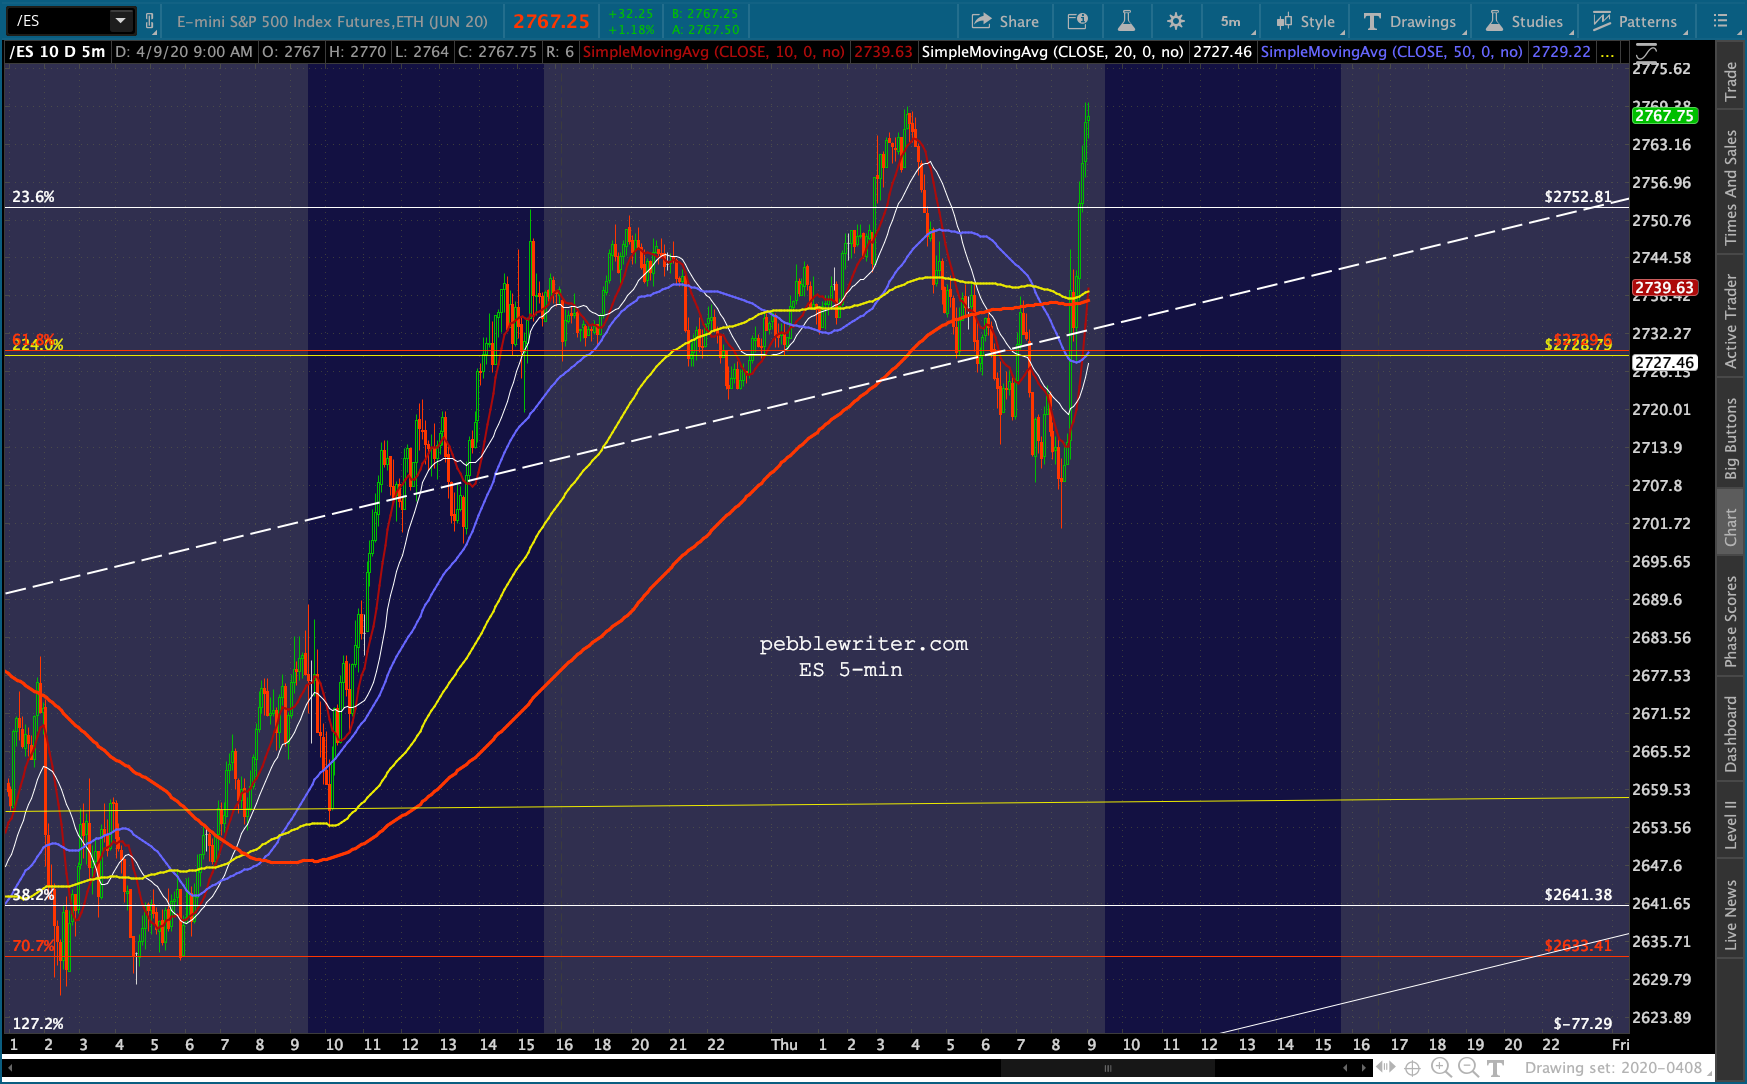
    So far, the futures are ignoring another round of abysmal economic data:

    Instead of plunging, ES is up nearly 20 points as the algos are more concerned with VIX’s breakdown.Nothing new here, of course…but can it last past the open?  Not if yesterday’s close by DJIA and COMP are any indication.  The Dow passed up an opportunity to break out above its 2.24 extension……and COMP pulled back and closed below its SMA200. Not exactly the behavior of a market intent on higher highs…  Meanwhile, global COVID-19 cases reached 2mm yesterday – up from 1mm on April 2.  The US now accounts for over 30% of all cases and moved up from 44th to 43rd in testing per capital in the world.

    continued for members(more…)

  • The Art of the Deal

    I’m guessing this isn’t the result President Trump was hoping for when arm-twisting (or was it horse trading?) Russia and Saudi Arabia into the “beautiful deal” he continues to tout.

    Apparently, he forgot to convince pretty much every analyst and trader out there that a 10 million bpd cut could offset the 25 million bpd in excess production.Not even the algos are buying the line that this stinker will stabilize prices. Even before this morning’s abysmal Retail Sales and Empire Manufacturing data, futures were off a bundle. Thanks to yesterday’s nonsensical ramp, however, the drop was from a much higher level and the latest H&S Pattern was busted. Cue the talk about opening the country on May 1.

    continued for members(more…)

  • A Broken Record

    We’ve seen another overnight meltup – the 7th in a row… …as VIX continues to be hammered in the after-hours……more than offsetting the losses in oil, which was kind enough to wait until after the close to break trend……and the ongoing leakage in USDJPY.

    This means another busted H&S Pattern – the 4th in the past week – and higher highs in SPX and ES. The bigger themes continue to be a yield curve completely under Fed control and ceaseless pronouncements of “reopening” the country, which boil down to how many deaths are acceptable.

    None of that will be reflected in the daily market data, which will simply reflect a continuing rally in the face of the worst economic outlook since the Great Depression.

    continued for members(more…)

  • The Oil “Market”

    If you blinked, you might have missed oil’s correction off Friday’s highs. The much vaunted deal between Russia and Saudi Arabia was a flop. As we’ve maintained for the past several weeks:

    …supply now exceeds demand by at least 25 million bpd. So, even the 10-15 million cut suggested by Trump would do nothing to erase the massive oversupply but would merely slow the rate at which the excess is building.

    This doesn’t mean, however, that oil prices won’t continue to be manipulated.  For years, we’ve seen nonsensical moves which defy most predictions based on supply and demand. This one is no different.

    Otherwise, you’d never expect to see CL bounce precisely at the bottom of a channel from its Mar 30 lows.Could it be related to Trump’s tweet (right as the market opened) that the 10mm bpd cut OPEC already announced was supposed to be 20mm?

    From OPEC’s press release on Friday:

    In view of the current fundamentals and the consensus market perspectives, the Participating Countries agreed to…adjust downwards their overall crude oil production by 10.0 mb/d, starting on 1 May 2020, for an initial period of two months that concludes on 30 June 2020.

    Following the two month reduction (from inflated levels, mind you) the amount of the cut actually declines to 8mm bpd for the remainder of the year, then to 6mm bpd for the next 16 months.  Even at 20mm, there is still as much as 15mm bpd too much oil being produced every single day. Trump’s tweet just doesn’t reflect reality…”to put it mildly.”

    As we watch stock futures ramp higher into the open for the sixth session in a row, is it any wonder that oil is as manipulated as it is?

    continued for members(more…)

  • The Big Picture: Apr 9, 2020

    Where did March go?  If you’re anything like me, it was a blur.  I was in the process of recovering from knee replacement surgery when the crash began [being under the influence of some very strong pain killers was probably the best way to weather the storm.]

    On February 3, the day before I went under the knife, I pulled together a forecast on everything I chart: stocks, bonds, currency pairs, commodities, etc.  I try to update the Current Forecast page at least every month. But, between the pain and the global pandemic which threatened to trap my daughter in Rome, I was a little preoccupied.

    I had been fairly bearish when penning that Feb 3 forecast and was still lucid enough in the following weeks to warn of the coming storm, writing on Feb 18 in When Will News Begin to Matter Again

    …be very careful in chasing this breakout. It is built on a very weak algo-driven foundation which, given the coming moves in CL, DXY, USDJPY and TNX, cannot stand. When it cracks, it could be quite violent.

    …and, again on Feb 20 in Buckle Up:

    …the major downside support levels such as the yellow 2.618 at 3047 – which was never backtested – and 2.24 at 2703 will soon disappear from the path of the existing rising channels… All I know is that when important support breaks down, it’s time to short – especially when the usual central bank tricks aren’t working.

    As it turned out, Feb 20 was the all-time high. A month later, SPX had fallen further and faster than ever before. Needless to say, the targets mentioned in the forecast were reached and exceeded in almost every case – more than reversing the excesses of the breakout above SPX 3047.

    My favorite downside targets over the past six months have been ES 2155 and SPX 2138.  ES came close, dropping within 19 points of its target on Mar 23 before all hell broke loose.

    The Fed began an extraordinary response which was expanded again by $2.3 trillion at 8:30:01 this morning.  Not coincidentally, it was announced seconds after jobless claims of 6.6 million (also not coincidentally, which tied the worst ever prior continuing claims number) were announced.

    Futures responded as planned — taking us another step past the line where price discovery used to be. The Fed might as well have named it the Prop Up the Market Program, as it lends new import to the expression “don’t fight the Fed.”

    Oh, and just in case the market doesn’t understand the Fed’s intentions, Jerome Powell will give another presser at 10AM.

    Just for fun, here’s a quick peek at where things stood on February 3…

    Short RB:  2/3/20 – Shorted near target on 4/24, back to long on 6/5, shorted again at backtest targets on 7/11 and back to long on 9/5. Back to short on 9/16 and back to long on 10/3. Shorted on 11/4 with tight stops, target of 1.35. Broke down on 11/19, but buy triggered on 11/20. Back to short on 11/22, long on Dec 4 and short on Dec 27.  Targets are 1.44, 1.41 and 1.349.

    Short CL:  2/3/20 – Shorted near target on 4/24, back to long at target on 6/5, shorted at backtest target on 7/11, breakouts on 9/16 and .886 target on Jan 8. Targets delayed by Aramco IPO in Dec and Al Asad spike in January.  54.55 target reached on Jan 24, breakdown yielded targets of 51.62 (reached Jan 31), 49.46, 47.55 and 46.

    Neutral DXY:  2/3/20 – We were long from 88.253 on Feb 16, 2018.  Came close enough to our 97.873 target on Nov 12 and again on Dec 14 where we shorted at 97.  Multiple breakdowns have bounced back, leaving DXY in trading range between 97-99 since Aug 2019. Essentially jerking algos around with signalling rises and dips. Don’t see it as a viable trading vehicle until at least March 2020, when inflation pressures should ease and make a decline possible.

    Short USDJPY: 2/3/20 – Has been consolidating since June 2016, making lower highs and lows in the 104.74 area.  Highs have followed a falling channel top, with the latest tag of our upside target on Jan 17. Since then, USDJPY has accommodated stocks’ weakness, with even lower downside targets of 107.94 and 107.64.a 107.64.  The range remains tight (only 3 points, 107-110ish) so – like DXY – it has offered very modest trading opportunities.

    Short EURUSD: 2/3/20 – Has been in a gently falling channel since July 2018, seems destined to remain in it for the foreseeable future. Recently backtested the latest rising corrective channel it broke down from. A nice drop to 1.0592 is possible, but the ECB is being careful to avoid big drops. Next downside target is 1.0813.

    Short SPX/ES: 2/3/20 – formed an inverted H&S Pattern from Jan 2018, breaking out in Oct 2019 and racing higher in an acceleration channel to 1.618 Fib at SPX 3306.51/ ES 3336.49, at which point we started looking for a backtest of the acceleration channel/SMA50 around 3200 and, if that fails, the IH&S around SPX 3100. Major support below that include SPX’s 2.618 at 3047 and the 2.24 at 2703. If SPX should break out of its current correction, the IH&S targets 3673.

    Long Gold:  2/3/20 – went back to long on rise through yellow TL at 1195 in August 2018. Completed IH&S, reaching 1370 target (again) in June 2019, then channel top in Aug 2019 and again on Jan 8, 2020. Backtested rising channel midline target on Nov 12, 2019 and back to red channel top where it is threatening a breakout. If it doesn’t, it has downside risk to 1490ish, 1424 and 1380. If it does, upside targets include IH&S target at 1308 and .786 Fib at 1735.70.

    Long VIX:  2/3/20 – Went long in Jan 2020 after survived test of TL from Nov 2017. Has run into resistance at successively lower points on a falling TL from Aug 5, finally breaking out on Jan 27, 2020. Upside targets now include the TL from Dec 24, 2018, favoring 23.38.  A breakout above it would open up 25.50 and 33.33.

    Short COMP: 2/3/20 – Spent Apr 2 through Oct 25, 2019 trying to break out of falling channels and make new highs. Oct Oct 25 2019, finally broke out for good, testing 1.618 at 9334.14 on Jan 16, 2020. Anything below 9334 opens the door to 8953, 8661 and potentially 8133. But, stops are warranted as COMP has ignored reality time and time again.

    Long Bonds: 2/3/20 – ZN reached our downside target of 117’135 on Oct 8, 2018, has since bounced to our successively higher targets, reaching the .886 at 132’100 on Sep 3, 2019.  Almost backtested the SMA200 on Dec 19, has since broken out, back to near its Sep high. Targeting 133’070, followed by 134’075 and 135’155.

    Shorted TNX in Oct 2018 and have seen it tag successively lower targets until reaching 15.54 on Aug 15, 2019.  Long, drawn out series of bounces until Jan 21, 2020 when it broke down again. Reached 1.636 target on Jan 27, 15.54 on Jan 30 and is approaching 14.91 target. If it breaks lower, targets include 14.46 and 14.29. Longer-term, see the 10Y reaching 8.16 around May 2020 and approaching 0.0 in Jun-October 2020.

    We’ll continue with a roundup of where we are two months later.

    continued for members… (more…)

  • Update on Gold: Apr 8, 2020

    In our last formal update on gold in January [see: Jan 2 Update on Gold] with GC trading at 1529, I noted that although DXY had held up well, gold should benefit from loose Fed policy – but could see a backtest of its SMA200 based on the oil/gas meltdown we expected.

    I am partial, though, to the Fed putting the damper on inflation in January (reported in Feb) and setting up a backtest of the SMA200 or even the neckline which would set up another leg up to 1710-1735 in Oct 2021 or Jan 2022. Note that this would tie in nicely with the idea of an oil/gas meltdown in 2023.

    We certainly got all those things, but the timing was just a tad off.

    Long time members will remember I’ve been writing about gold’s potential Inverted Head & Shoulders Pattern for years. This post from September 2017 comes to mind.

    As I stated in that last update, I think TPTB will do whatever it takes to keep that giant IH&S targeting 1721 from playing out. The only thing I can see outweighing their efforts would be a true black swan event such as open warfare on the Korean Peninsula.

    Sure enough, every time GC got close to that neckline (the dashed yellow line above), it was smacked down by as much as 18%. It has happened 9 times since July 2016.  It was nice for trading purposes, but frustrating to the many gold bugs out there.

    While rising oil and gas prices were helpful to Aramco’s share offering in 2019, they disrupted the delicate balance between inflation and interest rates and sent a clear signal that it was finally time for GC to break out — which it finally did last June.

    Since then, it’s been a matter of waiting for the rising price channel to reach our upside targets. It might have been a long wait if not for the coronavirus. We managed to avoid war with North Korea, but this smaller, deadlier enemy was plenty Black Swan enough for the Fed.

    A few trillion in QE later, GC has reached our 1735 target — well ahead of schedule and after a very dramatic SMA200 backtest.

    Is the run over, or is there more to come?

    continued for members(more…)

  • A Stall, or More?

    A few days ago, we looked at the outsized influence of oil on algorithms.  It’s one of the big three: oil, VIX and USDJPY. This morning, it’s USDJPY’s turn.

    Futures, which were down 17 points late last night, are suddenly up 35 points as we approach the opening bell. It happened in the absence of any particular news and without any particular support level having been reached. It was just USDJPY which, on its way to backtest its SMA200, made a sudden reversal well short of it and went up to test the same overhead TL which has stopped it multiple times since Monday. This time, though, as futures were having a hard time exceeding the overnight highs, it popped through that TL – a breakout that the algos couldn’t ignore.Will it be enough to outweigh yesterday’s disappointing reversal of fortune precipitated by oil’s sudden fall from grace?

    Meanwhile, the “slowdown” in COVID-19 cases and deaths in the US took a turn for the worse yesterday…


    … as new evidence emerges of the administration’s failure to heed pandemic warnings from Peter Navarro from as early as January 29 even as President Trump and key administration officials were downplaying the risk. Copies of the full memos can be found here.

    January 29 memo to the National Security Council, chaired by President Trump:

    The February 23 memo addressed directly to the President:

    ABC reports that US Intelligence officials’ warnings about the virus were first aired in November 2019 and began appearing in the President’s daily briefings in early January.

    I suspect this won’t play well in Peoria.

    continued for members(more…)

  • What Line in the Sand?

    Another massive overnight ramp job…nothing new there. But, this one has led ES to an important Fib level where it seems to be pausing: the 2.24 extension of the 2007-2009 drop.  Will it matter?

    The great thing about ES’ overnight ramp jobs is that they allow SPX to gap right over its own overhead resistance – which in this case is SPX’s 2.24 Fib extension at 2703.62. It’s the Fib that SPX spent from Jan 3, 2018 to Feb 11, 2019 endlessly crisscrossing.

    continued for members(more…)

  • Update on Oil: Apr 6, 2020

    Many seasoned investors are surprised to see how positively correlated stock returns have been to oil prices. Energy stocks make up 8% of the overall market, so you’d expect them to have some influence. But, thanks to the increasing prominence of algorithms and quantitative trading, the impact has grown well beyond what 8% should contribute – with most of the market’s significant highs and lows perfectly aligned with oil’s over the years.A 2017 study by JP Morgan estimated that only 10% of trading volume is by discretionary investors who focus on fundamentals. This means that 90% of all volume is driven by passive and quantitative techniques including everything from index funds and ETFs to high-frequency trading and corporate buybacks.

    The tail that wags the quantitative dog is algorithmic trading, where hundreds or even thousands of factors are constantly monitored and provide instant input for trading decisions.  While these factors include big picture economic data such as interest rates, inflation or employment figures, the Big Three that consistently drive big moves on a daily basis are VIX, the USDJPY and the price of oil – specifically WTI futures [CL.]

    Oil is the only one of the Big Three which has an almost immediate and substantial impact on the US economy. So, when prices are manipulated higher or lower, we see a change in inflation data, interest rates and, of course, stock prices.

    This is why we were able to call the top on October 3, 2018:

    CL and RB…not only reached overhead resistance by our measure, but must deal with inflation that’s too high, bearish API data, another round of Trump tweeting, and a large build in EIA inventory. I think the time has finally come to revert to short…

    CPI had recently reached almost 3%, dragging interest rates higher as well. The 10-YR reached 3.25% on Oct 5, threatening to break out of a channel dating back over 20 years at a time when debt was exploding higher.

    Trump had been jawboning and tweeting his desire for lower oil prices. But, his entreaties had fallen on deaf ears until Oct 3, when journalist Jamal Khashoggi was brutally murdered and dismembered by agents of Saudi Arabia for criticizing Saudi Crown Prince Mohammad Bin Salman (MBS.)

    As details emerged and MBS’ complicity became evident, Saudi Arabia suddenly needed friends in high places. Trump was happy to oblige, but had one condition: oil prices needed to decline immediately – which they did.  CL plunged 45%  over the next 11 weeks.The YoY drop in oil and gas prices was immediately reflected in inflation. CPI dropped from 2.52% in October to 2.18% in November and a low of 1.52% by February 2019.

    The 10-YR dropped from 3.25% in October 2018 to 2.36% by March 2019.  Prices at the pump plunged as well, and Americans rejoiced at more affordable commuting costs.

    Remember, oil is one of the Big Three drivers of stock prices. So stocks plunged as well – shedding about 20% by December, when Treasury Secretary Mnuchin convened the Plunge Protection Team to prop up the market – enabling stocks to reach new highs while CL merely enjoyed an extended bounce.Saudi Arabia needed the bounce every bit as much as did stocks. The troubled Aramco share offering had been delayed time and again, and higher oil prices made a larger raise possible. The plunge resumed within a few weeks of the IPO.Then came the slowdown.  Demand had already been ebbing and prices had been settling lower for weeks. But, after a very brief bounce, oil prices plunged when COVID-19 came onto the scene. Suddenly, fundamentals mattered again.

    Prices plunged to the bottom of a falling channel from 2008 over 3 years ahead of schedule per the cycle study we first posted in March 2019 [see: Macro Cycles and Regime Shifts.]This added fuel to the fire for stocks, which already had plenty of reason to plunge as global economic activity screeched to a halt.  Algos, which might normally have been employed to prop up stocks, were pressuring them lower.  At the same time, the USDJPY was falling as the Japanese yen rallied and VIX spiked higher on greatly increased volatility.

    Note that long-term trends in gasoline prices were also in danger of breaking down.

    Perhaps more alarming to Team Trump, the Dow had fallen to levels not seen since the 2016 election. The energy industry is vitally important to the US, with millions of jobs and billions in loans dependent on prices stabilizing. It’s no surprise that the federal government would support it as it has many other industries which have been decimated by the global pandemic. Many majors oppose price supports, perhaps hoping to scoop up highly-leveraged players at a bargain price when they failed.

    However, instead of making low or no-interest loans available to tide the industry over as it has with every other affected industry, Trump has focused on artificially inflating prices — first with a series of Tweets and lately with a threat to impose tariffs on imported oil.

    As a result, oil has spiked over 50% higher in a mere 4 sessions…

    …facilitating a 24% bounce in the Dow.

    While some are thrilled with the outcome, there are winners and losers. The biggest losers are those who can least afford it: consumers. Higher oil and gas prices are a regressive tax on those consumers who must still drive (disproportionately those less affluent) or buy heating oil or natural gas to keep their families warm during the waning days of cold weather.

    It’s important to recognize that Trump’s insistence on higher oil prices might be partly about saving oil industry jobs, but it’s really about saving the stock market which has learned to take its cues from oil prices.

    If Trump’s “friend” Mohammad Bin Salman — a “man of the people” — still owes any chits from 2018, oil prices could be well supported going forward. But, of course, it will require the assistance of Trump’s other friend, Vladimir Putin, whose willingness to cut back production involves slightly different priorities.

    With COVID-19 deaths in the US topping 10,000, Putin’s response will be important in crafting the next headline-stealing development. But, most studies I’ve seen indicate that supply now exceeds demand by at least 25 million bpd. So, even the 10-15 million cut suggested by Trump would do nothing to erase the massive oversupply but would merely slow the rate at which the excess is building.

    Rumor has it that Russia will play ball as long as every other oil producing nation is willing to share the pain – including US shale producers, many of were already on life support before COVID-19 (and expect a decent return on their political donations.)

    If I sell you 100 barrels at $30 instead of 200 at $15, have I made any more money?  Will I now be able to pay back that overdue loan?  Will the market reward my stock? Unfortunately, it only works if the pain is borne by the other guys — which will likely boil down to good, old-fashioned horse trading.  Trump’s opening ante is throwing down-and-out Americans under the bus. We’ll see if it’s enough.

    continued for members(more…)

  • Seems Like Old Times

    Another ramp job on awful economic news which pretty much everybody recognizes understates how bad things really are…

    …and a 46% spike in WTI futures in 4 days based on a Tweet referencing a deal: (1) which has yet to be confirmed by any of the parties; (2) could probably never get done; (3) which, if it were done, would simply slow down the rate at which supply vastly exceeds flatlining demand; and, (4) which, if it were done, would put the most vulnerable Americans deeper in an economic hole than they already are.

    You’d never guess the economy was in dire straits – just like old times.

    continued for members(more…)