

If you blinked, you might have missed oil’s correction off Friday’s highs. The much vaunted deal between Russia and Saudi Arabia was a flop. As we’ve maintained for the past several weeks:
…supply now exceeds demand by at least 25 million bpd. So, even the 10-15 million cut suggested by Trump would do nothing to erase the massive oversupply but would merely slow the rate at which the excess is building.
This doesn’t mean, however, that oil prices won’t continue to be manipulated. For years, we’ve seen nonsensical moves which defy most predictions based on supply and demand. This one is no different.
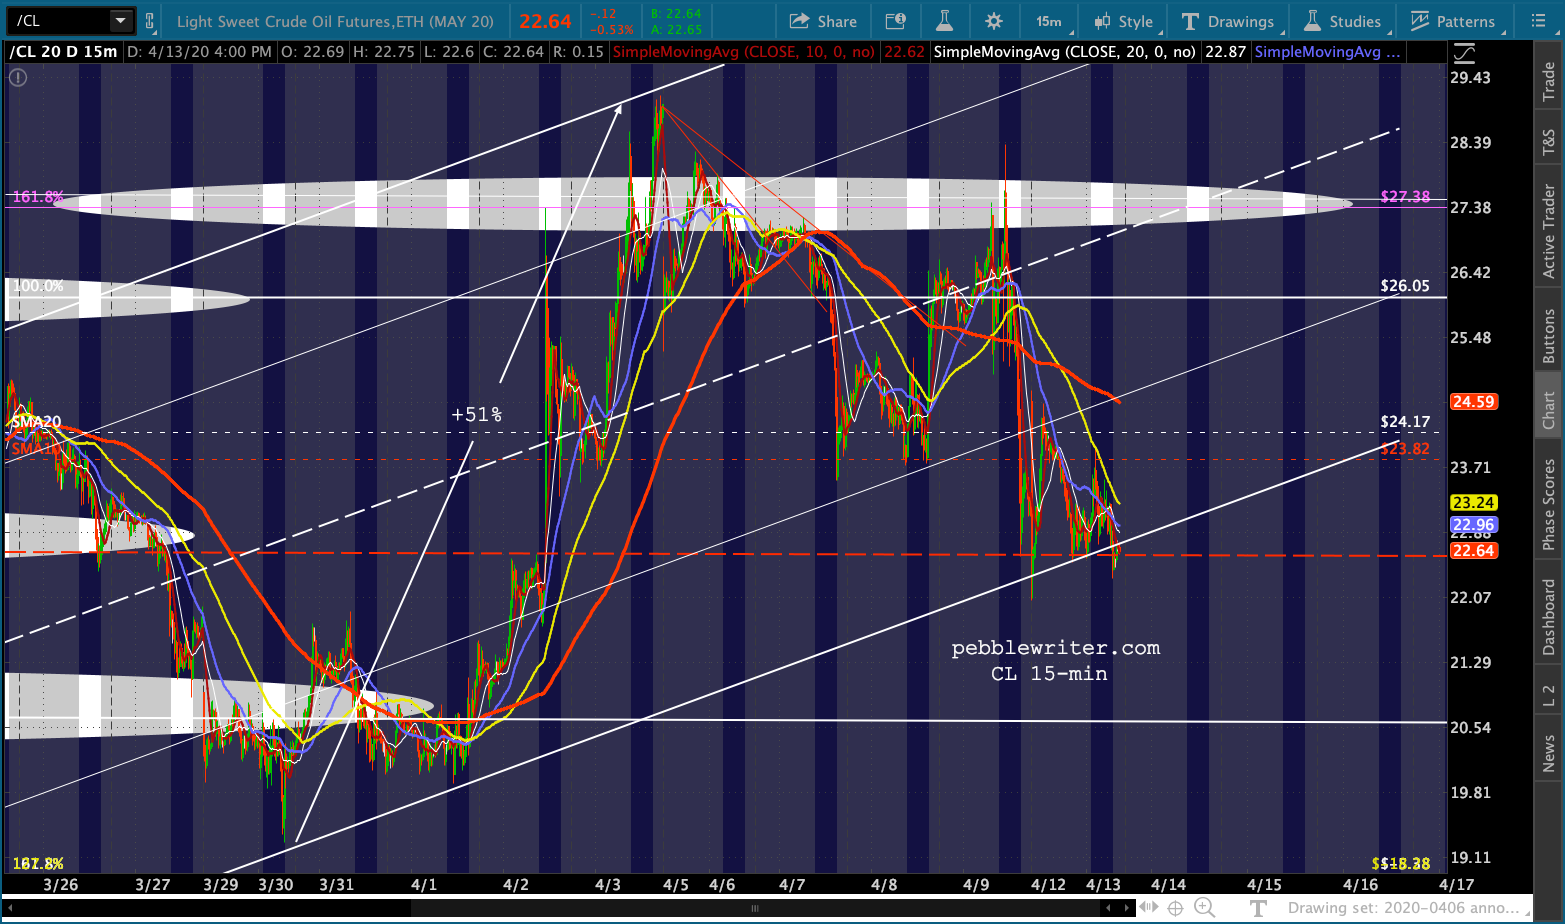
Otherwise, you’d never expect to see CL bounce precisely at the bottom of a channel from its Mar 30 lows. Could it be related to Trump’s tweet (right as the market opened) that the 10mm bpd cut OPEC already announced was supposed to be 20mm?
 From OPEC’s press release on Friday:
In view of the current fundamentals and the consensus market perspectives, the Participating Countries agreed to…adjust downwards their overall crude oil production by 10.0 mb/d, starting on 1 May 2020, for an initial period of two months that concludes on 30 June 2020.
Following the two month reduction (from inflated levels, mind you) the amount of the cut actually declines to 8mm bpd for the remainder of the year, then to 6mm bpd for the next 16 months. Even at 20mm, there is still as much as 15mm bpd too much oil being produced every single day. Trump’s tweet just doesn’t reflect reality…”to put it mildly.”
As we watch stock futures ramp higher into the open for the sixth session in a row, is it any wonder that oil is as manipulated as it is?
continued for members…Remember, it’s all about maintaining an uptrend to support stocks…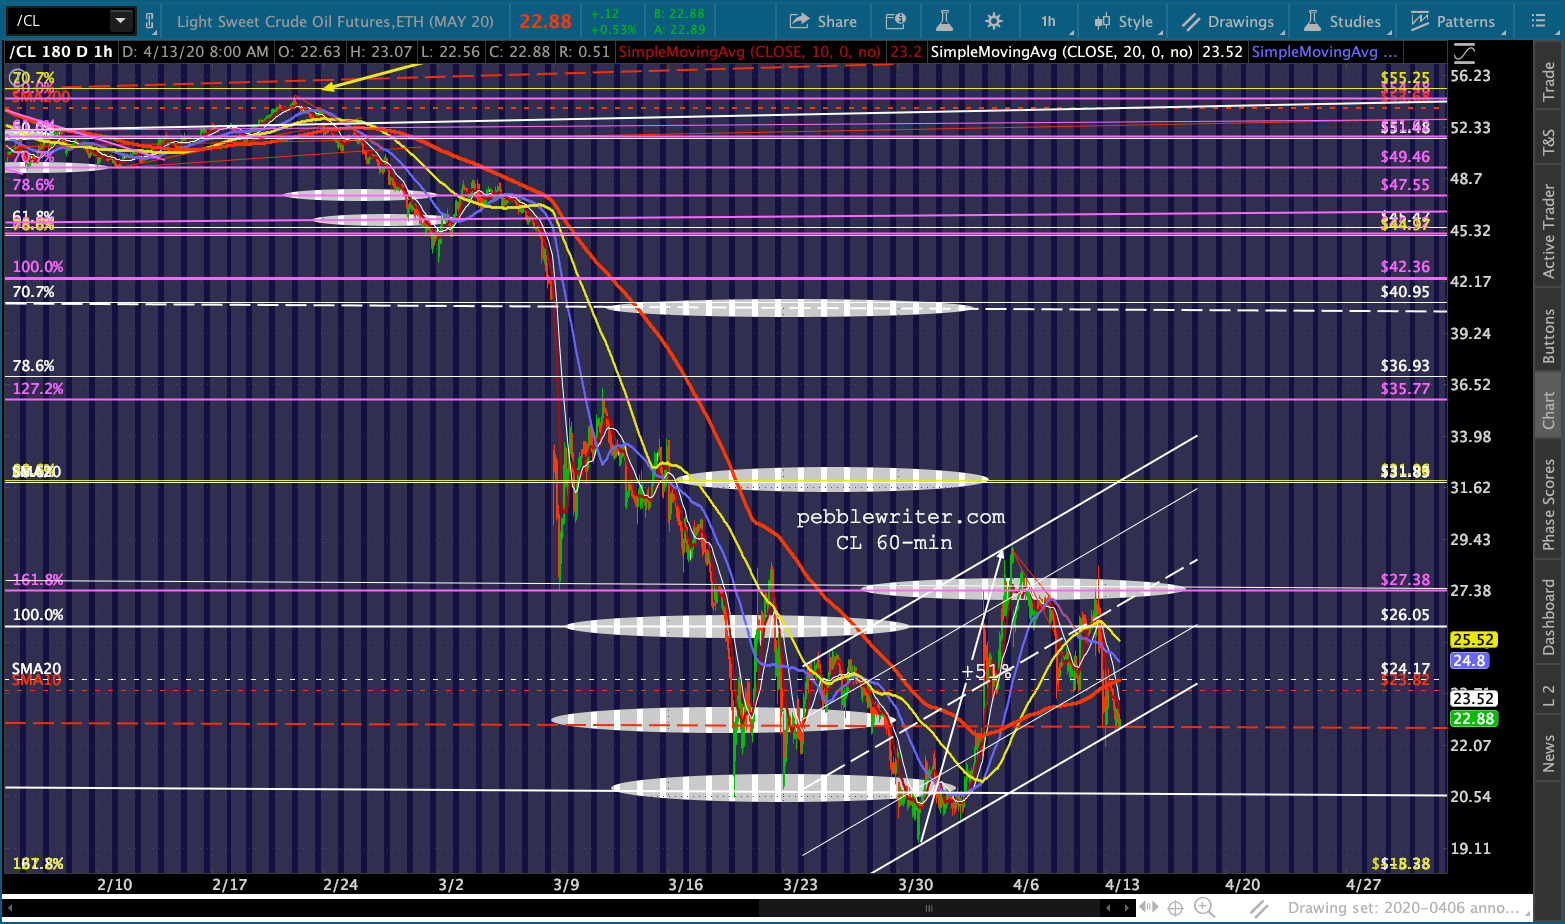 …and holding above the channel bottom and the red TL connecting the major lows.
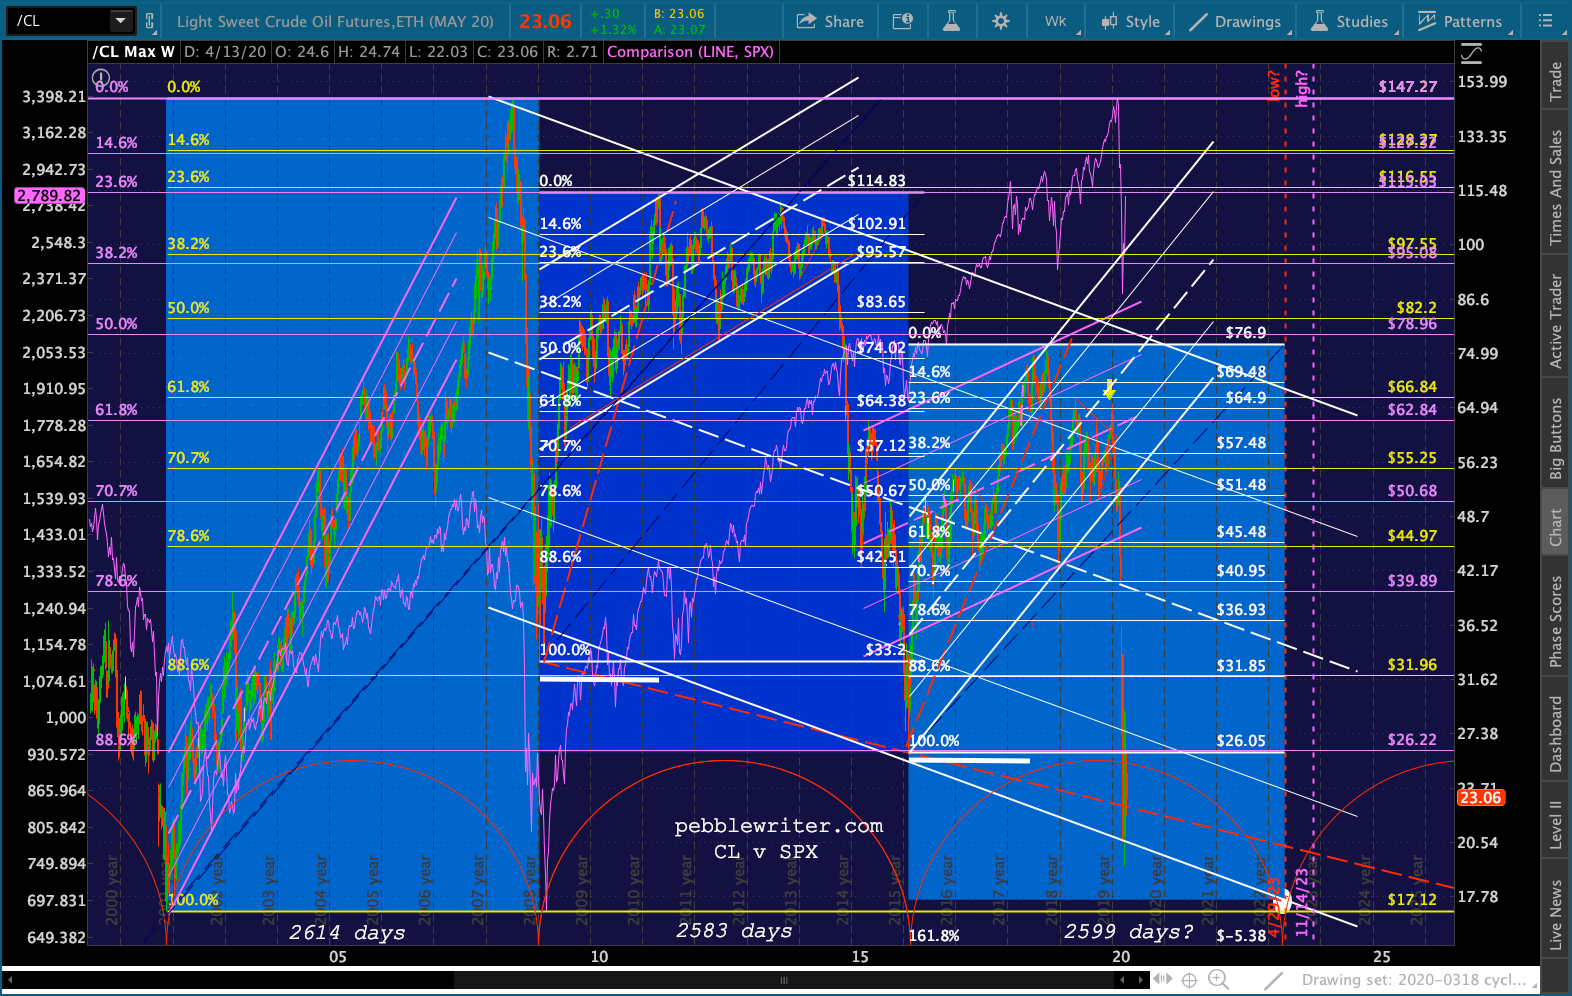
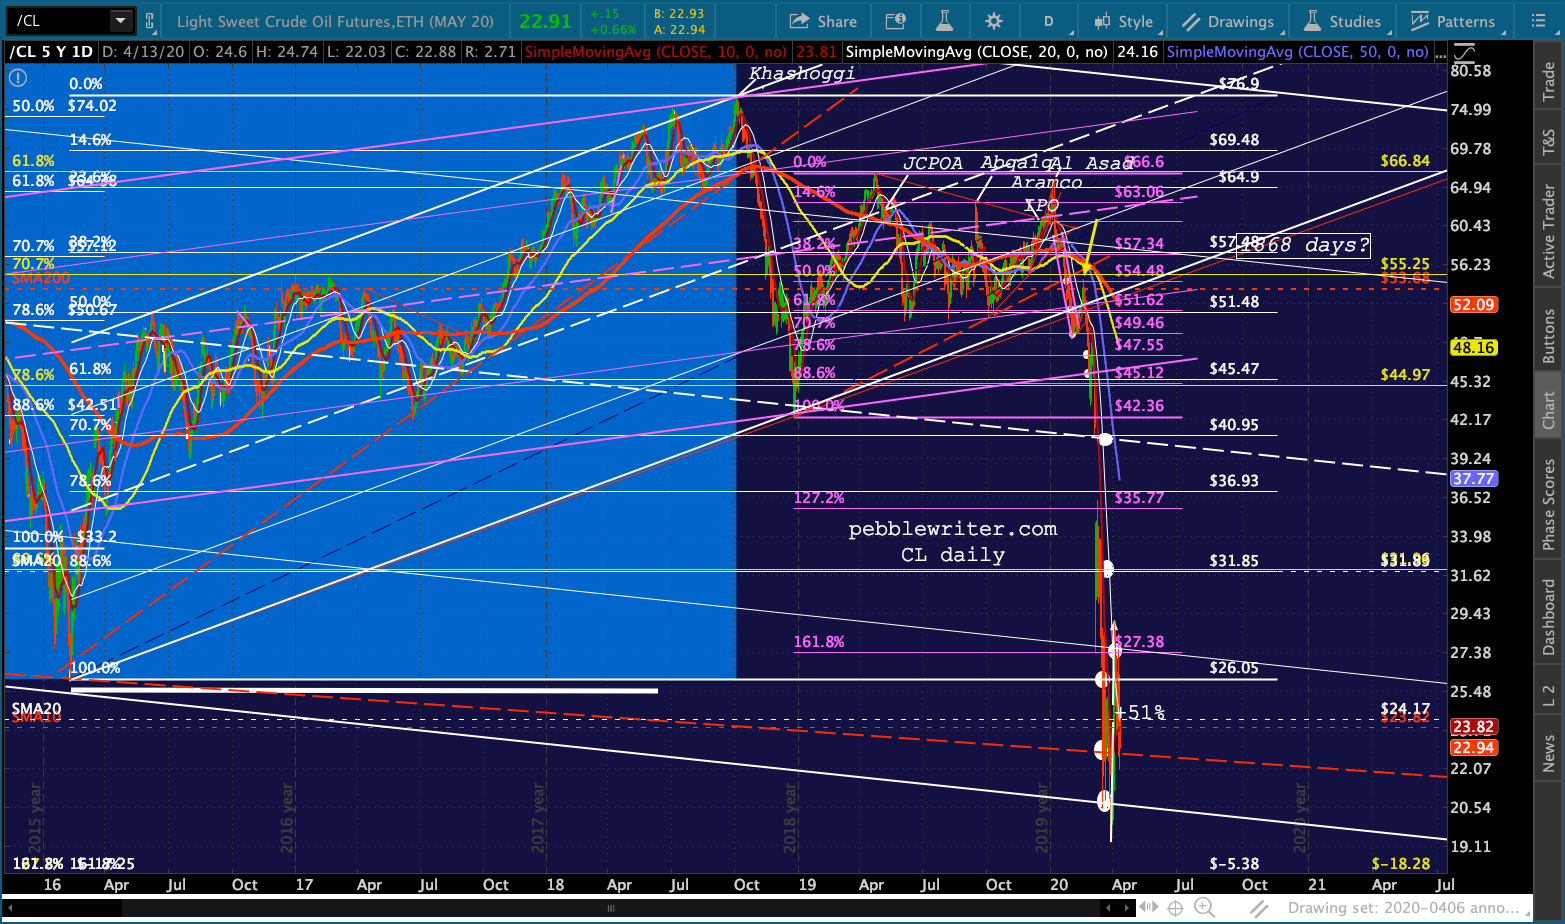
CL has formed and dropped through the neckline (@ 23.52) of a little H&S targeting 17.91. If it has trouble pushing back above 23.52, we could conceivably see new lows.
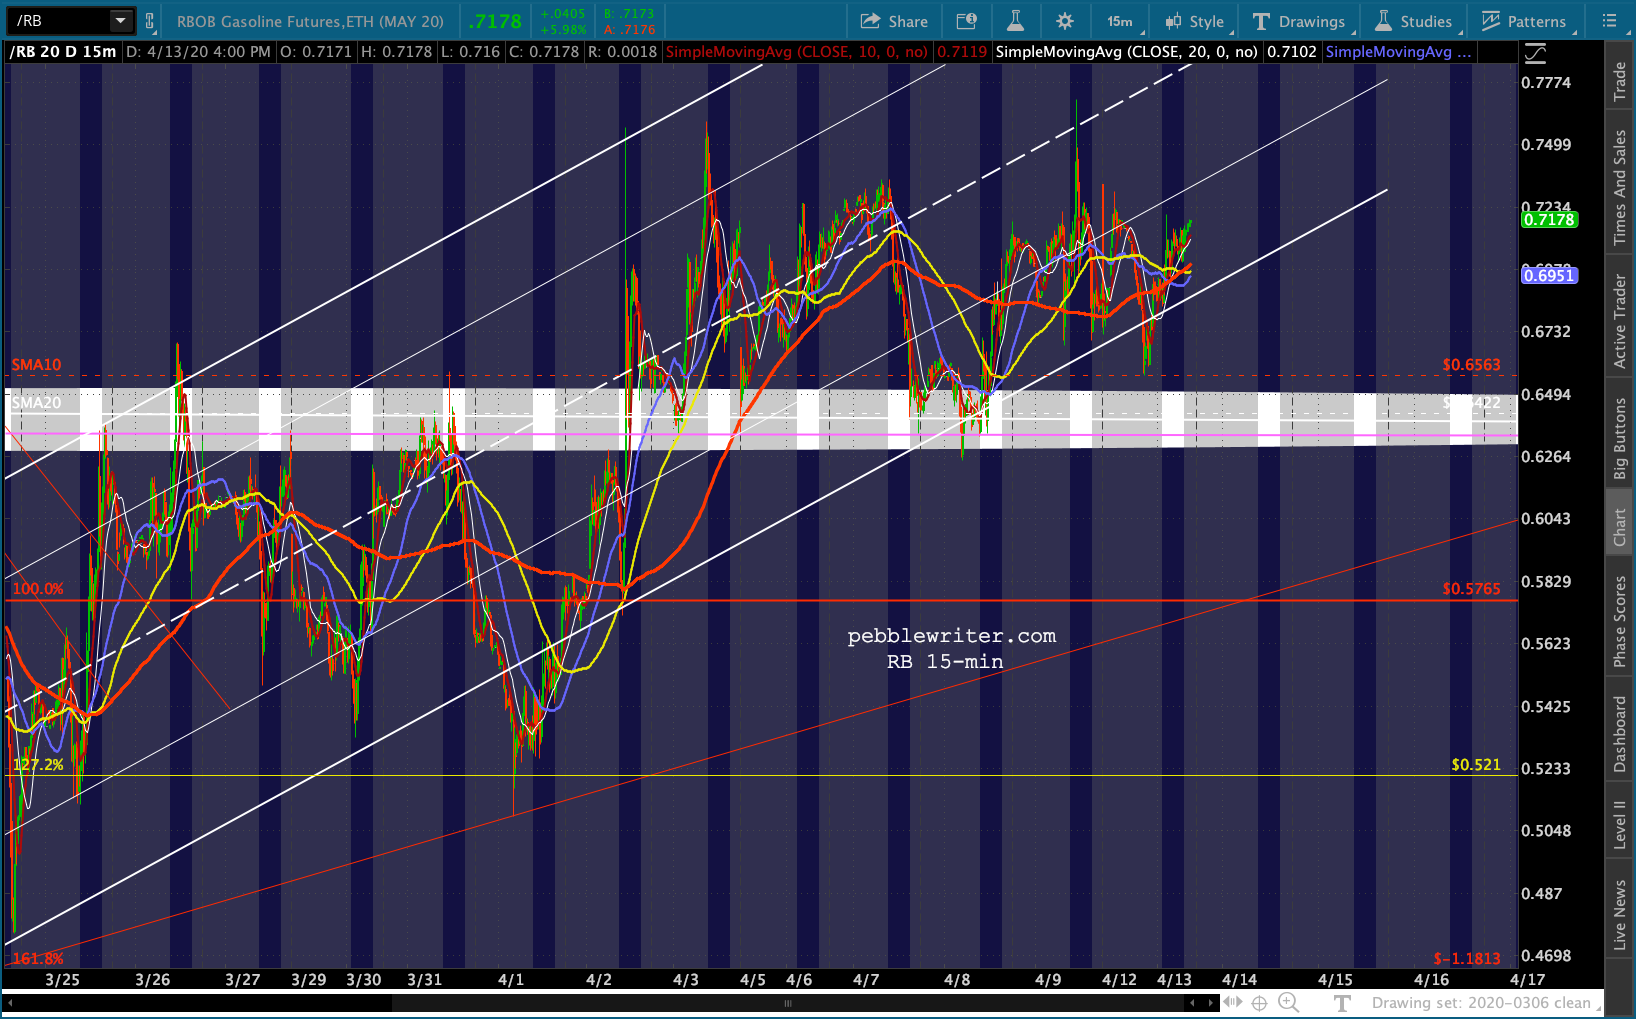
Ditto for RB – though it’s probably seeking a widening of its price channel to accommodate the obvious breakdown on April 1.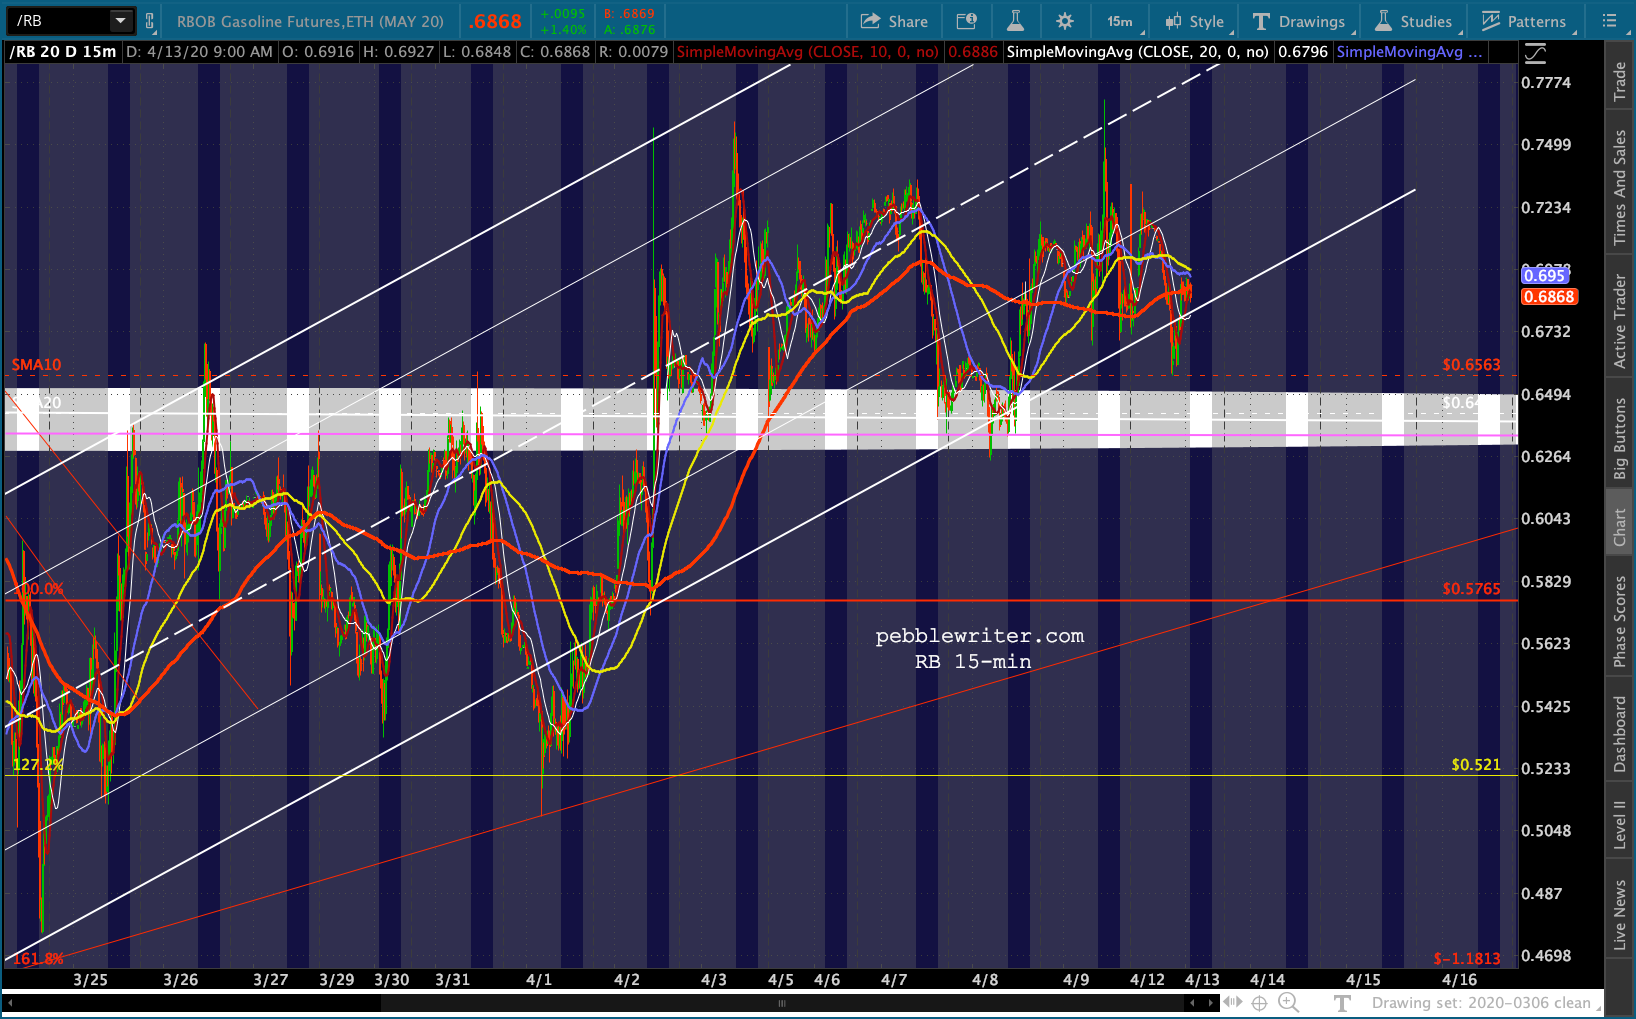 ES, which had dropped about 100 points from their Sunday highs, are working their way back to even as the open approaches.
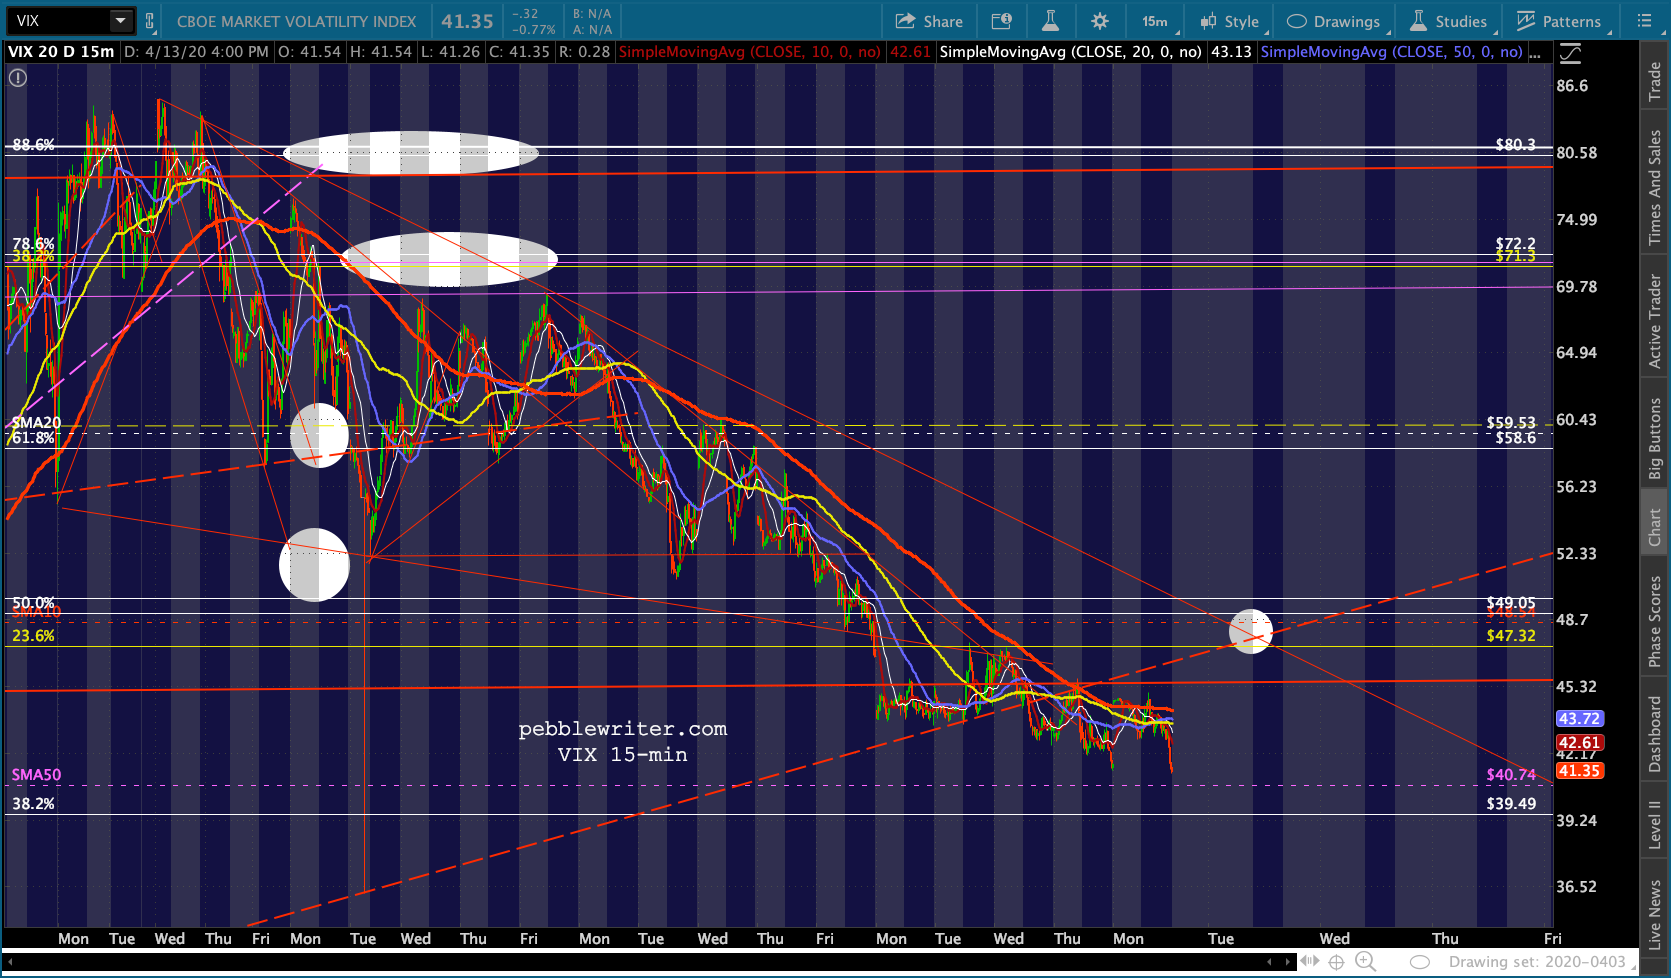
 Thanks largely to oil’s bounce, but also to VIX’s continued slump…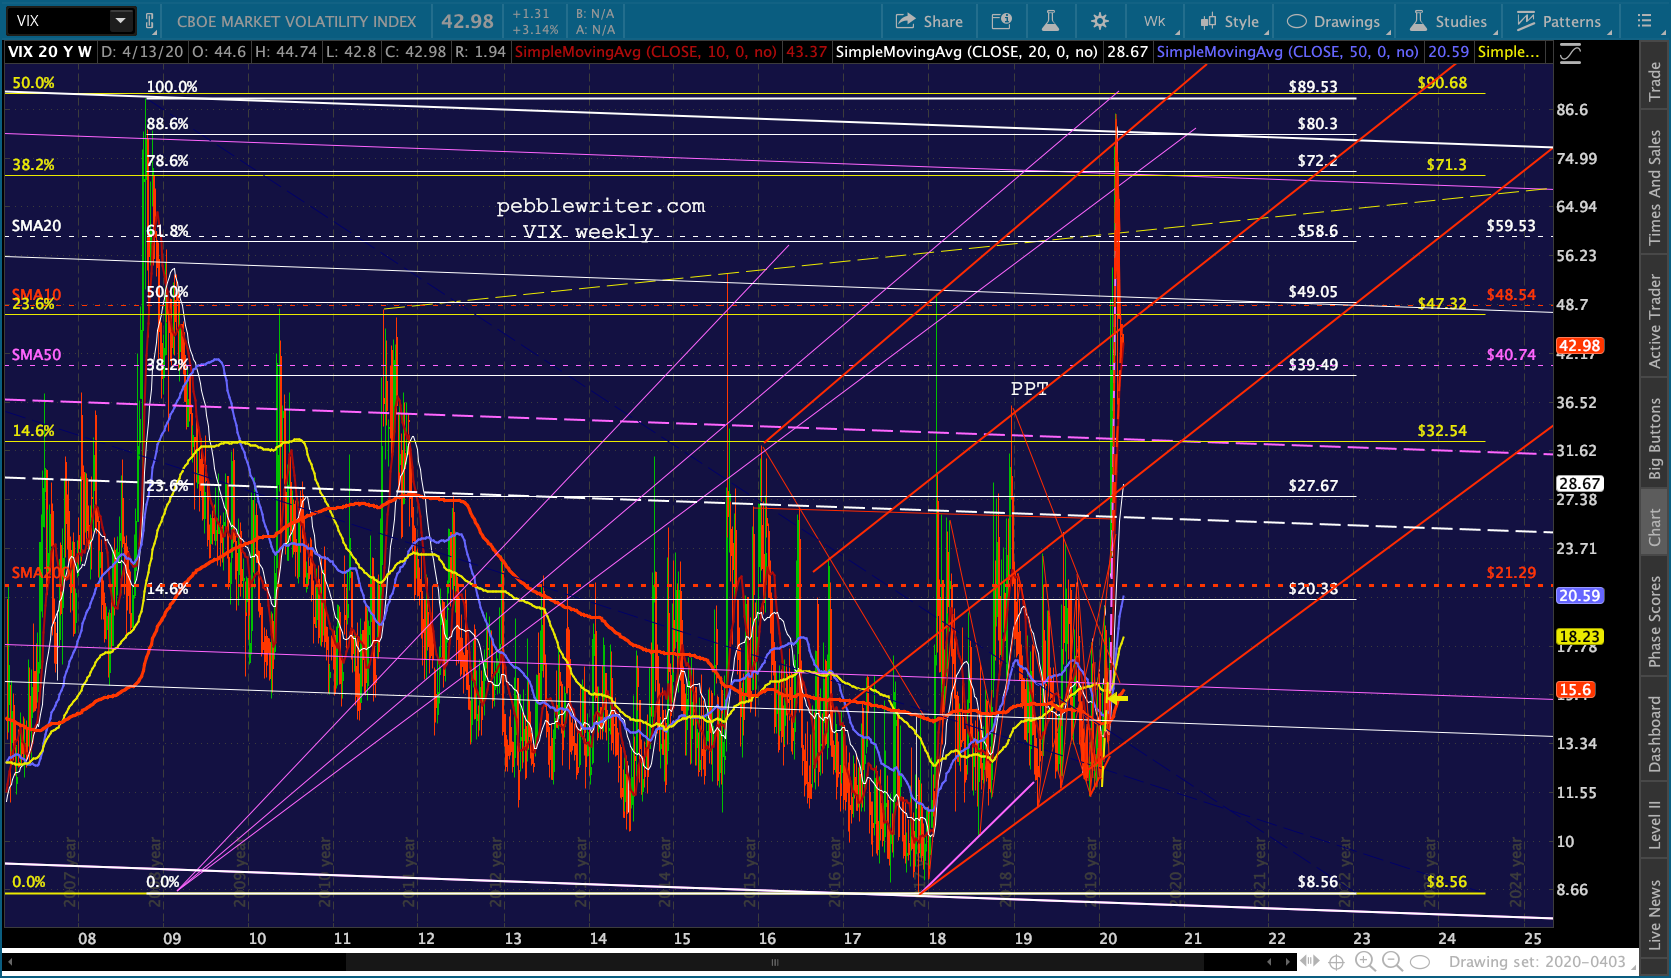
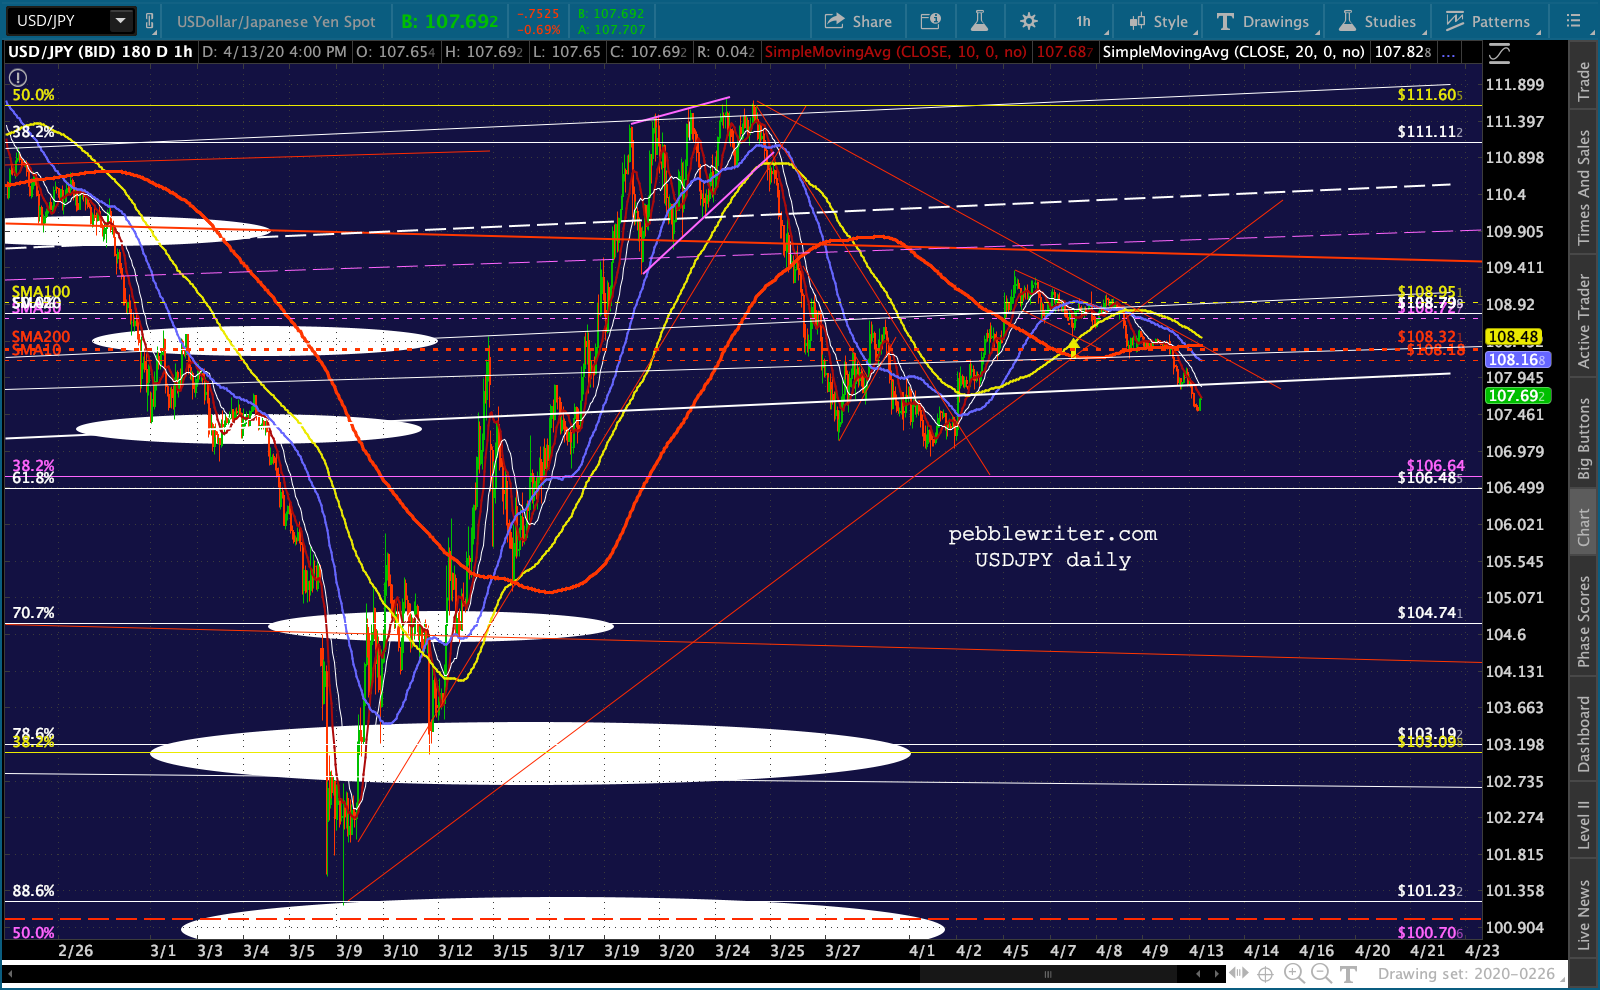
 …and USDJPY’s timely stall at the bottom of the rising white channel – the channel that will apparently ignore the huge breakdown in early March. Note that we’re back below the SMA200 – a warning sign for stocks if it continues any lower.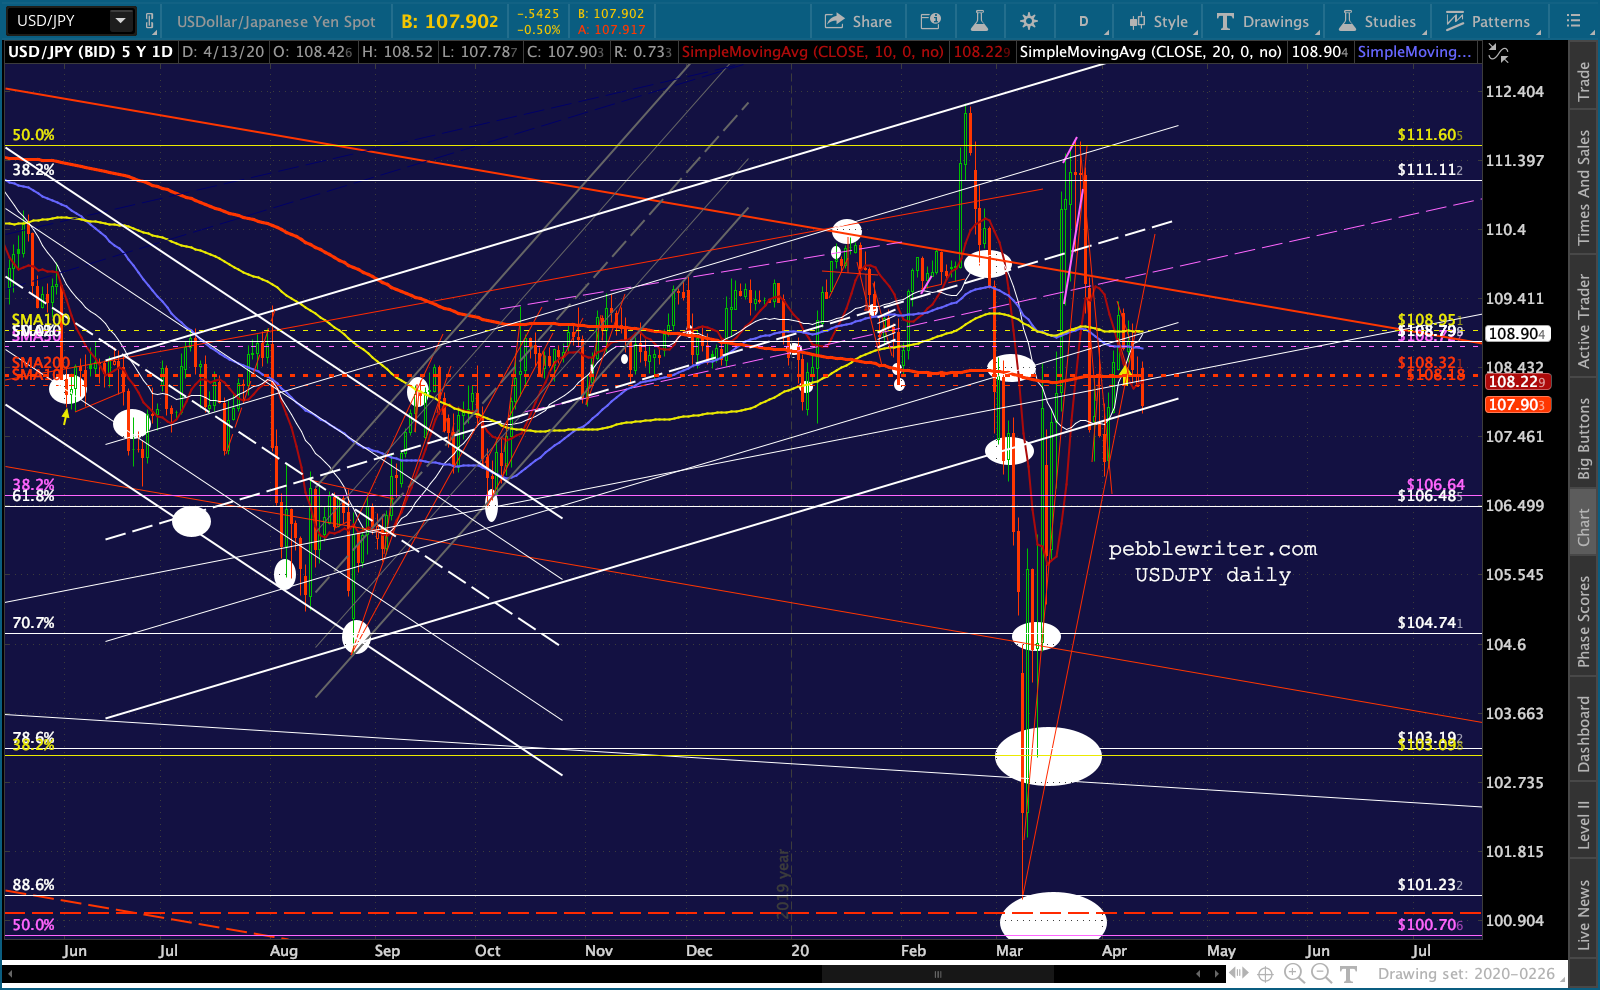
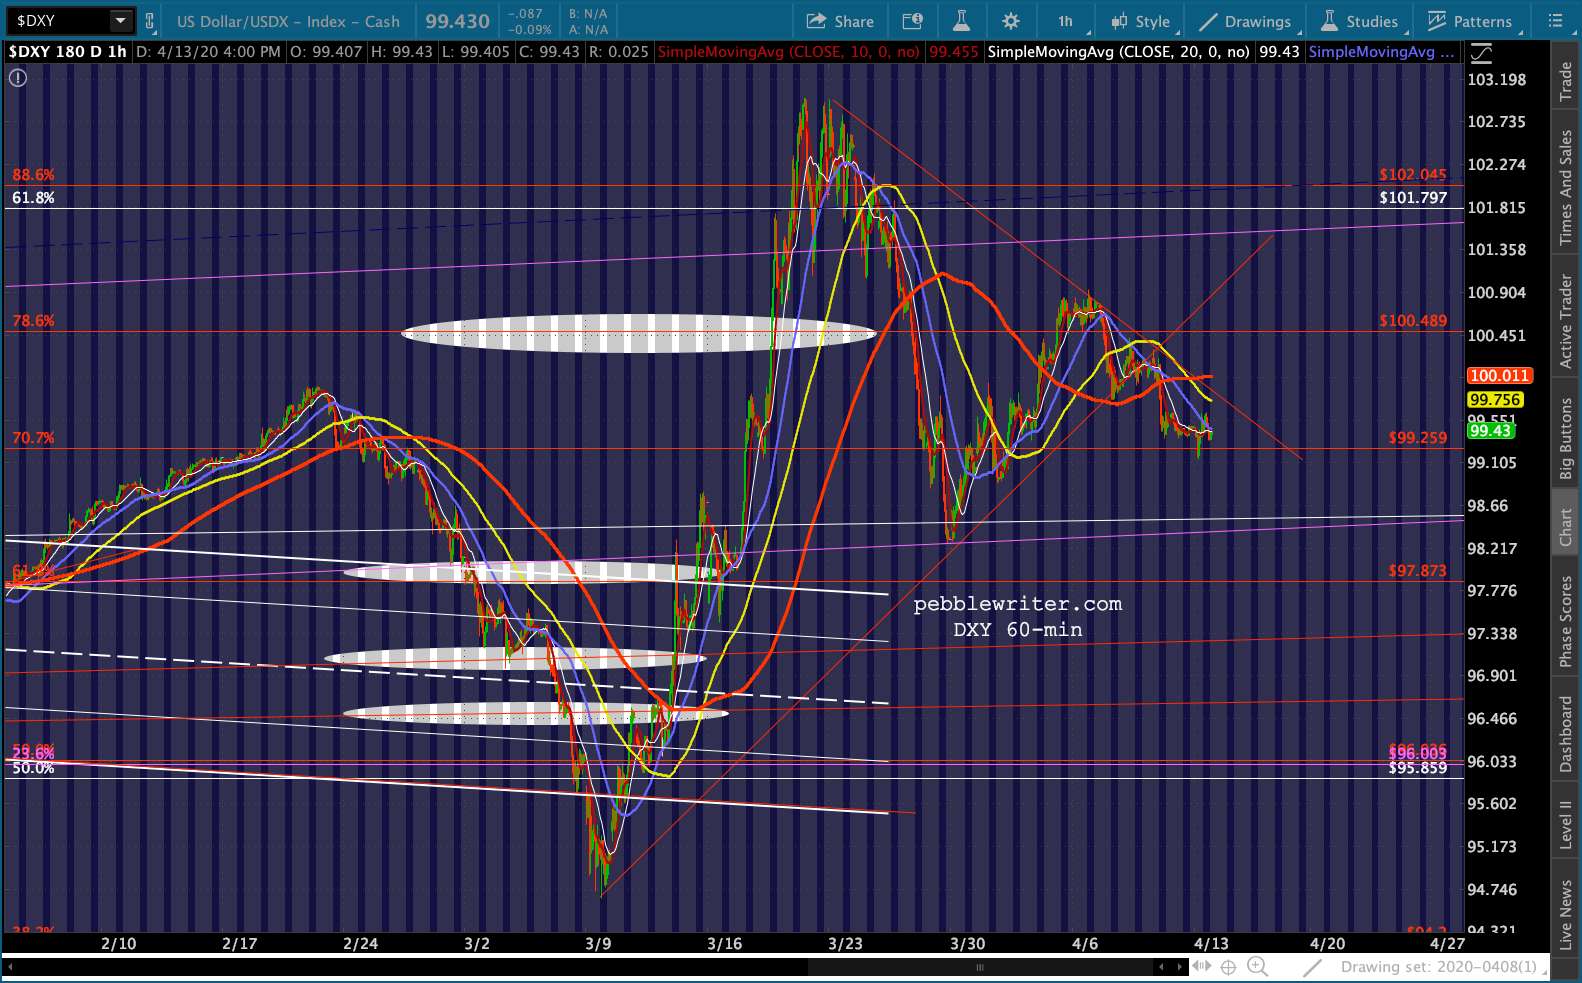
Although DXY has still broken down…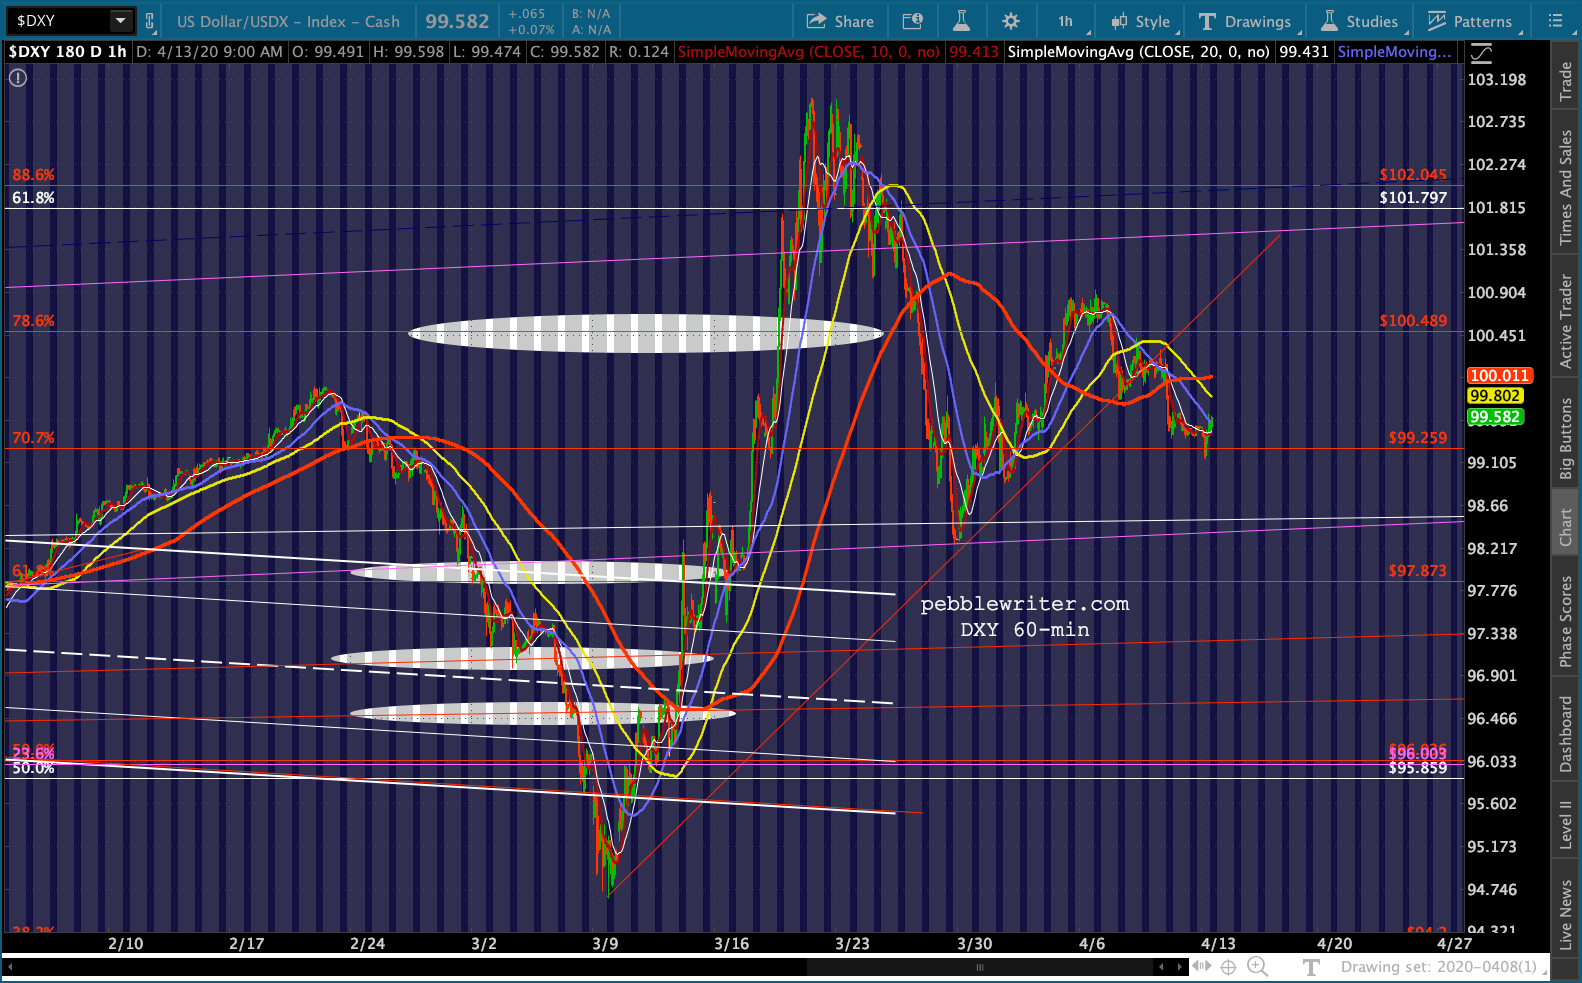
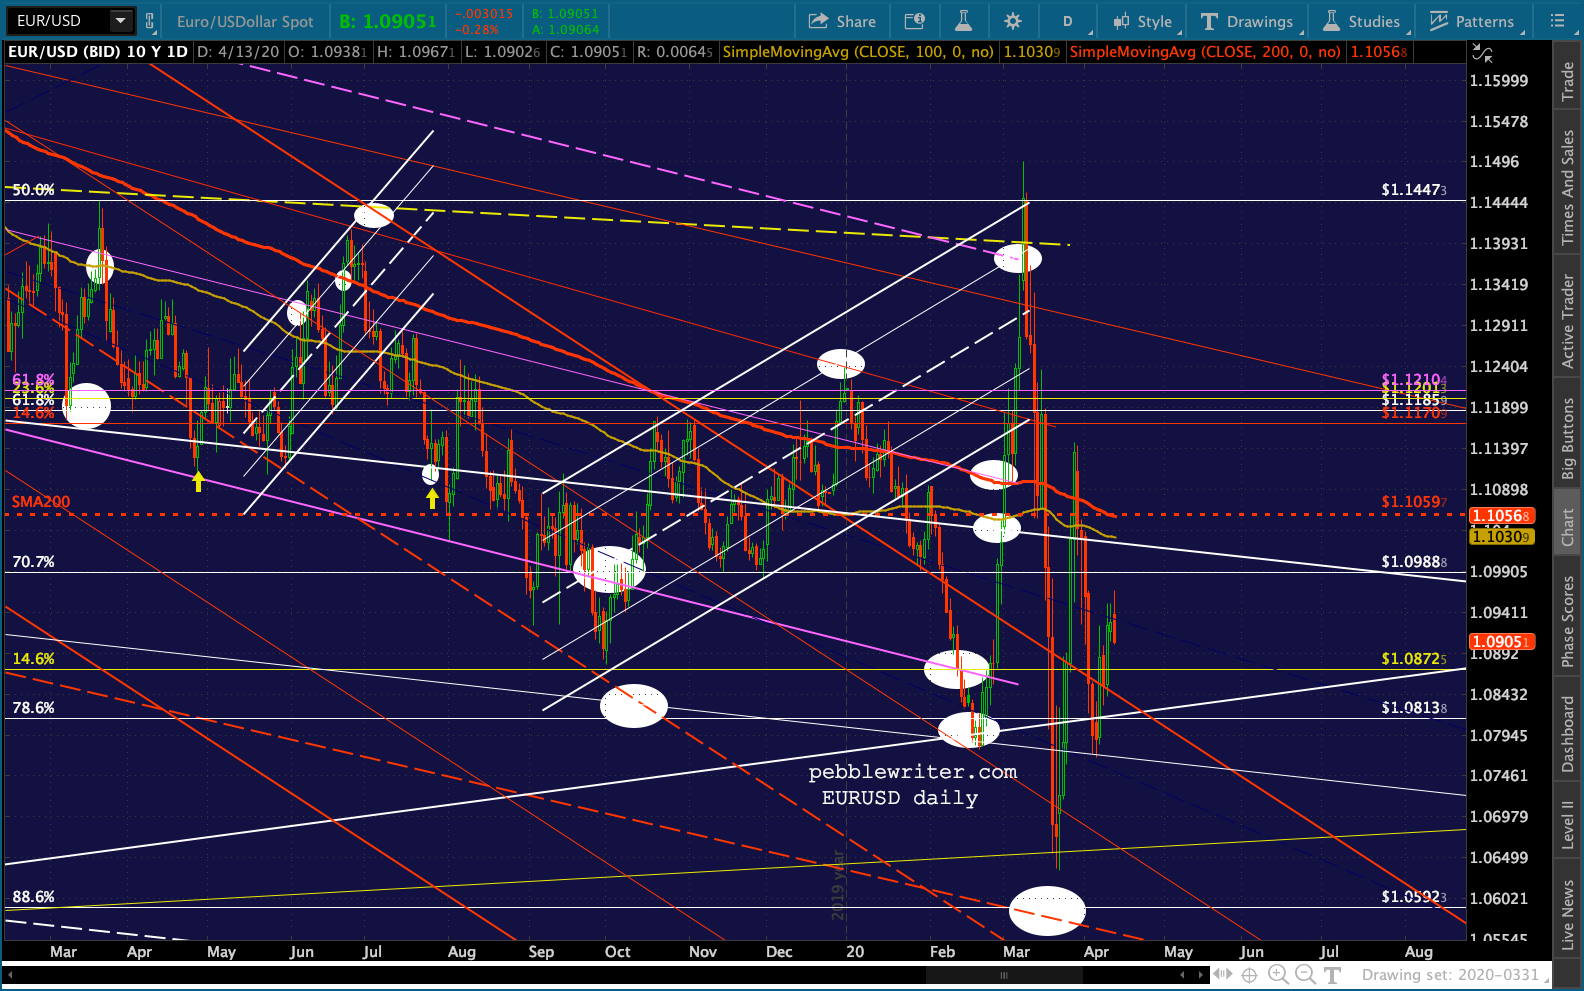
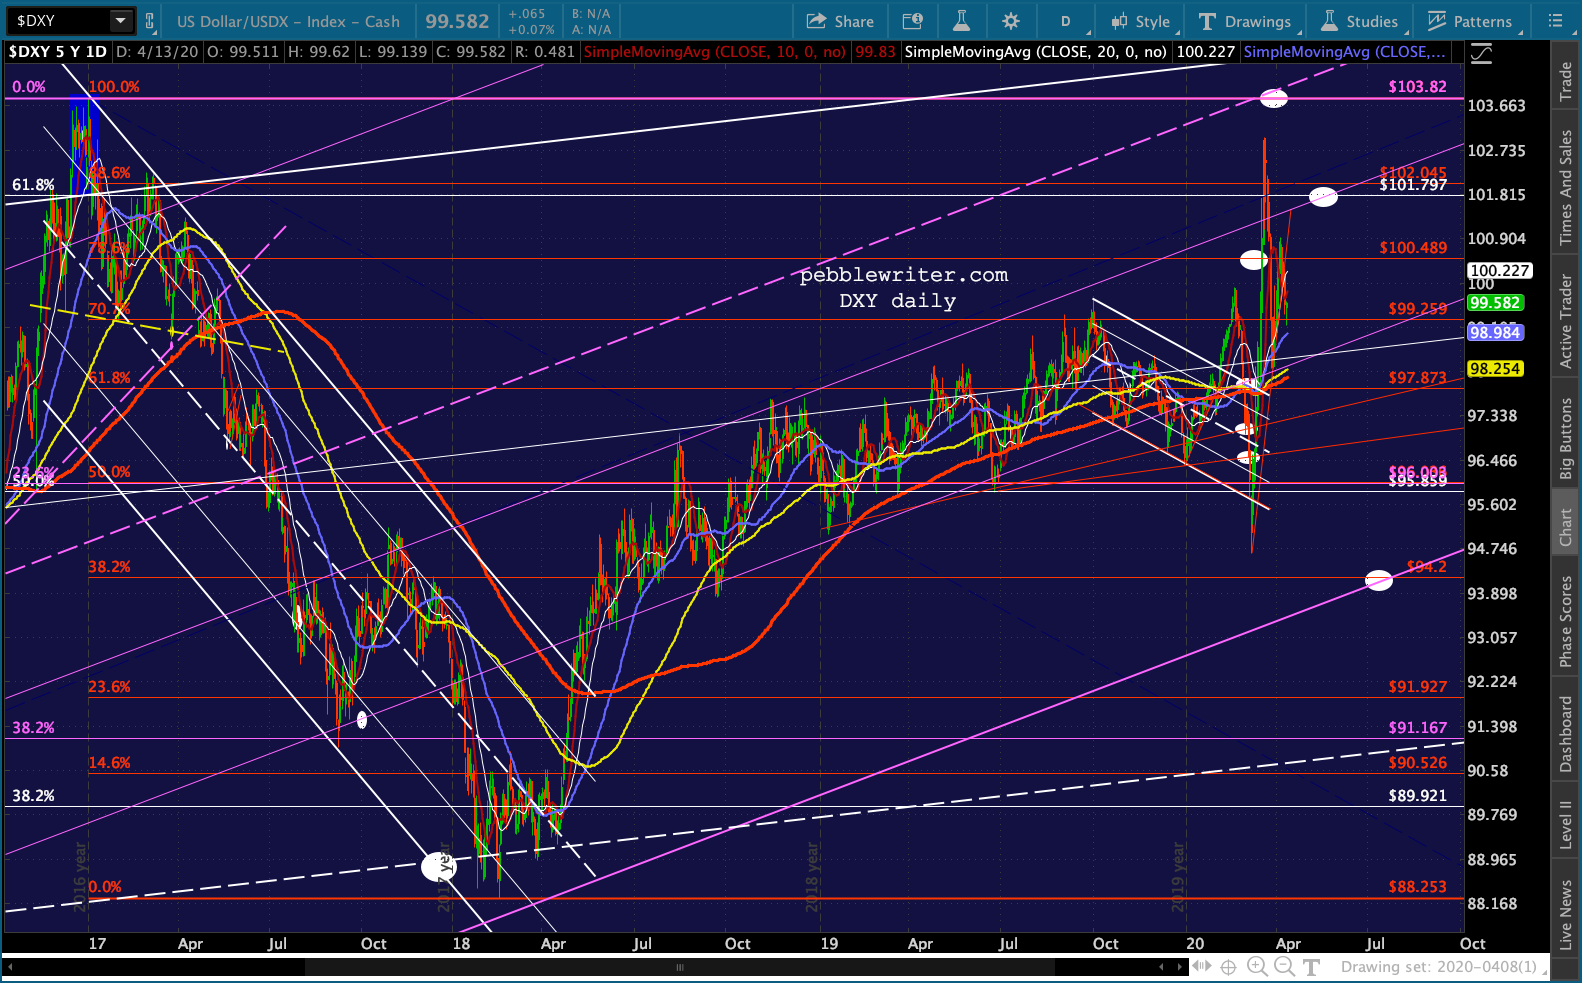 …the euro is sliding enough to prop it up.
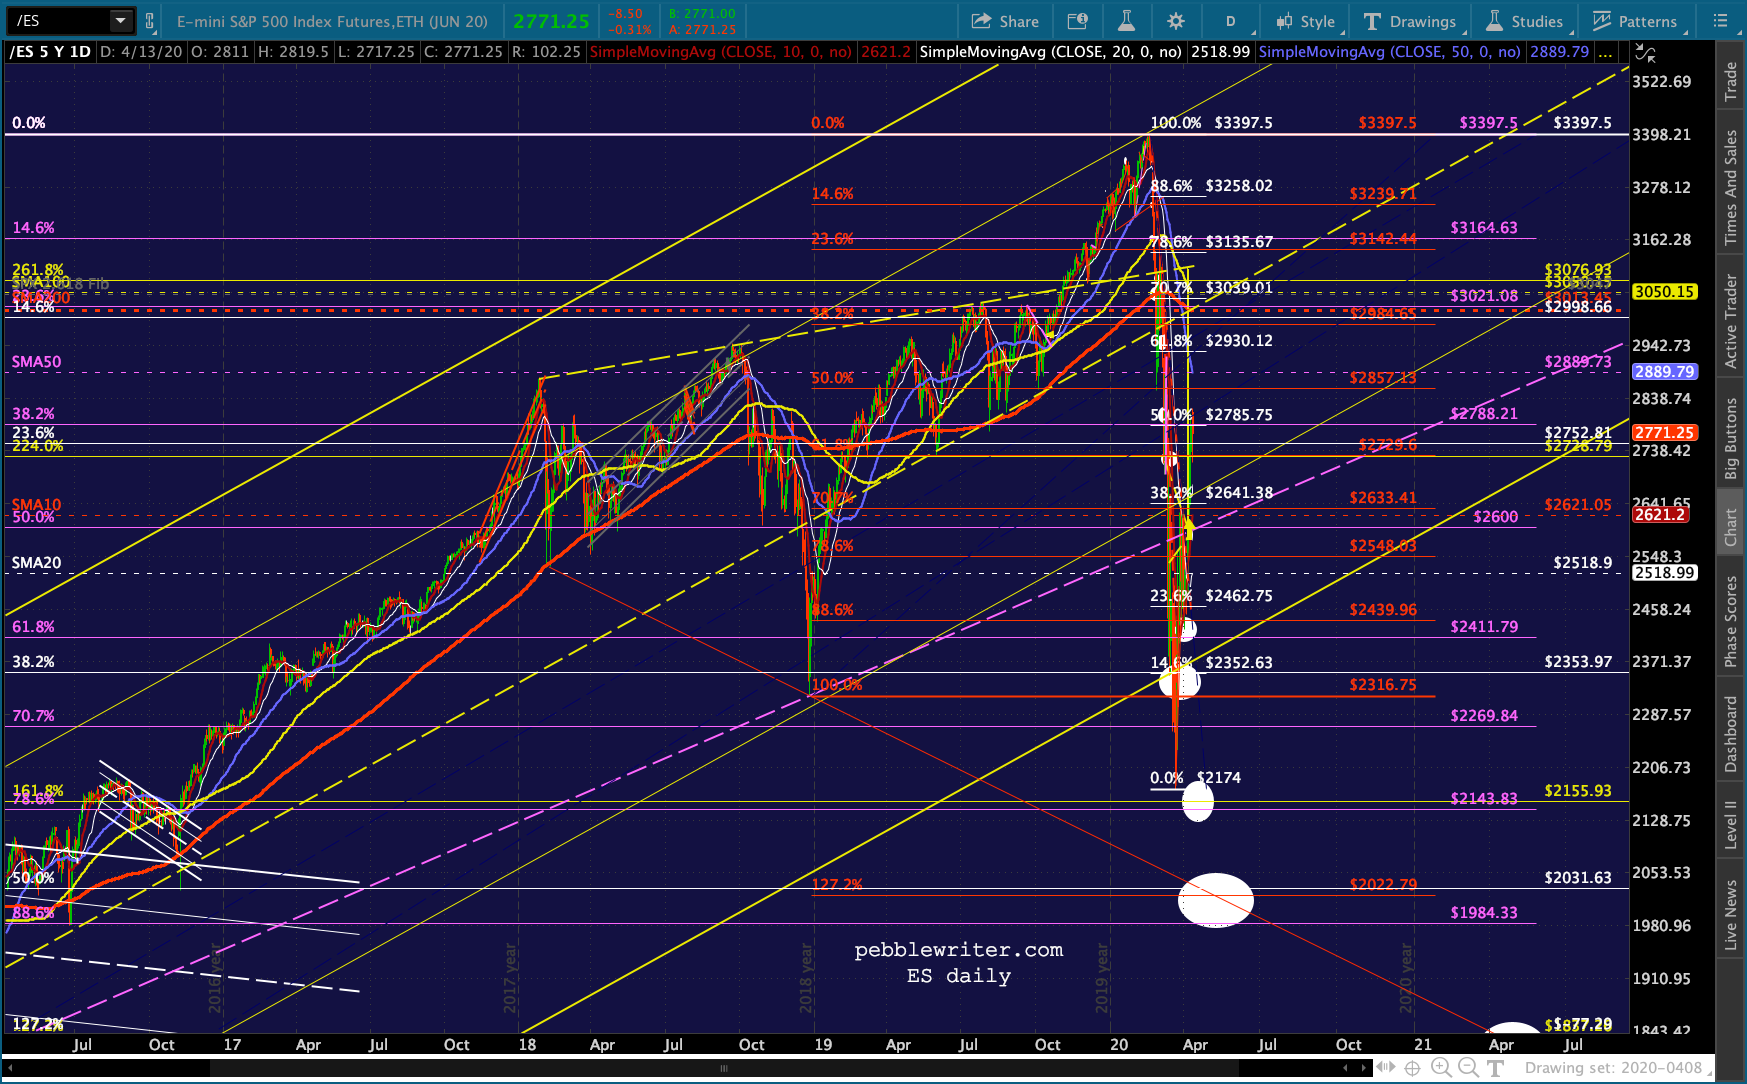
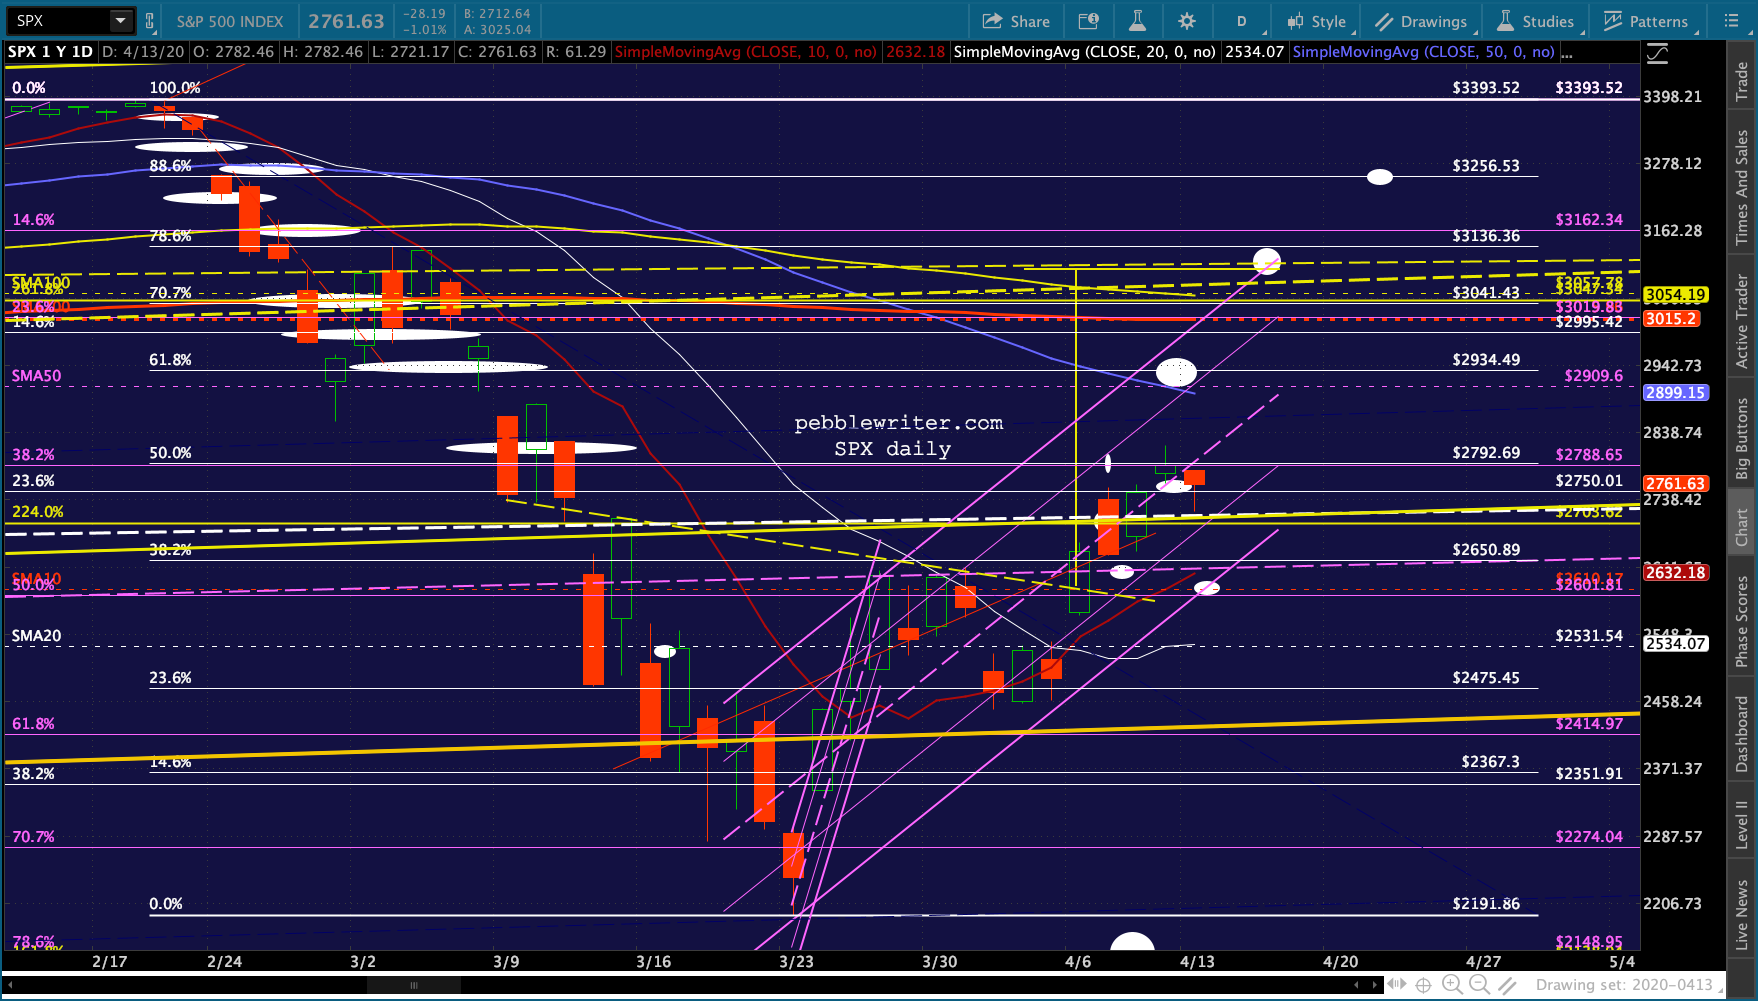
 It’s looking dicey for SPX’s backtest – which should have happened last Wednesday. It would need to happen today if it’s going to happen and still remain inside the rising purple channel. It would be a pretty massive breakdown, about 190 points off Friday’s close.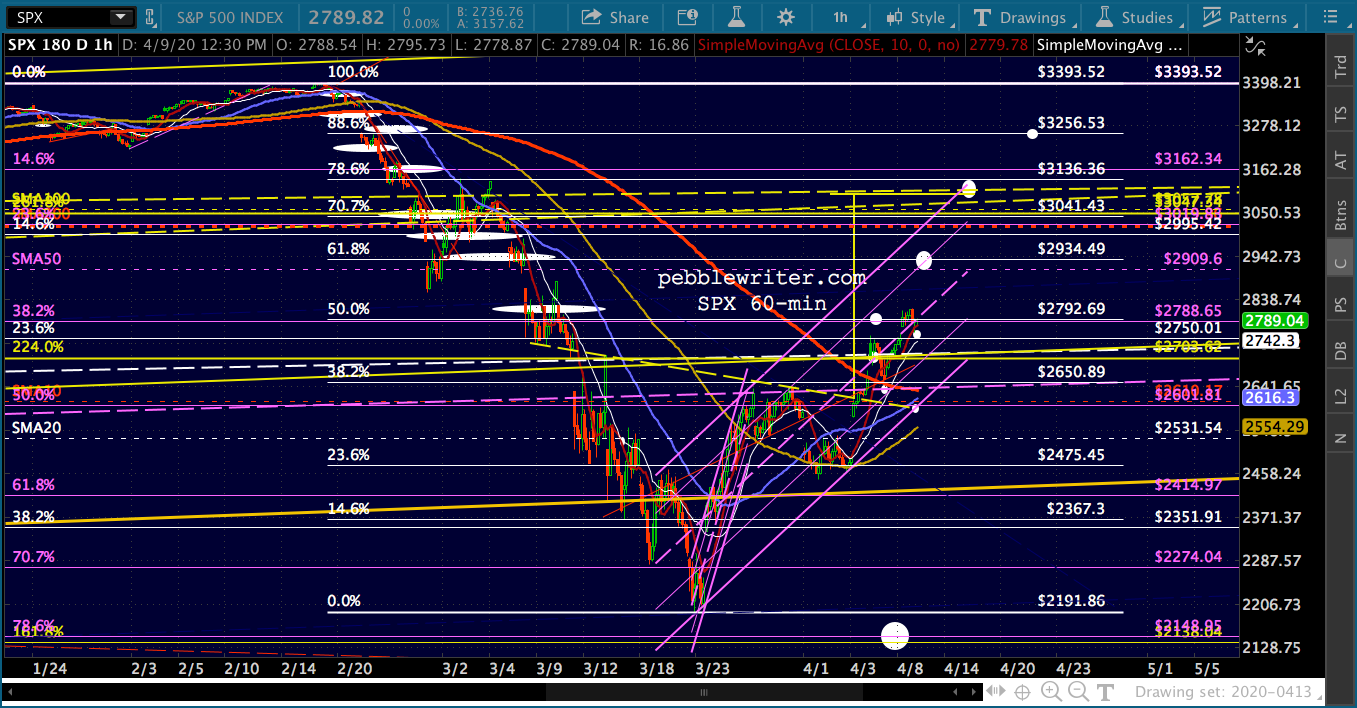
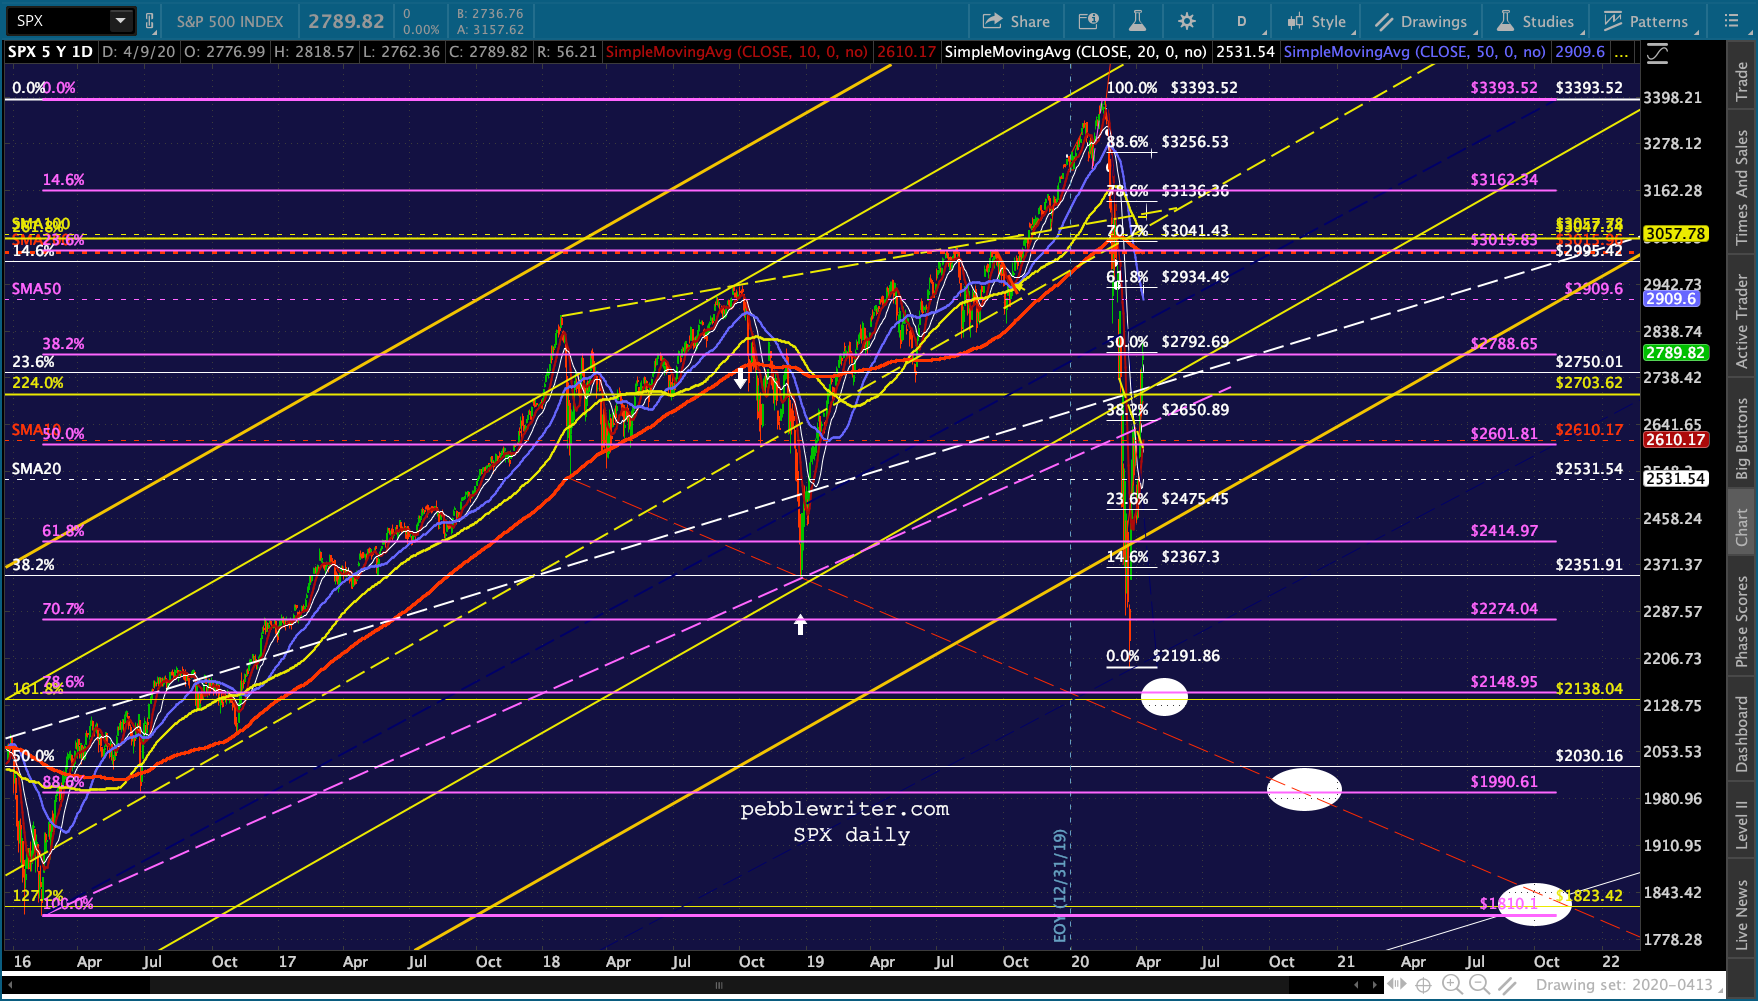 I’m not saying it can’t happen, but a lot of support would need to give way in order to register that big a drop.
We can see numerous H&S Patterns that almost completed, but the right shoulder never completed due to premarket ramp jobs. This speaks to the ongoing effort to do whatever it takes to maintain stocks’ rally which has pulled back from the .500 Fib retracement of the Feb-Mar 35% drop.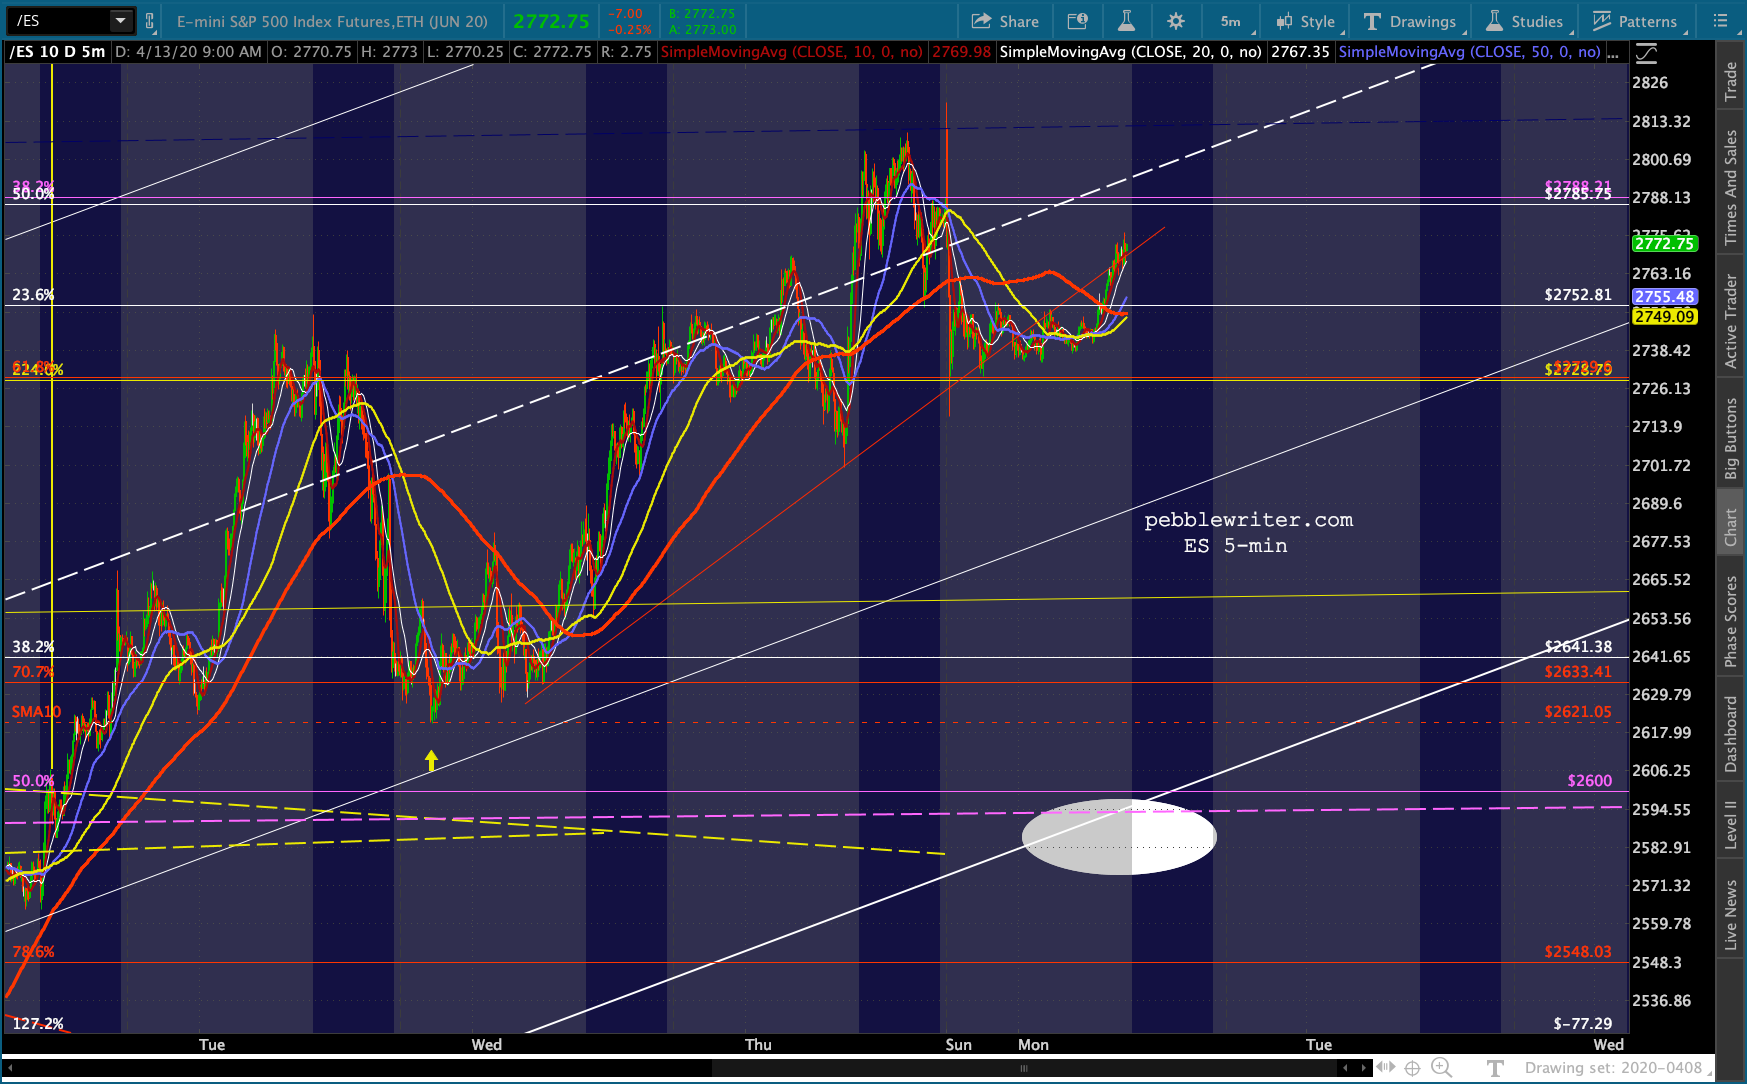 The bond market is amenable to a pullback here, with the 2s10s edging slightly above 48 bps but sliding lower as the open approaches.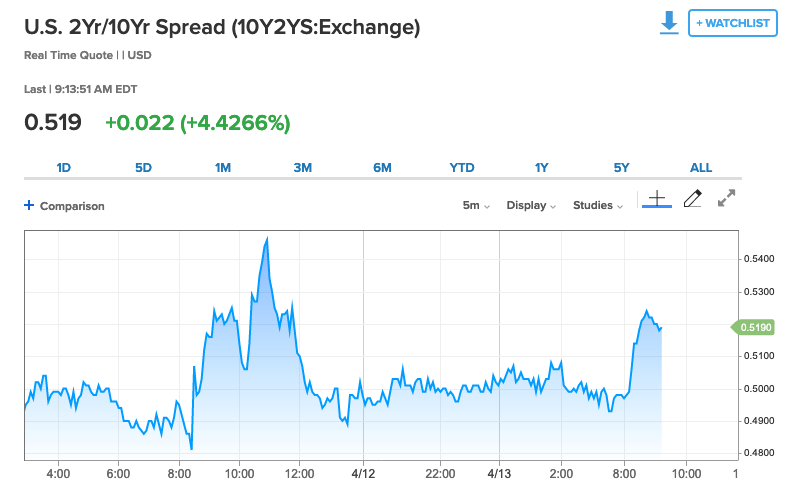
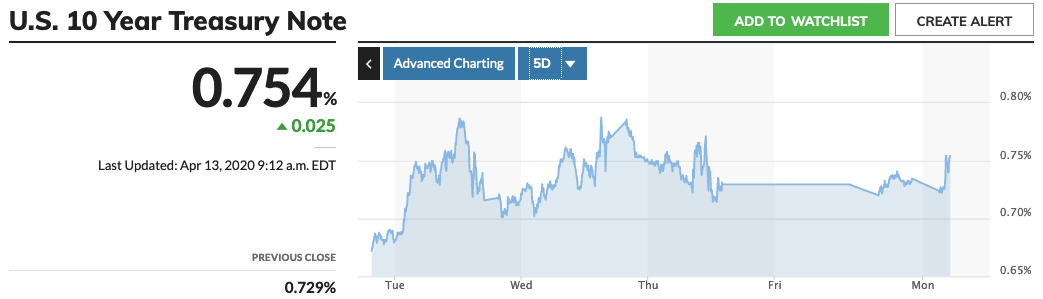
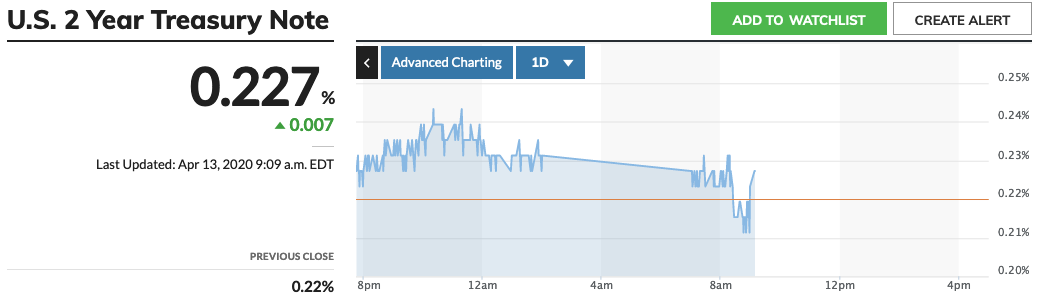
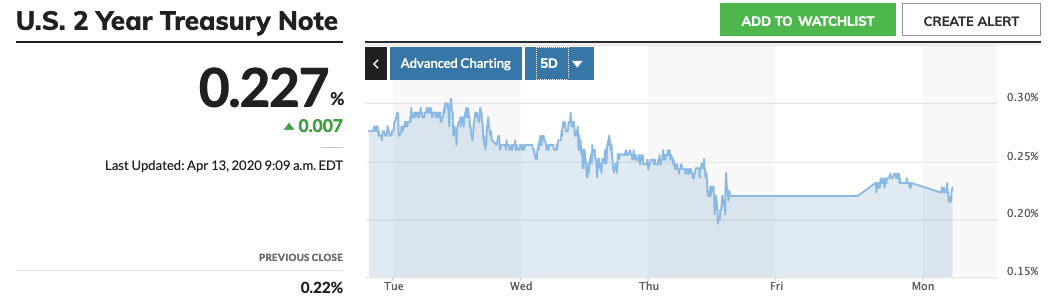 The 2Y appears ready to bounce to close the gap just enough.
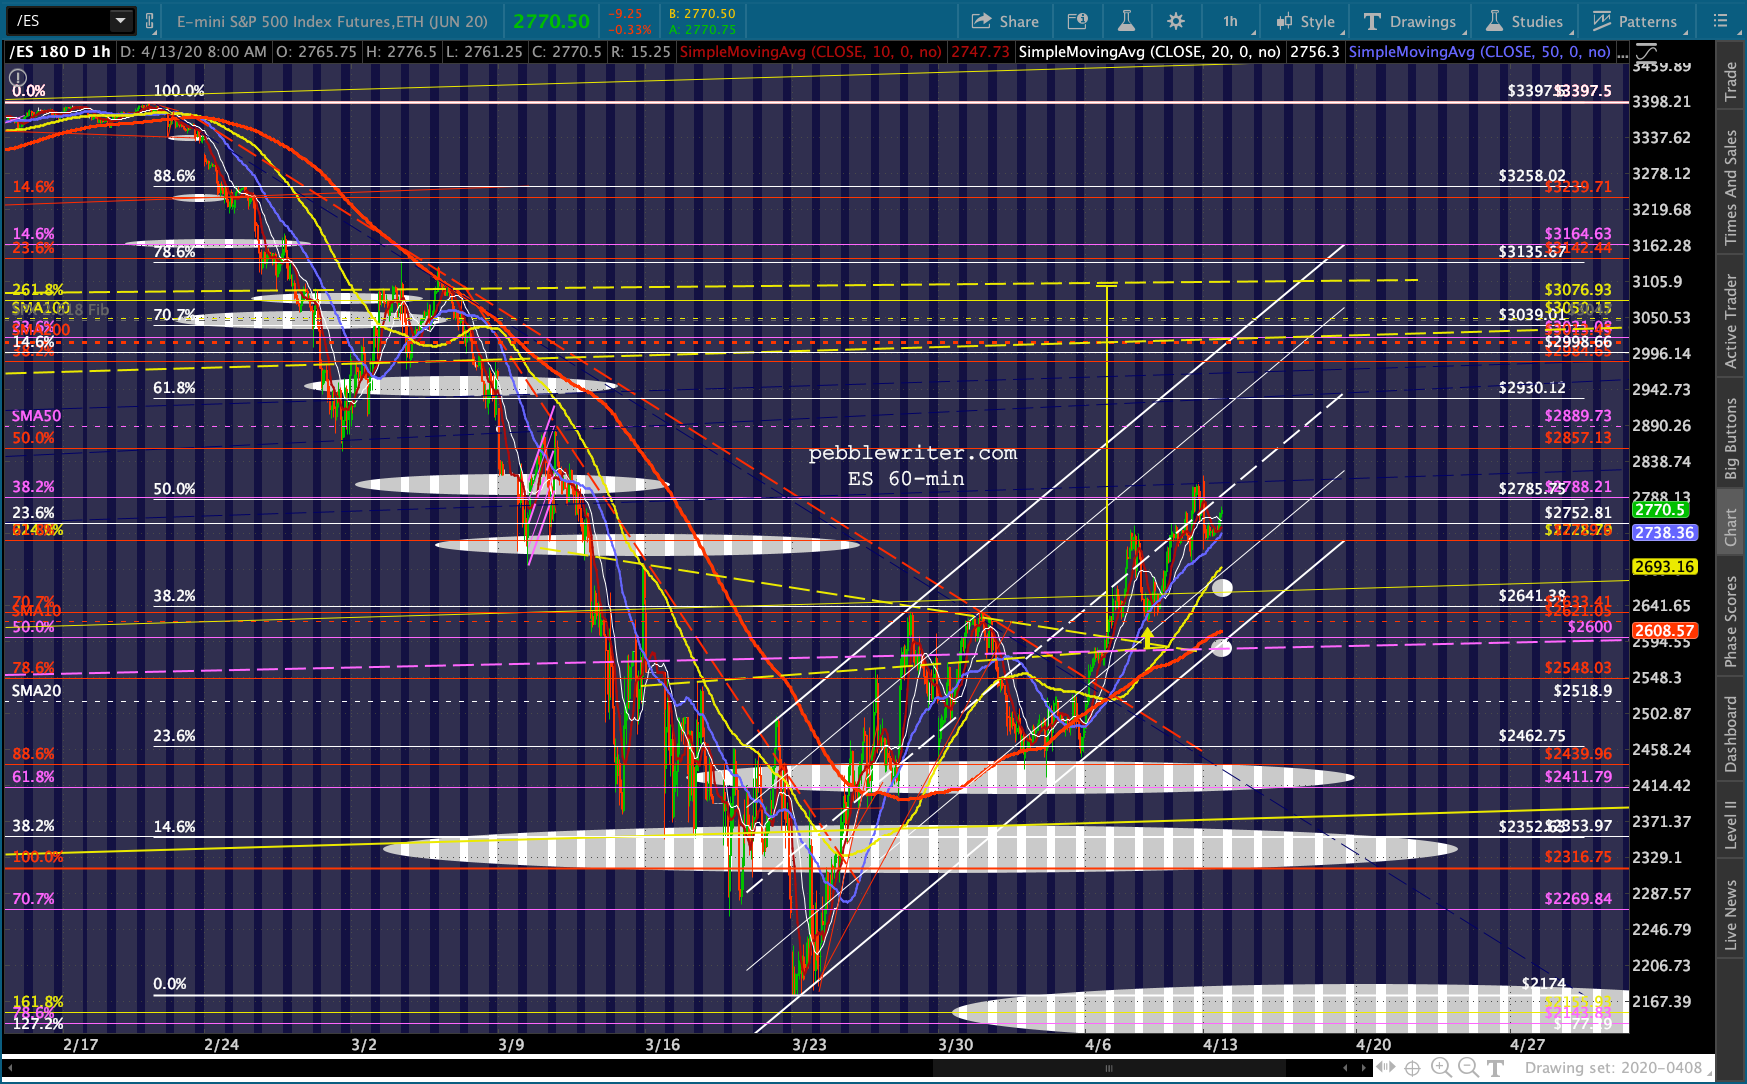
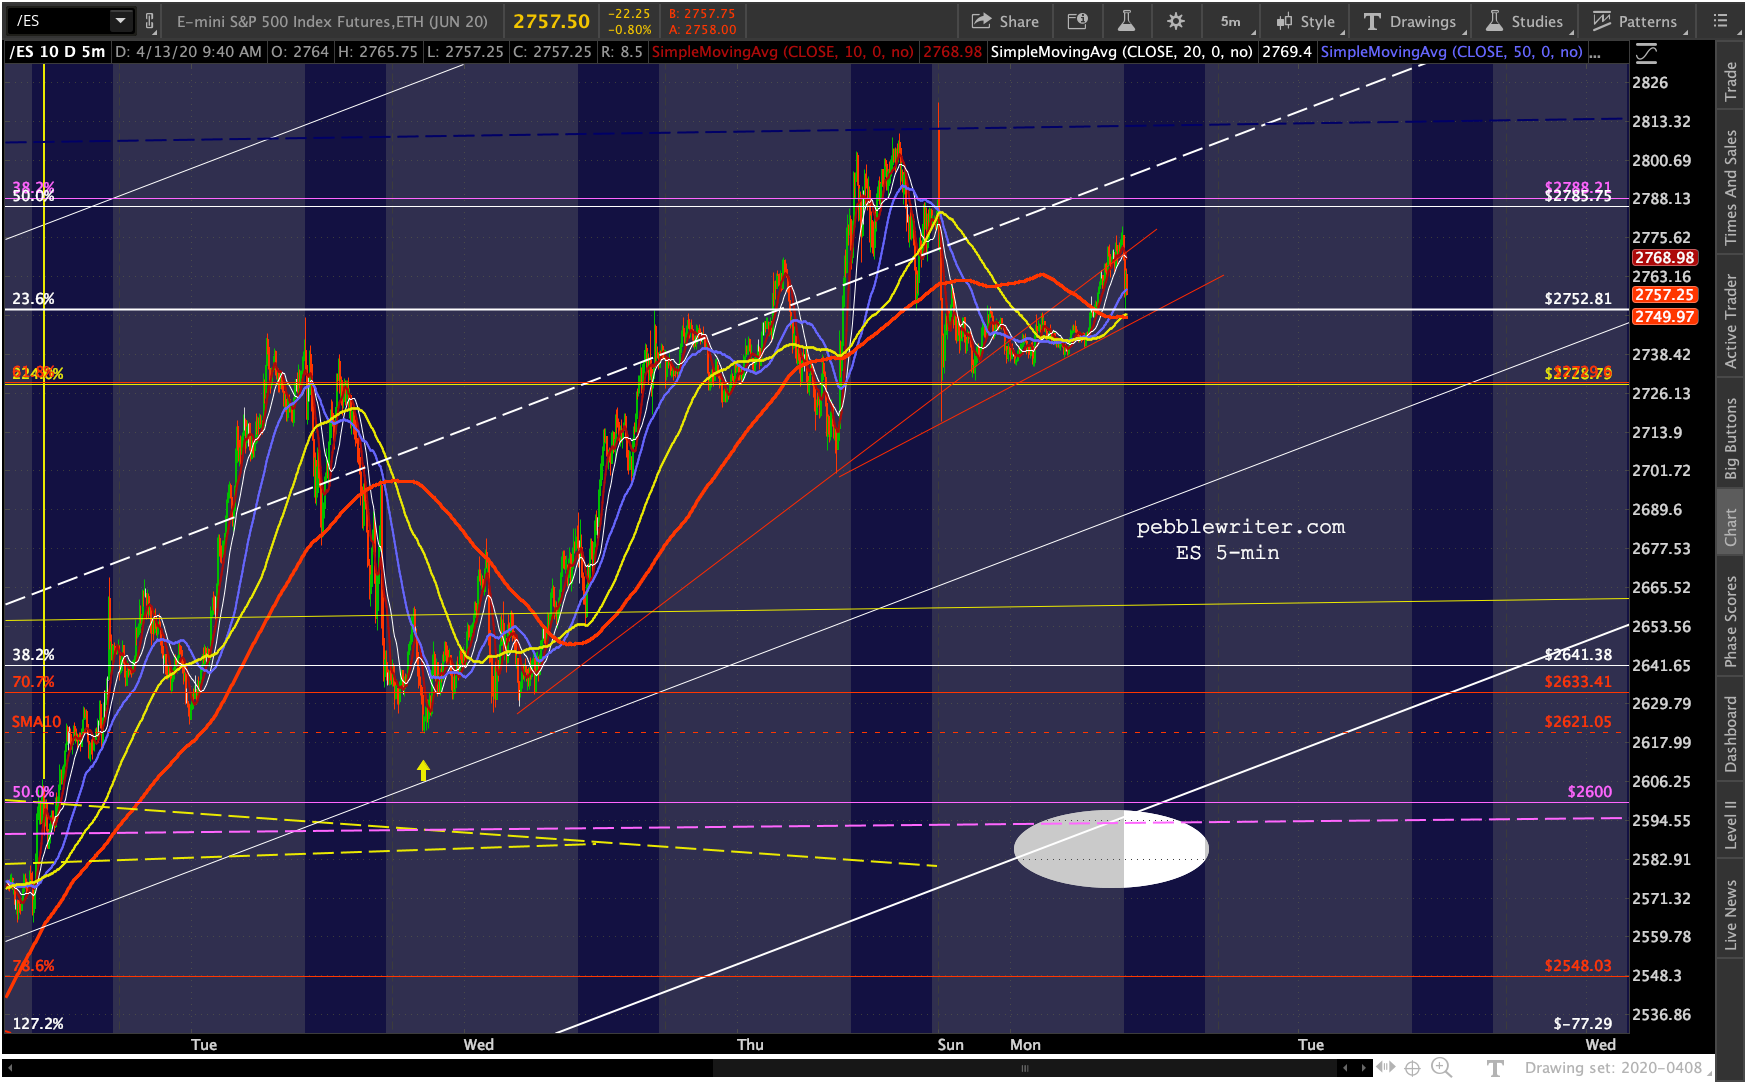
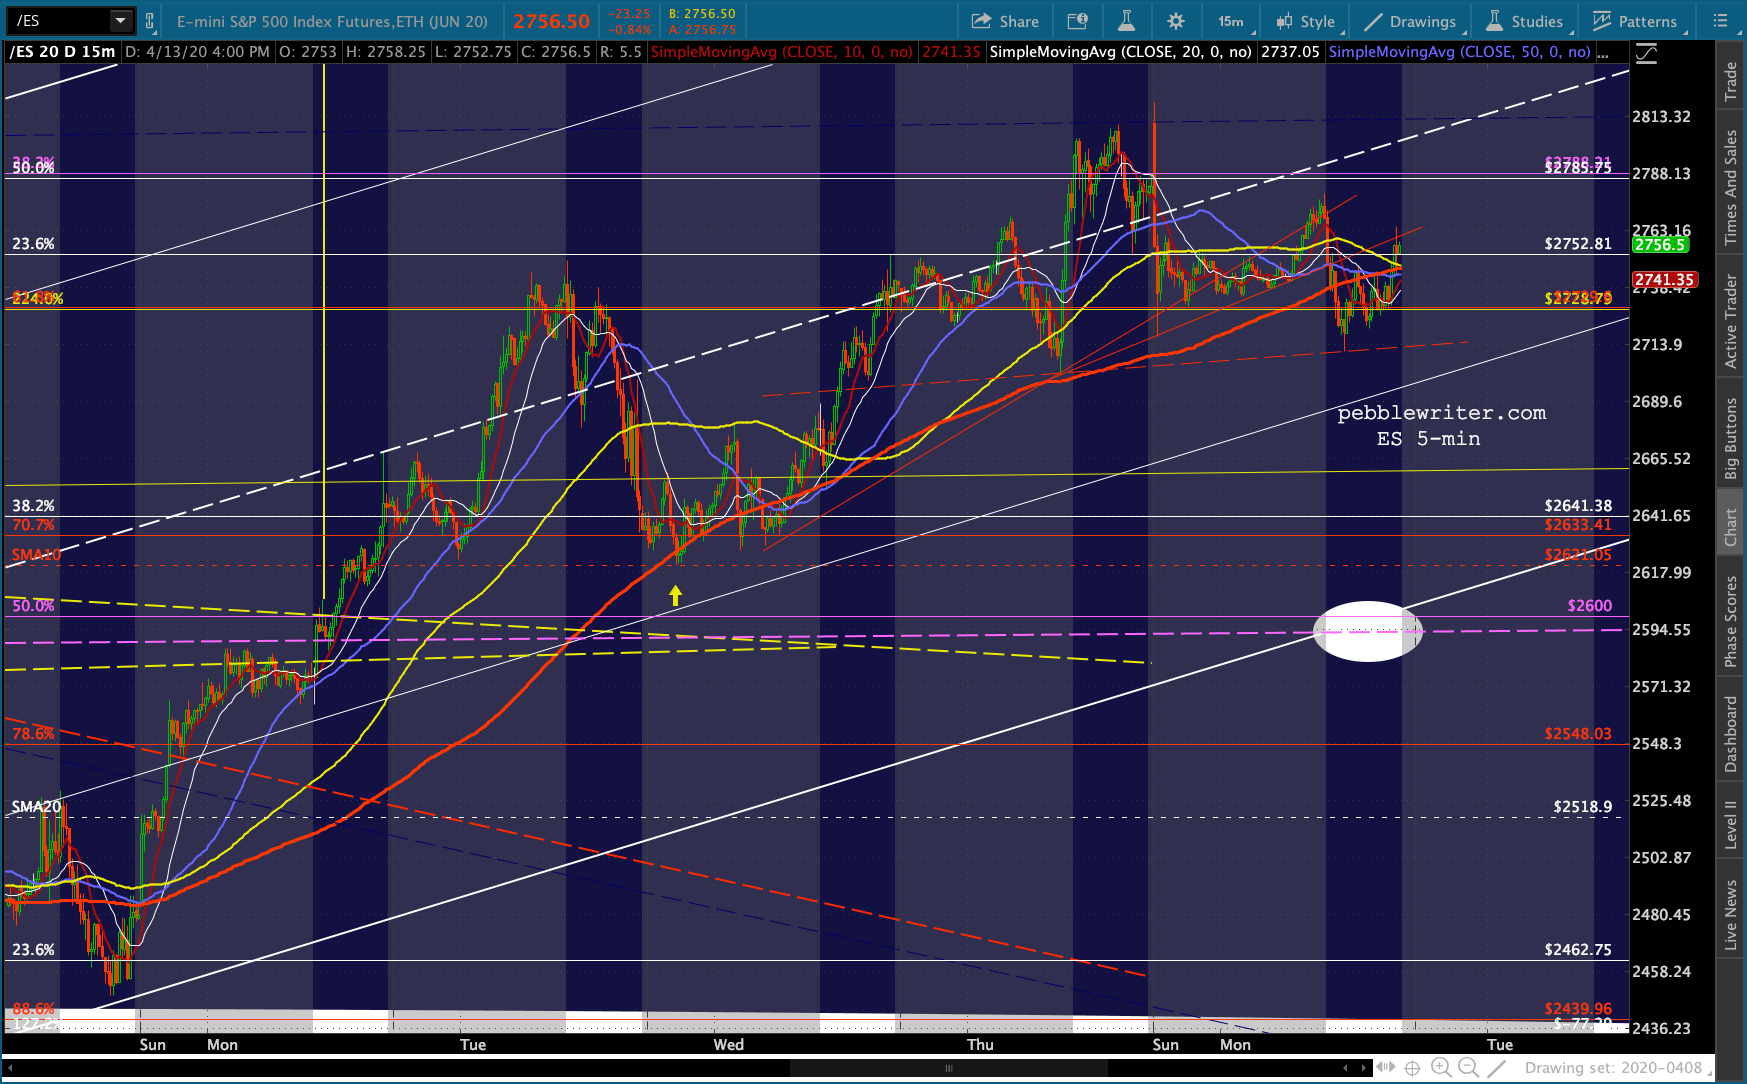
 Keep an eye on ES, which faces its first test with a little TL off its Thursday lows followed by a backtest of its 2.24 Fib at 2728.
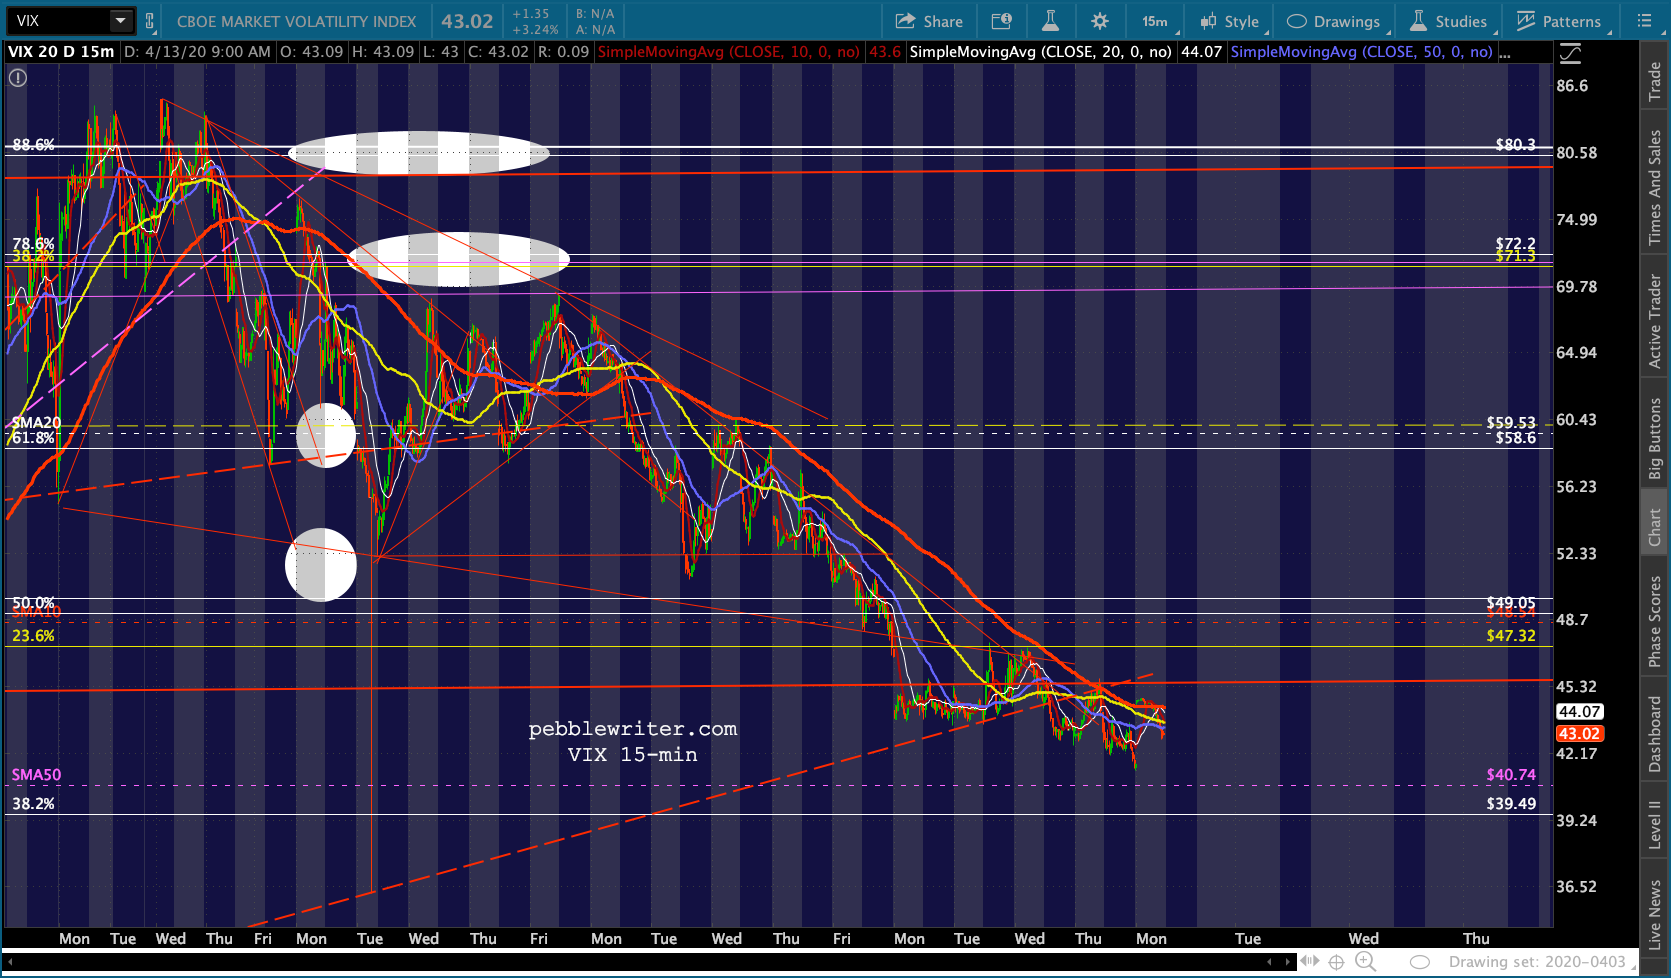
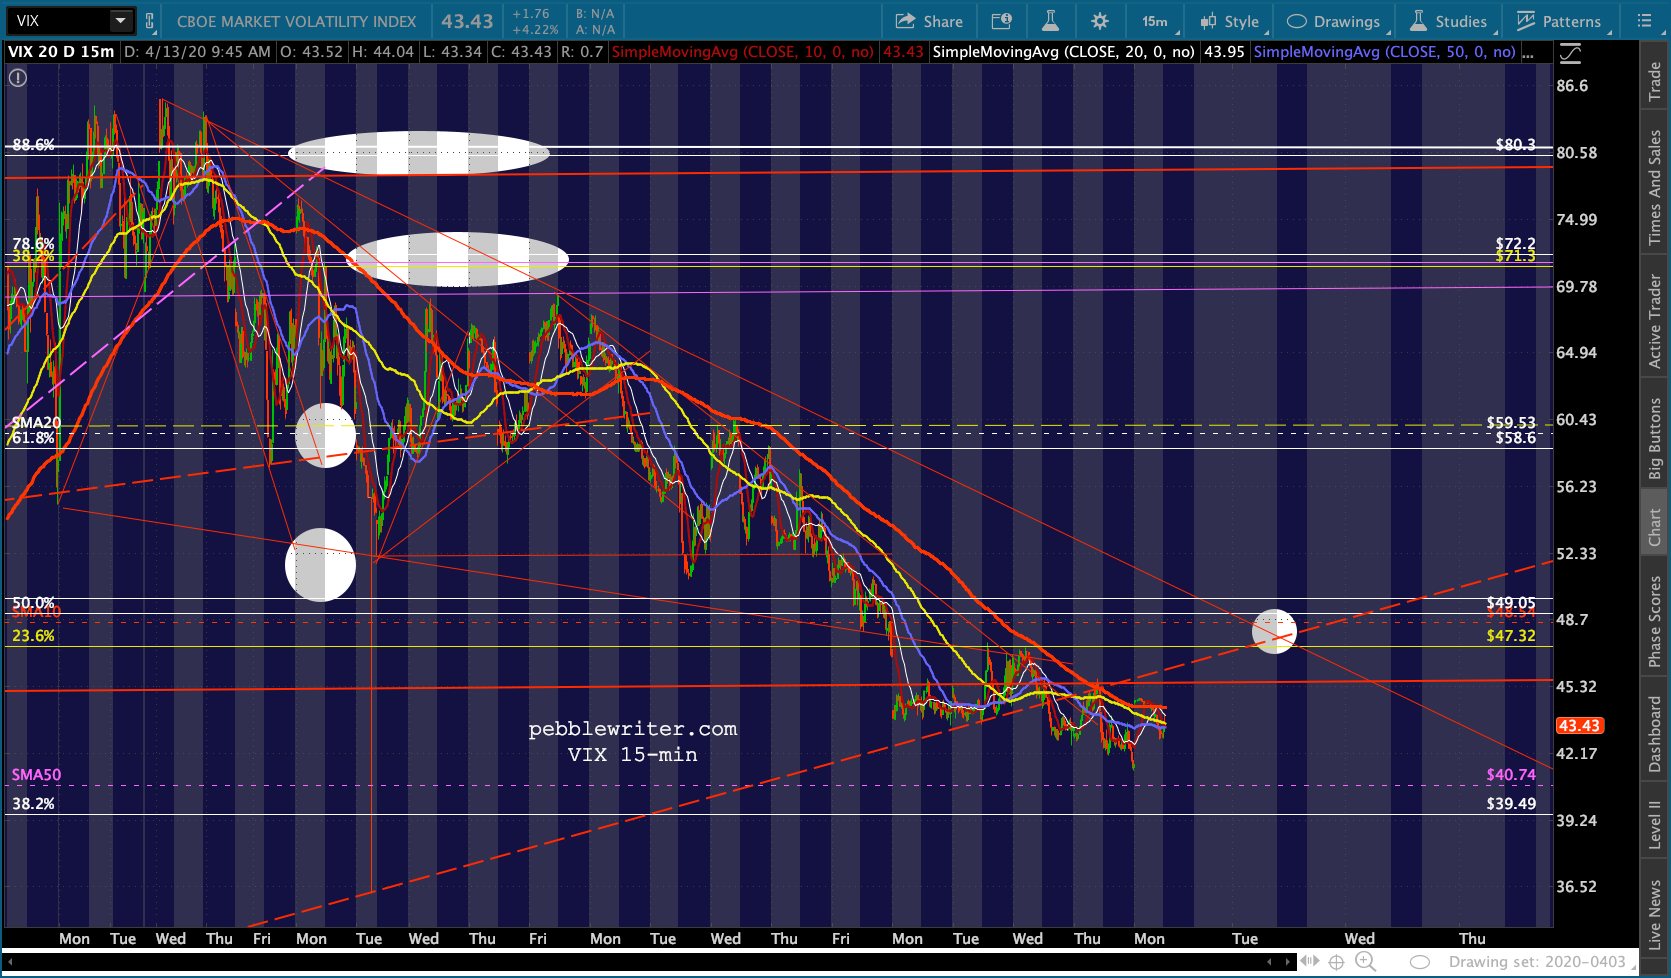
 Keep an eye, also, on VIX – which is backtesting its SMA15 200 again. It has proven to be strong overhead resistance ever since VIX dropped through it on Mar 30. A breakout today would open up a backtest of the SMA10 (48.54) and the red TL from the Mar 18 highs. The fact that they intersect today/tomorrow is suggestive of at least a little pop.
  One last note: SPX is currently trading about 9 points above ES. Its own 2.24 is way down at 2703.62 – about ES 2695. This out of sync behavior is usually resolved by ES bouncing at its support and ignoring SPX’s. Not always – but usually.
UPDATE: 4:08 PM
More VIX games, coupled with CL and RB being propped up translated into ES holding its 2.24 and SPX failing to break down. Having already completed one H&S Pattern, ES would have completed another if not for the ramp job into the close.
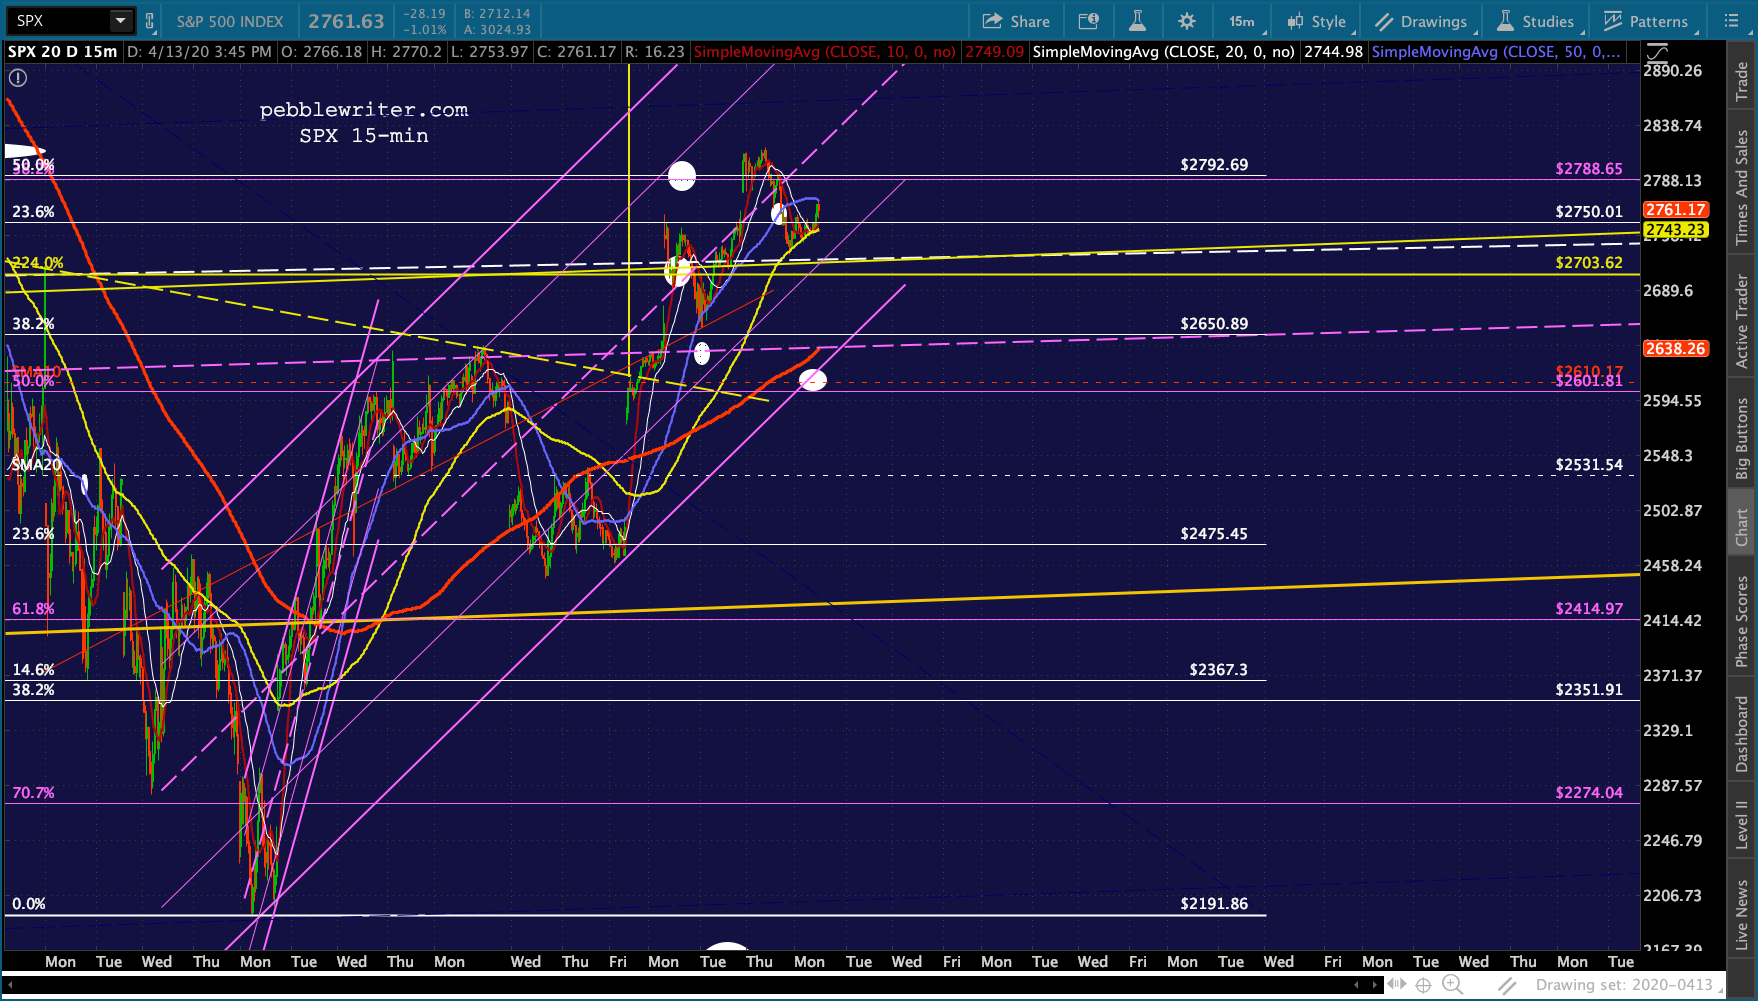 This is just silly: VIX 1% lower on a day when SPX was off as much as 68 points.
 DXY held its own…
 …even though USDJPY continues to falter.
 RB greatly outpaced CL, which couldn’t maintain this morning’s ramp. Tomorrow’s a new day, so we’ll see what new trick Trump can come up with.
 GLTA.
GLTA.